DEVELOPING A NEW STOCK SCORING
MODEL FOR SHARIAH-COMPLIANT
INVESTMENT
Shahril Simon
A thesis submitted in fulfilment of the requirements of the
University of Bolton for the degree of Doctor of Philosophy in Islamic Finance
ﺑِ
ﺴْ
ﻢِ
ﷲِ
اﻟ
ﺮﱠ
ﲪْ
ﻦِ
اﻟ
ﺮﱠﺣِ
ﻴﻢِ
Abstract
This study aims to develop a new stock scoring model, !_#$%&' model, that based on the musharakah parameters by using a momentum technique that separate the out-performing Shariah-compliant stocks from the under-performing. Motivation for this study is centred towards the performance dragged from Shariah-compliant stocks in relative to the conventional stocks during the stock market recovery and the out-performance of Shariah-compliant portfolio attributed by a few stocks only. Hence, separating the out-performing from the under-performing Shariah-compliant stocks will enhance the portfolio returns. In doing so, a quantitative research in time series analysis is designed to measure the momentum, periodical changes, of the musharakah parameters. The essential musharakah parameters identified are industry performance, management style, profitability ratios and capital growth. These musharakah parameters are then represented by the financial indicators such as sector return, book value, cash flow, equity return, asset return, total assets and enterprise value to determine the momentum of stock price returns.
Acknowledgements
This study would not have been possible without the support of many people. Many thanks to my supervisors, Dr. Sabri Mohammad, Professor Mohammed Abdel-Haq and Dr. Gillian Green who read my several revisions and helped to make some sense of the confusion. Also, thanks to the team of Centre for Islamic Finance at University of Bolton whom presented guidance and support.
Thanks also to the Government of Malaysia for fully funding this study. Additionally, this study has been benefited from comments of the participants at the Symposium on Quantitative Finance & Risk Analysis in 2015 and Symposium on Islamic Finance Industry in 2017; and seminar talks in the University of Bolton.
Lastly, thanks to my parents, wife, children, and friends who bear this lengthy exercise with me and always lending courage as well as love.
Table of Contents
Abstract iii
Acknowledgements v
List of Figures x
List of Tables xi
List of Symbols and Abbreviations xii
List of Appendices xiii
Chapter One: Introduction ... 1
1.1 Background of the Study ... 1
1.2 Problem Statement ... 4
1.3 Research Aim and Objectives ... 5
1.4 Research Questions ... 7
1.5 Theoretical Framework ... 9
1.6 Scope, Limitations and Assumptions ... 15
1.6.1 Scope of the Study ... 15
1.6.2 Assumptions of the Study ... 17
1.6.3 Limitations of the Study ... 18
1.7 Significance of the Study ... 20
1.8 Research Design ... 22
1.9 Overview of the Thesis ... 24
Chapter Two: Anatomy of Stock Scoring Models ... 27
2.1 Introduction ... 27
2.2 Theoretical and Empirical Review of Asset Pricing Models ... 28
2.2.1 Asset Pricing Theories ... 28
2.2.2 Empirical Research on Asset Pricing Theories ... 39
2.3 Fundamental Factors Affecting Stock Price Returns ... 44
2.3.1 Industry Performance Factors Influence on Stock Price Returns ... 46
2.3.2 Management Style Factors Influence on Stock Price Returns ... 48
2.3.3 Profitability Factors Influence on Stock Price Returns ... 50
2.4 Market Timing in Stock Scoring Model: Exploring Momentum Investing ... 54
2.5 Investment Strategies for Construction of Stock Portfolio ... 57
2.5.1 Market based Strategy ... 57
2.5.2 Weighting based Strategy ... 60
2.5.3 Style based Strategy ... 61
2.5.4 Principle based Strategy ... 63
2.6 Conclusion ... 67
Chapter Three: Conceptual Framework of Stock Scoring Model in accordance with the Shariah Principle of Musharakah ... 68
3.1 Introduction ... 68
3.2 Shariah Principles in Modern Islamic Finance ... 69
3.2.1 Sale Related Principle ... 71
3.2.2 Leasing Related Principle ... 72
3.2.3 Equity Related Principle ... 74
3.2.4 The Purity of Musharakah for Stocks Investment ... 75
3.3 Essential Parameters of Musharakah ... 77
3.3.1 Business Parameter of Musharakah ... 80
3.3.2 Management Parameter of Musharakah ... 81
3.3.3 Profit and Loss Sharing Parameter of Musharakah ... 84
3.3.4 Capital Contributions Parameter of Musharakah ... 86
3.4 Concept and Application of Shariah Principle of Musharakah on Stocks ... 88
3.4.1 Permissibility of Investing in Shariah-compliant Stocks ... 89
3.4.2 Stock Screening Methodology ... 90
3.4.3 Performance Attributions of Shariah-compliant Stocks ... 97
3.5 The Alchemy of Musharakah and Momentum Investing ... 98
3.5.1 Musharakah Parameters and Fundamental Factors ... 99
3.5.2 Momentum of Stock Price Returns: A Conceptual Framework ... 100
3.6 Conclusion ... 102
Chapter Four: Research Methodology ... 104
4.1 Introduction ... 104
4.3 Research Philosophy ... 105
4.4 Research Approach ... 107
4.5 Research Strategy ... 108
4.6 Research Design ... 109
4.7.1 Developing the Empirical Model for Stock Scoring ... 112
4.7.2 Methods of Collecting Data ... 130
4.7.3 Data Analysis Techniques ... 135
4.8 Limitations of Research Methodology ... 139
4.9 Conclusion ... 140
Chapter Five: Exploring the Statistical Relationship between Stock Scoring Model and Stock Price Returns ... 142
5.1 Introduction ... 142
5.2 Stocks Universe Analysis ... 144
5.3 Financial Characteristic Evidence about Shariah-compliant Stocks ... 147
5.4 Return Characteristic Evidence about Shariah-compliant Stocks ... 151
5.5 Relationship between Stock Price Returns and Financial Indicators ... 154
5.6 Cross Sectional Variation in Stock Price Returns ... 156
5.7 Distribution of Stock Price Returns by Composite Scores ... 158
5.8 Conclusion ... 162
Chapter Six: Examining the Robustness and Intuitiveness of Stock Scoring Model ... 165
6.1 Introduction ... 165
6.2 Stock Price Returns to Financial Economic Events ... 166
6.3 Stock Price Returns Conditional on Company Size Partitions ... 172
6.4 Stock Price Returns Conditional on Stock Orientation Partitions ... 174
6.5 Stock Price Returns Conditional on Trading Volume Partitions ... 176
6.6 Stock Price Returns Conditional on Stock Price Partitions ... 178
6.7 Stock Price Returns Conditional on Leverage Partitions ... 180
6.8 Return and Risk Analysis on Stock Portfolio Strategies ... 182
6.8.1 Raw Stocks Price Returns of Portfolio Strategies ... 190
6.8.2 Risk Adjusted Returns of Portfolio Strategies ... 194
6.9 Conclusion ... 198
Chapter Seven: Conclusion ... 201
7.1 Introduction ... 201
7.2 Summary of the Research Findings ... 201
7.3 Critical Reflections on the Research Findings and Theoretical Considerations ... 204
7.4 Research Implications and Recommendations ... 206
7.5 Limitations and Future Research ... 207
References ... 210
List of Figures
Figure 1-1: Theoretical Framework of Musharakah Parameters ... 12
Figure 1-2: Conceptual Framework for Momentum of Stock Price Returns ... 14
Figure 1-3: Research Process for Stock Scoring Model Development ... 22
Figure 3-1: Business Screening of Shariah-compliant Company ... 81
Figure 3-2: Management Selections of Shariah-compliant Company ... 82
Figure 3-3: Profit and Loss Sharing of Shariah-compliant Company ... 84
Figure 3-4: Capital Contributions of Shariah-compliant Company ... 86
Figure 3-5: The M_Score Model ... 102
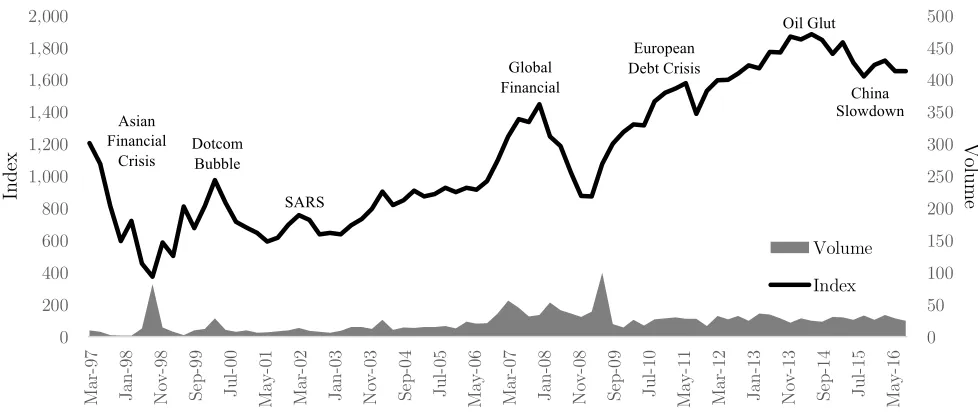
Figure 4-1: Rise and Fall of the Kuala Lumpur Composite Index ... 127
Figure 4-2: Stock Scoring Model Valuation Process ... 141
Figure 5-1: Stock Portfolio Returns by Industry Sectors ... 153
Figure 6-1: Raw Stocks Price Returns of Portfolio Strategies ... 192
List of Tables
Table 5-1: Universe of Selected Shariah-compliant Stocks ... 145
Table 5-2: Composition of Industries by Shariah-compliant Stocks and Market Value ... 147
Table 5-3: Financial Characteristics of Shariah-compliant Stocks ... 149
Table 5-4: Return Characteristics for Shariah-compliant Stocks ... 152
Table 5-5: Correlation between Stock Price Returns, Financial Indicators and M_Score ... 154
Table 5-6: Cross Sectional Regression of Financial Indicators ... 157
Table 5-7: Stock Price Returns by Composite Scores ... 160
Table 6-1: Rise and Fall of Kuala Lumpur Composite Index ... 167
Table 6-2: Relationship of Stock Price Returns to Financial Economic Events ... 170
Table 6-3: Returns Conditional on Company Size ... 173
Table 6-4: Returns Conditional on Stock Orientation ... 175
Table 6-5: Returns Conditional on Trading Volume ... 177
Table 6-6: Returns Conditional on Stock Price ... 179
Table 6-7: Returns Conditional on Leverage ... 181
List of Symbols and Abbreviations
Abbreviation Meaning
AAOIFI Accounting and Auditing Organisation for Islamic Financial Institutions APT Arbitrage Pricing Theory
BVA Book Value
CAPM Capital Asset Pricing Model
CCAPM Consumption Capital Asset Pricing Model EMH Efficient Market Hypothesis
GICS Global Industry Classification Standard ICAPM Intertemporal Capital Asset Pricing Model IPO Initial Public Offerings
MPT Modern Portfolio Theory OCF Operating Cash Flow ROA Return on Assets ROE Return on Equity RSI Relative Strength Index
SACSC Shariah Advisory Council of Securities Commission SDF Stochastic Discount Factor
TEV Total Enterprise Value TOA Total Assets
List of Appendices
Chapter One:Introduction
Chapter One
Introduction
1.1 Background of the Study
During financial market difficulties, Shariah-compliant stocks were resilient as compared to conventional stocks. In many major instances, the Shariah-compliant stocks out-performed the overall stock market during the financial crisis such as Indian Ocean Tsunami in 2004, United States Subprime Meltdown in 2007, Global Financial Crisis in 2008 and Eurozone Debt Crisis in 2011 as discovered by Kamso (2013). Although the Shariah-compliant stocks tend to out-perform over a long-term period, the stock price returns registered a performance dragged during stock markets recovery in global stock markets (Jawadi, et al., 2014) and in Malaysia stock market as well (Abdullah, et al., 2007). Besides that, noticeably, the out-performance relies on strong performance of a few Shariah-compliant stocks (Setiawan & Oktariza, 2013). Moreover, the Shariah-compliant stocks out-performed the broad benchmark because of exclusion of the conventional financial services stocks, higher exposure to technology stocks and low financial gearing stocks (Saiti, et al., 2014). Therefore, the ability to separate the out-performing Shariah-compliant stocks from under-performing Shariah-compliant stocks is necessary to enhance the stock portfolio returns.
investors to digest (Grundy & Martin, 2001). Hence, this study aims to develop a new stock scoring model using fundamental analysis with momentum investing technique based on principle of musharakah, referred as !_#$%&' model, to separate between the out-performing from the
under-performing Shariah-compliant stocks. The principle of musharakah governs the permissibility and conducts for investing in Shariah-compliant stocks (Al-Zuhayli, 2003). Consensus amongst the Shariah scholars agree that there are four essential musharakah parameters deduced as industry
performance, management style, profitability ratios and capital growth. These musharakah parameters are then conceptually integrated with fundamental analysis. Thus, applying momentum investing on fundamental analysis of musharakah parameters produces a robust and intuitive stock scoring model in separating out-performance with under-performance Shariah-compliant stocks.
Studying Shariah-compliant stocks requires research in a developed Islamic capital market with a strong regulatory framework that matches the international practice. Bursa Securities Malaysia has that where it is the most comprehensive and sophisticated Islamic capital market in the world as claimed by Furqani and Mulyany (2009). The bourse existence and innovations have influenced the development of Islamic capital market products and offerings within Malaysia as well as in the global markets (Laldin, 2008). Therefore, using Shariah-compliant stocks listed on Bursa Securities Malaysia is essential as a proxy to global Islamic capital market for various types of stock within diverse industrial sectors. In this study, data from June 1997 to September 2016 are observed because that was the earliest official Shariah-compliant stocks list issued by the Shariah Advisory Council of Securities Commission (SACSC). Moreover, only stocks with sufficient data will be considered and the same time must be within the approved list of Shariah-compliant stocks issued by SACSC. Those secondary data extracted for this study is mainly from the earnings statements and balance sheets reporting supplied by the Bloomberg Professional.
the investors to enhance the stock portfolio returns. Consequently, the !_#$%&' model helps those investors that invest in the Shariah-compliant stocks to have an informed investment decision by using the new stock scoring model that acts as an alternative investment analysis tool in forecasting the stock returns. Furthermore, the new stock scoring model will add to the existing choices of momentum investing techniques that help investors to improve the returns of their stock portfolio. Hence, the !_#$%&' model acts as an intuitive and yet a robust model for investors, given its capabilities to capture most information of financial data, especially in processing the recent information while less depending on the historical data in producing better results. Subsequently, the investors can rely on the model’s robustness in analysing and understanding their investment preference on maximising the source of returns especially on the Shariah-compliant stock as well as for the entire stock portfolio.
1.2 Problem Statement
Smart investors require a reliable investment analysis tool that can help them predicting the magnitude of the stock returns in managing a profitable stock portfolio. A robust investment analysis tool must be responsive to any financial economic events, does not discriminate given specific stock characteristics and able to assimilate with any stock portfolio strategies.
Relying on the out-performance of Shariah-compliant stocks as a portfolio for the entire investment period is not sufficient since the financial market events may not be in favour during certain market cycles (Ashraf & Mohammad, 2014). In some instances, the Shariah-compliant stocks are not performing well during the market recovery period after the major financial market crashes in marketplaces like Malaysia (Mansor & Bhatti, 2011), Saudi Arabia (Merdad, et al., 2010), Europe (Alam & Rajjaque, 2010) and United States (Al-Khazali, et al., 2014). During the market recovery period, stocks like banking and other highly leverage companies tend to out-perform the other stocks (Wang, et al., 2009). The out-performance is mainly due to an accommodative economic policy like lower interest rate and greater credit supply (Borio, 2014), that has attracted the consumers and businesses to obtain credit facilities to service the debts. This phenomenon creates disadvantages to the Shariah-compliant stock portfolio since they are unable to have position in a banking stocks and highly leverage geared companies. Having said that, Shariah-compliant stock portfolio can rely on other consumer-linked industries such as autos and household durables within the consumer discretionary sector.
stocks strictly based on certain financial indicators of a company using a time series analysis. The new stock scoring model provides investors with an option to objectively rank the stock based on its aggregate financial indicators in selecting the out-performing stocks and omitting the under-performing stocks. The selection of the stock can be measured within the same industry or market universe. Moreover, a good model should be able to resilient through any financial economic events and does not discriminate between stock specific characteristics. Although other fundamental analysis or technical analysis can provide similar assistance, there is no conceptual explanation for variables or factors selected in investors preferred investment strategy (Roll & Ross, 1980). The alternative to fundamental analysis of forecasting stock returns in this study is conceptually driven by the principle of musharakah. In addition, Dania and Malhotra (2013) suggest that the principle-based investing, such as Shariah investing, works better with fundamental analysis.
1.3 Research Aim and Objectives
This study aims to develop a new stock scoring model by using a fundamental analysis with a quantitative approach based on musharakah parameters in determining the direction or momentum of Shariah-compliant stock prices. The momentum strategy that generates the trade signal is then used to separate the winning from the losing stocks. In meeting the research aim, this study develops three main research objectives in providing a clear direction of the research works. The research objectives are organised as follows:
1. To explore the statistical relationship between the stock price returns and the newly developed !_#$%&' model based on the musharakah parameters.
score of the !_#$%&' model. The composite score of !_#$%&' model is a quantitative approach to determine the direction or momentum of stock price returns. It signifies a trade signal to separate between out-performing from under-performing Shariah-compliant stocks. Tabulating the stock price returns in relation to the composite score leads to the distribution of stock price returns. A bigger composite score should translate to a higher stock price returns and vice versa for a lower composite score. Hence, distribution of stock price returns for pseudo stock portfolio to !_#$%&' model illustrates the separation between out-performing and under-performing Shariah-compliant stocks. With that, the portfolio returns will be improved through the selection of a quality stocks. Therefore, by validating the first research objective of this study, investors can use the new stock scoring model to separate the under-performing stocks in the existing stock portfolio or to add only out-performing stocks into the stock portfolio.
2. To investigate the robustness and intuitiveness of the newly developed !_#$%&' model.
A robust model allows the new stock scoring model to respond to any financial economic events without any breakdown or adjustment. Financial economic events trigger an impact to the stock market of which resulting to a bullish or bearish market. Many models have the capabilities to out-perform in a bullish market and not otherwise. In addition, a robust model should be flexible enough to handle issues like missing values and a newly listed company (IPO). On the other hand, an intuitive model is able explain the source of stock returns and must be adaptive to the specific stock characteristics. Therefore, the challenge for this study is to show that the new stock scoring model adjusts to various conditions while maintaining its predictive power. At the same time, institutional and sophisticated investors require a portfolio manager or an investment analyst to explain the source of returns. With that, any successful investment model or strategy should be able to tabulate the source of returns in the portfolio attribution analysis.
A reliable stock scoring model should respond to any portfolio strategies. In this study, pseudo portfolio of buy-and-hold, long-only and long-short investment strategies are created to test the investment returns given a few selections of investment strategies. The former strategy is the reference portfolio for the investment performance analysis. Whereas, the long-only investment strategy is where the investors purchase a stock when a buying signal triggers and disposing the stock before the signal ends. As for the long-short investment strategy, it takes the advantage of both stock prices direction. A buy signal will prompt a buy long stock and sell signal will suggest a sell short stock. Short selling is where an investor sells the borrowed stock at a higher price with intention to buy back at a lower stock price in the future. It is a worth noting that, the practice of short selling in Islamic finance is still developing and remains unsettled. Another pseudo portfolio strategies evaluated are those based on stock orientation and company size. The former has three pseudo portfolios, value style, blend style and growth style portfolios. Whereas, company size has a small, medium and large capitalisation stocks. In addition, these pseudo portfolios are adjusted for weighting schemes. The equal weighted, price weighted and market capitalisation weighted schemes is selected to examine the investment performance. The rationale is to avoid any biasness of this study towards specific stock characteristics like company size, stock orientation, trading volume, stock price, leverage, trade position and weighting schemes.
1.4 Research Questions
In fulfilling the research aims and objectives, this study addresses these three specific research questions of the !_#$%&' model distribution in relation to the stock price returns; model robustness and intuitiveness; and portfolio strategies profitability. The three primary research questions are presented as follows:
In meeting the first research objective, this study requires an investment analysis tool that explains stock returns as well as can generate better relative returns for stock portfolio. The !_#$%&' model when applies the musharakah parameters provides a composite score that correlates to distribution of stock price returns. Hence, the distribution of stock returns improves by shifting to the right of the table partition. In another word, a stock with higher composite score will have a better stock price returns in the future. Additionally, the relationship of composite score and stock price returns is further confirmed with statistical significance tests and correlation analysis.
2. How does the !_#$%&' model newly developed by this study, respond towards the stock market temporal and stock specific characteristics?
The stock market temporal refers to the financial economic events that normally correlates with the state of the stock market cycle. It is a common behaviour of the economy between expansion (growth) and contraction (recession) phases. Macroeconomic factors such as gross domestic product, interest rates, employment rate and consumer consumption can indicate the current phases of the economic cycle. Hence, a good stock scoring model should be able to respond to these financial economic events with persistent results. On the other hand, stock specific characteristics refer to common traits that effecting the stock price returns anomaly. Thus, excess stock price returns by the !_#$%&' model should be the key effect to the anomaly. Whereas, the stock specific characteristics should not be the contributing effect to the stock price returns anomaly. Although stock price returns may be influenced by the stock specific characteristics, microeconomic and macroeconomic factors, the !_#$%&' model explains the stock price returns better by applying the musharakah parameters. Moreover, the source of the stock price returns is important for investors
to articulate and rationalise their investment decision for a given individual stock or stock portfolio.
A good stock scoring model should be able to help investor to make an informed investment decision. As an investment analysis tool, the adaptability and applicability of a stock scoring model must be universal to various portfolio strategies. Growing a portfolio depends on many factors such as investor risk tolerance, time horizon and the amount of capital that can be invested. In this study, the selected portfolio strategies are buy-and-hold, long-only and long-short investment strategies. In addition, the portfolio strategies based on stock orientations, company sizes and weighting schemes are included. These portfolio strategies create 81 permutation of pseudo stock portfolios which are commonly used by the investors. Therefore, the new stock scoring model will be a preferred investment analysis tool if it adapts well with those investment strategies. Moreover, the !_#$%&' model provides a flexibility to the investors in choosing their suitable stock portfolio
strategies.
1.5 Theoretical Framework
of selecting the factors randomly, this study leverages on the emergence of Islamic finance practice by applying the principle of musharakah as a conceptual framework.
Equation 1-1: Stock Prices to Factors )* = ,-+ ,/+ ⋯ + ,1
where, ) is the stock price returns, 2, and , is the macroeconomic and/or microeconomic factors, 3, affecting stock price returns.
On the other hand, the principle of musharakah can be applied to ascertain the Shariah-compliant status of securities (Usmani, 1999); to construct index for securities (Abdul-Rahman, et al., 2010); to value project financing (Jaffar & Isa, 2011); and to evaluate asset pricing (Selim, 2008). Musharakah in direct translation is a commercial partnership where a group of investors combine
Figure 1-1: Theoretical Framework of Musharakah Parameters1
Source: Usmani (1999) and Al-Zuhayli (2003)
In this study, the perspective of those parameters in !_#$%&' model as microeconomic traits are measured as industry performance, management style, profitability ratios and capital growth. To quantify those musharakah parameters, this study selects seven financial indicators that best explained the four musharakah parameters. Having said that, selection of the financial indicators is backed by the literatures that are aligned with the Shariah principle of musharakah. Moreover, the financial indicators are supported by the previous empirical research through the statistically significant analysis and correlational studies. As for the industry performance, it is represented by the sector return. Whereas, the management style is represented by the book value and cash flow. While, the profitability ratios are represented by equity return and asset return. Finally, the capital growth is represented by asset size and enterprise value. With that reference, the sector return describes the sensitivity of a stock against its peers within the same industry. Whereas, the book value and cash flow explained how well the management of a company uphold its operational
1 Interestingly, the legendary investor, Warren Buffet, also applies similar parameters when investing in stocks as
efficiency. While, equity return and asset return justified the investors investment valuation in the company. And, capital growth and enterprise values described the ability of a company to bring it to the next level in a competitive environment. To make these financial indicators more meaningful in terms of market timing, this study adopts a momentum investing in searching for direction or momentum of stock price returns.
Figure 1-2: Conceptual Framework for Momentum of Stock Price Returns2
The !_#$%&' model investigates historical two-period in time series analysis for a quarterly data of financial indicators in determining the momentum of stock price returns. Then, each indicator is measured with rate of change between two quarters of which transpose into a score, !_#$%&' as shown in Error! Reference source not found. below. Whereas, a combination of the indicators’ scores will form a composite score (also known as !_#$%&', without the word model after it). A positive change should result a higher score which ranges from minimum of 0 to maximum of 100 and vice versa. Therefore, the higher composite score will suggest a higher expected stock price returns in the following quarter. In addition, this study examines the insights behind the !_#$%&'
model using the microeconomic factors. This is to show on how the model is linked to mainstream the fundamental analysis and the market timing. In developing the new stock scoring model, this study looks for financial indicators that explain stock price returns, similar to the fundamental analysis in stock price discovery. Moreover, this study emphasizes the additional role of the model
2 Notation 4
5 refers to ∆Sector Return = ∆Total Sector Return; ∆Book Value = ∆Net Asset Value; ∆Cash Flow =
∆Operating Cash Flow; ∆Equity Return = ∆ROE; ∆Asset Return = ∆ROA; ∆Asset Size = ∆Total Assets; and
∆Enterprise Value = ∆Total Enterprise Value.
F in an ci al In dica to rs M ush ar aka h P ar am et er s
1. Sector Return
2. Book Value 3. Cash Flow
4. Equity Return 5. Asset Return
6. Asset Size 7. Enterprise Value
as compared to the traditional stock analysis and denotes the insights that the !_#$%&' model can offer.
Equation 1-2: Changes in Stock Price Returns to Changes in Factors ∆)* = ∆,-+ ∆,/+ ⋯ + ∆,1
where, ∆)* is the rate of change in stock price returns, 2; and ∆,1 is the rate of change in microeconomic factors, 3, that affecting the stock price returns.
In summary, the fundamental analysis and momentum investing theories together with the principle of musharakah act as a basic element in developing a research framework for this study. The unique proposition of musharakah parameters combined with vigorous momentum investing, in which the former is the basis of investing in Shariah-compliant stocks, can indicate the momentum of stock price returns. Eventually, the !_#$%&' model helps to separate out-performing from under-performing stocks and assist investors to make an informed decision.
1.6 Scope, Limitations and Assumptions
Although this study is working towards the perfection of the !_#$%&' model, it sometimes must confine to a certain boundary. This does not make the study loss its traction to develop a new stock scoring model that is robust and intuitive. Having said that, the scope, limitations and assumptions stated below are not exhaustive and only those that pertinent are considered by this study.
1.6.1 Scope of the Study
funds, real estate investment trusts and exchange traded funds. These funds are excluded from this study since it comprises of portfolio of stocks or assets which require difference set of price modelling approach (Bello & Janjigian, 1997) (Kao, et al., 1998).
Next, universe for the dataset of this study will be the 636 Shariah-compliant stocks listed on Bursa Malaysia Securities as approved by the SACSC with sufficient financial information. Although this study wishes to include the data from other stock markets, the maturity and sophistication of Islamic finance ecosystem in general and Islamic capital market specifically that focus on Shariah-compliant stocks are very limited. These are important elements to ensure that the dataset is fully reflected on all available information particularly in relation to Islamic finance.
Additionally, dataset used in this study are primarily derived from the financial statements and periodical reports as well as releases. Instead of going through each individual company financial statements and periodical reports, these secondary datasets are extracted from the financial information service provider. This approach may avoid any data transportation error due to typo as well as redundancy. Moreover, dataset from the financial information service provider allows a flexibility in data management and better data quality.
1.6.2 Assumptions of the Study
Fama (1970) coins the idea of efficient market hypothesis where given all the available information, investors will not able to out-perform the overall market over period. In contrast to the theory, this study assumes stock market is inefficient. In other words, investors can beat the broad stock market with right stocks selection and assets allocation. Many studies have shown that their investment models or strategies have out-performed the overall stock market with significant profits. For instance, Jegadeesh and Titman (1993) in their work, discover that by buying a stock that has performed in the past will generate a positive return performance in medium term investment horizon. Hence, stock price momentum can attribute to the investment profitability.
In addition, investors are assumed to be perfectly rational and driven by self-interest. This suggests that investors will assign a utility threshold to every stock in the portfolio based on the expected return and risk characteristics. Hence, the stocks that generate the highest utility threshold will be selected (Jolls, et al., 1998). Furthermore, every investor in the stock market is supposed to have an access on the same set of information.
Next, executing an active portfolio strategy will definitely incur a transaction cost. The related costs for stock trading include, but not limited to, brokerage fees, stamp duty, clearing fees, etc. Since, the new scoring model tests several portfolio strategies, a different costs structure will prevail. Naturally, some of the strategies in the absence of transaction costs generate higher gross return. However, in most studies, transaction costs do not result inferior to portfolio total return. Instead, the costs of purchasing a stock and thereafter selling it, is much smaller with persistent stock price momentum (Gârleanu & Pedersen, 2013). Therefore, this study assumes no transaction costs as adding one may not necessarily provide a distinctive result between the pseudo portfolio strategies.
return, asset size and enterprise value are assumed to be independent and identically distributed where each random variable stated has the same probability distribution as the others and all are mutually independent. Additionally, since this study is heavily depending on the secondary data provided by the financial information service provider, this study assumes all the secondary data gathered from data provider maintains its accuracy and quality. It is crucial for this study to starts with a reliable data in ensuring the robustness of the research in achieving optimal results.
Lastly, this study makes an assumption that the seven selected financial indicators are proxies to the four musharakah parameters based on practical industrial experience and market practice as well as previous studies in conventional finance. For instance, the sector return represents the industry parameter; book value and cash flow represent management parameter; equity return and asset return represent profitability parameter; and asset size and enterprise value represent capital parameter of musharakah.
1.6.3 Limitations of the Study
Moreover, large data size is required in this study to observe the company fundamentals and to accommodate the time series analysis. Hence, tendency for a missing value of financial statements is greater. Financial statements are sourced from the secondary data i.e. financial information service provider. There are two possible causes of the missing value. Omission of data while transmitting from company’s financial statements or error when transposing the data from financial information service provider’s system into the spreadsheet. Besides that, missing value may occur particularly in first one-fourth of the observation periods where quarterly results are yet to be compulsory for public dissemination. Though the !_#$%&' model is robust enough to respond on the missing values, this incident may result to a less intuitive model.
Furthermore, some of the financial information are only available on a quarterly basis. However, this study applies a time series analysis in which it works better with a higher frequency of dataset like daily information. The limitation is that the financial statements used are only available on a quarterly basis at best except for stock prices and market value of which can be retrieved on a daily basis. Higher frequency of dataset will make the new stock scoring model process recent data more effectively. Thus, making recent financial statements more reflective and help the new stock scoring model to respond better. Furthermore, quarterly releasing of financial statements may mean a company's fundamentals have significantly changed. Hence, the quarterly results may show that the investment decisions have been lagged in timing. This consequence lead to a lack of opportunity to react quickly to exit the stock investment. Although quarterly data can be perceived out-of-date and losing recent information, it has some advantages in terms of trading transaction related expenses and data acquisition related costs.
since investors might miss the opportunity to optimise their returns. Moreover, market forces determine the daily (continuous) changes of stock prices because of supply and demand. If more investors want to purchase a stock than to sell it, then the stock price increases and otherwise the stock price will fall. Notwithstanding, the concept of supply and demand is easy to grasp. However, the challenge is what makes investor favours a certain stock and does not favour another stock.
1.7 Significance of the Study
Despite the growing interest in Islamic finance generally and Shariah-compliant investments particularly, there are limited empirical research that study the financial applications based on the principle of musharakah. Having said that, numerous attempts have been applied for determining Shariah-compliant status of the securities (stock and Islamic bond or sukuk), construction of
financial index and valuation of project financing as well as asset pricing. However, application using a principle of musharakah in forecasting the stock price returns is very new. Thus, this study offers some new empirical evidences from different perspectives. First, the musharakah parameters represented with financial indicators can predict the stock price returns. Second, the !_#$%&' model based on musharakah parameters can separate the out-performing and under-performing stocks. At the end of this study, the !_#$%&' model is likely to assist those investing in Shariah-compliant stocks to have an informed investment decision by using the model as an alternative investment analysis tool in forecasting the stock price returns and constructing a profitable stock portfolio.
activities. More important, there are abundant of institutional and retail investors who subscribe to Shariah-compliant investments philosophy. These characteristics make Shariah-compliant stocks
listed on Bursa Malaysia Securities as an important subject matter.
Additionally, momentum strategy refers to studying the strength of stock prices or trade volume in each time frame. The strategy uses single component in data analysis for forecasting technique which is also known as a technical analysis. Concerns of the investors regarding the technical analysis are their inability to explain the source of returns and their biasness towards the single factor. Addressing those concerns, this study offers a blend of multi factor fundamental analysis to explain the source of returns and to remove the single factor biasness with the assistance of technical analysis in stock prices discovery. This combination is a unique proposition that demonstrates the collaborations between fundamental and technical analysis, instead of working in silos, they can work hand in hand.
The other importance of this study is related to a modern portfolio theory. Momentum investing employs many similar mathematical tools where technical analysis which is viewed as contradict to the modern portfolio theory. For example, the effectiveness of both fundamental and technical analysis is disputed by the efficient market hypothesis which states that stock prices are basically unpredictable (Fama, 1970). However, many empirical studies have shown that investors can predict stock price returns while stock prices adjusted themselves (Cenesizoglu & Timmermann, 2012). Therefore, this study is essential in adding to the existing empirical evidences that the stock price returns are predictable from the perspective of Islamic finance. In addition, this study has also demonstrated that the musharakah parameters selected form part of the fundamental analysis.
1.8 Research Design
In modest form, the stock prices are explained by macroeconomic and microeconomic factors. However, the macroeconomic factors influence on individual stocks could be apprehended through the microeconomic characteristics. It can be captured in common factors such as capital formation, industry affiliation or association towards growth (Rosenberg & Marathe, 1976). Therefore, proposition of the factors selection in this study are deduced from the musharakah parameters like industry performance, management style, profitability ratios and capital growth in which represented by sector return, book value, cash flow, equity return, asset return, asset size and enterprise value indicators. These seven fundamental financial indicators are extracted from the financial statements and released of respective stock company under study. Figure 1-3 below summarised the research process for model development and examination using systematic and scientific methods.
Figure 1-3: Research Process for Stock Scoring Model Development
Shariah-compliant stocks listed on Bursa Securities Malaysia is the primary universe in this study.
permissible by Shariah and must pass the financial threshold for cash and debt positions. Moreover, each stock must qualify for certain conditions such as; need to be actively traded on the stock exchange; need to have sufficient data of at least a fundamental financial indicator for the period of study; and must be assigned with recognised industrial classification standard in representing its respective industry sector.
This study conducts a quantitative research with time series analysis of the secondary data obtained from the financial information service provider. The time series analysis applied two-quarter observations throughout this study in establishing the !_#$%&' model that suggests the momentum of stock price returns is influenced by the rate of changes in financial indicators. As for the study period, an observation horizon begins the same as when Malaysia first introduced its Islamic equity capital market in June 1997 until the recent quarter where the list of Shariah-compliant securities issued by SACSC and financial information required are available as of September 2016. The historical financial data are gathered quarterly for each financial information required from the respective financial statements of a stock company. Financial indicators like total sector return, book value, operating cash flow, return on equity, return on assets, total assets and total enterprise value as well as data like stock prices, market capitalisation, book value ratio, trading volume, leverage ratio and earnings are gathered for computation of the composite score and the investment performance analysis respectively.
benchmark of aggregate performance to the referred industry sector. Tabulation of the composite scores relative to the stock price returns creates the distribution of stock price returns. This process is repeated for each industry sector and pseudo stock portfolio.
The !_#$%&' model expects a higher composite score should result a better stock returns in the future. Whereas, future stock price returns are lesser given a lower composite score. Typically, a score more than 50 and reaching 100 suggests a positive stock returns in the following quarter. On the other hand, a score of 50 and reaching 0 would behave otherwise. Therefore, the new stock scoring model will fit well if the composite scores are statistically significant and highly correlated to distribution of stock price returns. In addition, the new stock scoring model envisages a higher correlation between composite score and stock price returns in any financial economic events and for every stock portfolio strategy. At the same time, a good model should result only and long-short strategies performing better than buy-and-hold portfolios in any given financial economic circumstances and common traits. Furthermore, for every indicator to be a good yardstick, it must be statistically significant in explaining the stock price returns. The significance tests are conducted for various portfolio strategies namely buy-and-hold, long-only and long-short portfolios with the stocks are rebalanced every quarter or every year in each industry sector as well as the entire stocks of this study. Therefore, the !_#$%&' model should have greater predictive capability if the fundamental financial indicators are statistically significant and highly correlated with the stock returns. Moreover, when !_#$%&' model applied to the various stock portfolio strategies, the model produces a positive stock portfolio returns. With that, investors should have a robust and intuitive investment analysis tool to make an informed investment decision during the stocks selection process in generating a profitable stock portfolio.
1.9 Overview of the Thesis
questions; theoretical framework; scope, limitations and assumptions; and research design of the study. The sections in the chapter provide research foundation to this study.
While, in Chapter Two, this study turns to the new stock scoring model exploring and discussing on the asset pricing theories, fundamental analysis and momentum investing. It discusses the seminal works on asset pricing models, financial indicators and investment techniques that require to examine the stock prices of which need a supporting conceptual framework in making the model robust and intuitively appealing.
Subsequently, the supporting conceptual framework is then being discussed in Chapter Three, deliberating on the principle of musharakah that focuses in momentum of stock price returns. In addition, the origin and the applications of principle of musharakah are also presented.
In Chapter Four, this study turns to the research methodology of quantitative analysis in developing a new stock scoring model. The time series analysis with longitudinal approach are explained with systematic and scientific methods.
The next two chapters present empirical results. In Chapter Five, the financial and return characteristics of the secondary data are then tabulated as evidences about Shariah-compliant stocks. It describes the common characteristics of the Shariah-compliant stocks as compared to the previous studies. Moreover, this study analyses the relationship between the stock price returns and the respective financial indicators. Subsequently, this chapter analyses the cross-sectional variation in stock returns given the musharakah parameters. Furthermore, the chapter observes and analyse the distribution of stock price returns by composite scores. Thereafter, this study measures the model fitting to the respective portfolio strategies.
size partitions stock orientation, trading volume, stock price and leverage partitions. In getting to the bottom of investor’s ultimate investment objective, this study analyses the raw stock price returns and risk adjusted returns when the model implemented on the respective investment portfolio strategies.
Chapter Two:Anatomy of Stock Scoring Models
Chapter Two
Anatomy of Stock Scoring Models
2.1 Introduction
The theoretical and empirical reviews of stock scoring models are originated from the previous research by several prominent authors whom rigorously concern on establishing a basic understanding of asset pricing. Asset pricing studies have been evolving since the eighteenth centuries with the concept of a utility function in investment. However, the greater attention to the asset pricing studies was only began in the 1960s. Not much progress on the empirical side of the studies but the advancement in the computing technology has enabled more complex mathematical equations to be addressed efficiently. In this chapter, the focus is on seminal works of asset pricing theories particularly on stocks asset class. Subsequently, this chapter deliberated on the empirical works surrounding the asset pricing theories.
in Section 2.4. Moreover, it observes the convergence of fundamental analysis and momentum investing in uncovering the asset pricing model. On the other hand, Chapter 2.5 discusses the ways that asset pricing models can be implemented on commonly used portfolio strategies. Lastly, Section 2.6 concludes this chapter.
2.2 Theoretical and Empirical Review of Asset Pricing Models
Asset pricing is a study of understanding the way of financial assets are being priced which includes stock, bond and hybrid instrument (Cochrane, 2009). Motivation for price discovery, is for the investor to enjoy the financial returns. Generally, the asset with a lower price tend to generate higher rate of return and there are financial assets that pay higher average returns than other like stock and bond. LeRoy and Werner (2014) highlight that there are two central principles in the asset pricing. First, no arbitrage principle suggests that the market forces will align financial asset prices so that it will eliminate the arbitrage opportunities. For an arbitrage opportunity to occur, the financial asset need to have a chance to be included in a portfolio with no cost, no loss and possibility of a gain. Second, market equilibrium principle states that financial market investing seller and investing buyer balance each other and, as a result, financial asset prices become optimised. Normally, when there is too much investing seller for a financial asset, the price goes down and vice versa when there too much investing buyer. The consequences for balancing effect of investing seller and investing buyer will result a state of equilibrium.
2.2.1 Asset Pricing Theories
century. Daniel Bernoulli3 in 1738 examined the proposition that an investor’s risk tolerance level should contain not only the potential losses that can occur, but also the investment’s utility function or intrinsic value of stock prices. The argument is not accepted by him since this method was unable to determine multiple scenarios that possibly happen. However, Bernoulli claims that the determination of the value of an item must not be based on its price, but rather on the utility it yields”(Sommer, 1954, p. 24). Hence, he implicitly initiates the concept of higher risk will result to a higher return. For example, to increase the rate of returns of a fixed income portfolio, an investor can blend the portfolio with stocks of which have a higher risk or volatility as compared to the fixed income securities (Sommer, 1954). Since then, the development of asset pricing model has evolved modestly until the portfolio selection theory was introduced in 1950s.
2.2.1.1 Portfolio Selection Theory
A risk averse investor can optimise a portfolio by diversifying the securities selection while managing the market risk (Markowitz, 1952). This theory of portfolio selection in investment management has been one of the most important and influential economic theories. Over the years this theory evolves to commonly known as modern portfolio theory (MPT) where it is possible for an investor to build an optimal portfolio using efficient frontier that maximise the expected stock return for a given risk threshold. Markowitz suggests that analysing one specific stock is not enough in understanding the expected risk and return. Therefore, diversifying into the basket of securities, will reduce the riskiness of the portfolio.
Alternative framework was the safety first model, developed independently by Roy (1952) although, the model has many similarities to Markowitz's model. Essentially, both models are addressing the same investors’ concern on the probability that their investment will not cross the unintended risk
level. Hence, the model represents the expected securities return as the dependent variable whereas risk as the independent variable. As a result, this has been accepted as standard by the investment professionals. Since Markowitz published the seminal paper a few months earlier than Roy, the father of portfolio theory is generally referred to Markowitz.
2.2.1.2 Mean-Variance Frontier
In helping individual investor identifies an optimal portfolio, Tobin (1958) improvises the Markowitz’s model further. The improvised model assists the investors to optimise the investment portfolio between riskless asset (such as cash and government bonds) and risky asset (such as bonds and stocks). Tobin model illustrates that the non-cash assets are independent from the cash in the investment allocations. Hence, the decision for asset allocations between non-cash assets will determine the investor’ risk appetite.
An intuitively appealing asset allocation model is then proposed by Tobin (1958) to support his work. Tobin model suggests the asset allocations problem in stages where the first level should aggregate within the assets and thereafter, between the asset types. Hence, the risk aversion or risk tolerance of an investor can be managed with asset mix i.e. allocation to cash or government bonds and other assets. However, an optimal investment portfolio must be independent regardless an investor risk appetite. This proposition of separation theorem provides a foundation to construct an efficient portfolio. Although the separation theorem explained the portfolio selection process, Markowitz’s full covariance model is still required. This is because of the onerous in data and computational requirements of this method, especially for applications that hold individual securities.
computing technology, it is clearly impossible data requirement during 1950s and 1960s. However, this can be easily done during that time if the stock universe is limited to a few dozen stocks. Sharpe (1963) has addressed these challenges with his simplified model for portfolio analysis. Taking an insight from Markowitz (1959), Sharpe concurs that stocks will move in tandem with broad stock market. The model assumes that stock price returns are generated with a known mean and variance; and linearly correlated with market index with a known degree of exposure. Given only three parameters required for each stock, the risk measurement and portfolio optimisation processes have been greatly simplified. Sharpe’s method is readily extended to take on broader and sophisticated factor models for asset pricing. The Markowitz’s full covariance model and Sharpe’s index model, along with Sharpe’s introduction of the capital asset pricing model marked the beginning of modern finance.
2.2.1.3 Capital Asset Pricing Model
capital. The paper shows that the risk premium for each stock is proportional to the covariance of the portfolio with the total of all the stocks in the market.
Subsequently after Treynor (1962) started his work on asset pricing, an article on relationship between securities prices and risk attributes was written by Sharpe (1964). The article issued by Sharpe mentions that the diversification strategy in the asset allocations reduce the portfolio risk. Nevertheless, each asset carries its own risk which is not being addressed by the research paper. Having said that, he constructs market equilibrium theory given the level of risk based on the asset prices. The market equilibrium theory suggests a clear relationship between the asset prices and the various risk components. The paper was published (after revision) the following year. Thereafter, Lintner (1965a) (1965b) and Mossin (1966) independently published separate papers to supplement the Sharpe (1964) paper. The CAPM remains an important reference for modelling investor’s expected return until the 1980s.
Following the presentation of the Sharpe, Lintner and Mossin research papers, many authors have loosened the rigid assumptions that underline the original CAPM. One of the prominent authors is Black (1972), who suggests that the CAPM must be modified when riskless asset is not available which commonly known as the zero beta CAPM. Another significant version is by Brennan (1970), who discovers that the initial framework of CAPM is remained the same, but taxes are introduced into the equation. Mayers (1972) proves that when the investment portfolio comprises illiquid assets, the CPAM also remains the same as the initial framework. Thereafter, Solnik (1974) and Black (1974) have expanded the CAPM to cover the international investments. If the same assumptions are loosened up, the strength of the CAPM will be more robust (Williams, 1977). Finally, there are several models that extent the CAPM from the typical one period structure to a continuous time setting.
present a case, to link the CAPM with index model of Sharpe (1963) in portfolio construction. They mention that investors can decide to manage a completely diversified portfolio and differentiate it against the rest of the market. The approach has trigged the idea of market neutral hedge funds. The current portfolio optimisation and risk management techniques in the industry are often advancement from the concept introduced by Treynor and Black.
2.2.1.4 Arbitrage Pricing Theory and Multi Beta Pricing Model
When Roll (1977) critique rolling on the unrealistic for diversified portfolio to include all available assets, Ross (1976) has prepared the alternative model called the arbitrage pricing theory (APT) that could potentially solve the issues in CAPM while still holding the underlying idea of the latter. The main concept behind the APT is that there are some numbers of systematic effects influencing long-term average stock price returns. Nonetheless, there is an absence of definite number of systemic effects required to make the APT works.
However, the APT is essential to the introduction of multi factor model. Unlike Sharpe (1963) single factor model, there are many factors that represent the fundamental elements in the company and the economy. The multi factor models permit a stock to have more than one factors to measure returns. Each measure captures the influence of respective pervasive factor to the stock price returns. This can be similar to the multiple betas in intertemporal CAPM (ICAM) (Merton, 1973). Nevertheless, Ross (1976) mentions that the APT is much more an arbitrage relationship than an equilibrium function. For instance, if the stocks share the same specific characteristics, then the stocks will have a linear function with the same expected stock price returns. Otherwise, there will be a potential arbitrage for a long-short trading strategy to profit from risk-return disparity.
meaningful to have a variety of stocks with unique characteristic and a portfolio requires an infinite number of stocks. With a finite set of stocks, each of which has specific characteristic, the APT model restriction will only be an approximation. Since the initiation of the APT, the selection of factors, the quantity of factors and the interpretation has been intensely deliberated. In the earliest empirical research of the APT, Roll and Ross (1980) use factor analysis that permits inference of the factors from the dataset on stock price returns. Their findings show that there are optimal four microeconomic factors in the stock market. The benefit of factor analysis study is that the factors discovered from the dataset explain a large fraction of the risks in that dataset over the period under consideration. The shortcoming is that the factors discovered mostly have no economic explanation. Because of that, Roll and Ross (1980) urge that a work should be focused at discovering a more intuitive statistical explanation of the underlying factors.
Another perspective of factor analysis selection is to measure fundamental macroeconomic variables as the factors selection. Among the earliest research based on macroeconomic factors was by Chen et al. (1986). They discover that stock prices are significantly influenced by several factors. First, the changes in industrial production. Second, the yield spread between short-term and long-term government bonds. Third, the spread between low-and high-grade bonds. Fourth, the changes in expected inflation. Fifth, the changes in unexpected inflation. The yield spread between short-term and long-short-term government bonds is translated as an indicator for the economic cycle. Whereas, the yield spread between low-grade and high-grade bonds is considered as an indicator for overall market risk in the economy. Nevertheless, although after considering these macroeconomic factors, the broad stock market performance has no further effect on the average individual stock prices. Similarly, as many would assume, the crashes on oil prices also have no additional effect on stock prices.
vague that it leads to very impossible to test whether the APT is correct or incorrect. Moreover, while the expected stock price returns for any stock or portfolio is related only approximately to its factor influences, the actual factors selection in relation to stock prices requires additional assumptions. He says that if the studies on APT hold onto its restriction, even for stocks, they are essentially testing an equilibrium form of the APT. Hence, they are again challenged with all the inherent problems that arise when testing the CAPM. Although Dybvig and Ross (1985) have countered to these arguments of the APT’s restriction, the fact remains that, like the CAPM, there are major limitations to any empirical research of the APT.
2.2.1.5 Consumption Model
One bothering characteristic of both Merton’s ICAPM and Breeden’s CCAPM persisted. Although in these studies, the demand side of the capital markets was intricately developed up from the microeconomic selections of investors, the microeconomic selections of methods which decide the allocation of stocks were predominantly not considered. Therefore, Merton (1990) articulates as in the development of the early CAPM, the analysis highlights the demand side of the capital markets and thus treats as largely exogenous the dynamics of the supply curves for stocks. Consequently, the model does not specify all the structural equations of endogenous behaviour needed for a full equilibrium analysis of the method.
theories. Hence, the model uses fundamental factors to predict the interest rate and the structure of the entire yield curve that will affect the term structure.
From the time when some exceptions are given to assist the work in dynamic asset pricing (Constantinides & Duffiel, 1996), the focus has primarily been on smoothening the underlying assumptions of the work developed by Merton (1973); Breeden (1979); and Cox et al. (1985a) (1985b) and establishing a general framework connecting dynamic asset pricing to the earlier research of Arrow and Debreu (1954). The leading hindsight from ICAPM is that various risk factors are needed to explain the stock prices. While the multi period work was being considered, many studies were also trying to use this hindsight to obtain a single period models that could better explain the returns and risks.
2.2.1.6 Stochastic Discount Factor
Cochrane (2000); Lettau and Ludvigson (2001); Hodrick and Zhang (2001); Dittmar (2002); Farnsworth et al. (2002); Chen and Ludvigson (2009); Kan and Robotti (2009); Li, Xu and Zhang (2010); and Gospodinov et al. (2013) have effectively utilised it. Asset pricing models in SDF form are usually estimated and tested using generalised method of moment (GMM) techniques. Essentially, the SDF approach and the HJ-distance metric are valid regardless the asset pricing model is linear or not in a distribution of risk factors. Although, asset pricing can be validated using HJ-distance metric, this study uses the common statistical analysis such as correlation and significant tests.
As the expected stock price returns have a linear function in beta pricing model, Black et al. (1972) and Fama and MacBeth (1973) suggest the cross-section regression (CSR) analysis as the preferred approach in empirical finance since it is simple and intuitive. While there are various versions of the CSR approach, the fundamental method always contains two steps or passes. In the first pass, the betas of the test stocks are estimated using the usual ordinary least squares (OLS) time series regression of stock price returns on some common factors. Whereas, the stock price returns in second pass on the test stocks are regressed on the betas estimated from the first pass. Operating this second pass CSR on a period by period basis allows getting the time series of the intercept and the slope coefficients. The average values of the intercept and the slope coefficients are then applied to estimate the expected stock price returns for risky stocks with no systematic risk and factor risk premium. In addition, the error term is calculated from these time series as well. Since the approach is simple and intuitive, CSR methodology has always been the commonly used tool to measure model misspecification and factors relationship study (Kan, et al., 2013) (Kandel & Stambaugh, 1995). This shows the magnitude of beta for the model in the cross-section analysis in average stock price returns for a set of stock portfolios.
given to the underlying concept in factors selection and to the need for more responsive method in estimating and analysing stock price returns.
2.2.2 Empirical Research on Asset Pricing Theories
The focus of the empirical research in asset pricing is on applications of econometric methods in finance. Discussions in this study include assessments of asset pricing models, return predictability in time series and cross-section, empirical findings of capital market deficiencies, analyses of individual and professional investor behaviour. The highlights help this study to understand the asset pricing subject better with the interplay among economic theory, econometric methods and important empirical results. Moreover, it could explore into new research areas of current studies.
2.2.2.1 Risk and Volatility
The risk is simply classified as volatility as in the eminent EMH and MPT theories. The two assume that investors are generally risk adverse. Therefore, they are prepared to consume more risk in expecting for higher returns. At the same time, investors are willing to get lower returns for a less risky investment. As Markowitz (1952) and Sharpe (1964) looked for an explanation of risk, they picked volatility to define risk. This is when the higher the volatility of the stock portfolio, represented as either in terms of standard deviation or beta, the higher is the risk. The theories have gained tractions both in academia community as well as investment professionals since they are modest and comprehensive to be studied further in the empirical works.
MPT’s equations; and are implicit in the definitions of variance and covariance. In practice, investors must replace the estimates using historical data of return and volatility in the equations. In most studies, the expected values unable to process the recent information when the historical data are generated (Low, et al., 2016).
In more vital concern, investors are trapped with estimating key values from historical stock market data as the theories wanting to model risk in terms of the likelihood of losses, nevertheless states nothing about the attributes to those losses. Moreover, the risk estimation used are probabilistic in description, not structural. Another shortcoming with the Markowitz approach is that the variance of stock portfolio is not a whole amount of the risk taken by the investor. For instance, computation of value at risk for a given stock portfolio, is impossible if the distribution is unknown and only the variance and mean are available. Therefore, the Markowitz approach does not inform an investor which portfolio investor can afford to buy if investor wants to maximise the portfolio risk. However, in the event an investor needs to operate the Markowitz approach to pick a suitable portfolio, investor could use a robust statistical technique to measure extreme the values (Fantazzinni, 2009).
2.2.2.2 Market Beta