R E S E A R C H
Open Access
Voice activity detection algorithm based
on long-term pitch information
Xu-Kui Yang
1,2, Liang He
3, Dan Qu
1*and Wei-Qiang Zhang
3Abstract
A new voice activity detection algorithm based on long-term pitch divergence is presented. The long-term pitch divergence not only decomposes speech signals with a bionic decomposition but also makes full use of long-term information. It is more discriminative comparing with other feature sets, such as long-term spectral divergence. Experimental results show that among six analyzed algorithms, the proposed algorithm is the best one with the highest non-speech hit rate and a reasonably high speech hit rate.
Keywords:Voice activity detection, Non-stationary noise, Long-term pitch envelop, Long-term pitch divergence
1 Introduction
Voice activity detection (VAD) is an essential module in almost every audio signal processing application, includ-ing codinclud-ing, enhancement, and recognition. VAD can in-crease efficiency and improve recognition rates by removing insignificant parts from the audio signals, such as silences or background noises and retaining human voices. In high signal-to-noise ratio (SNR) conditions, it is a relatively simple task since we can reach a satisfying result only by computing the frame energies and setting an appropriate threshold for classification [1]. However, in modern real-life applications, audio signals are always corrupted by the background noises which make those simple VAD algorithms deteriorate dramatically.
For VAD under extreme noisy conditions, a consider-able amount of research has been done [2–5]. And the main difference of these algorithms lies in the exploited feature sets in the systems, including spectrum-based fea-tures [6], cepstrum-based feafea-tures [7], fundamental frequency-based features [8], entropy [9], harmonic [10], and energy-based features. Among these features, long-term spectral divergence (LTSD) feature [11] stands out because of its simplicity, adaptability, and good behaviors. Nevertheless, the performance may still need to be im-proved in non-stationary noises, especially in environmen-tal noises such as factory or battlefield noises which are
usually characterized by large, irregular random bursts embedded in a relatively stationary background [12].
In this paper, we propose a new VAD algorithm based on long-term pitch divergence (LTPD) features. Different from the LTSD feature, LTPD takes advantage of time-varying pitch information [13] and can deal with the tough noises mentioned above. In a sense, the pitch is a special type of spectrum. Both of them try to decompose audio signals into spectral bands; however, the scale of pitch bands is not linear but in some logarithmic fashion, that is termed as the equal-tempered scale. In musically related task, this logarithmic form of decomposition has been proved to be more suitable for human perception and pitch-based features are more discriminative. Thus, com-pared to LTSD, LTPD not only benefits from the long-term information about speech signals but also benefits from the logarithmic decomposition of speech signals which is more reasonable than spectrum. The experimen-tal results show that the average performance of the pro-posed method is the best among the VADs analyzed.
The outline of this paper is as follows: Pitch-based audio features are given in Section 2. Then, we present our LTPE-VAD algorithm in Section 3. Section 4 depicts database and experimental setup and analyzes evaluation results. Finally, the conclusion is given in Section 5.
2 Long-term pitch divergence features
2.1 Pitch-based audio features
The equal-tempered frequency scale used in Western classical music is not linear, but logarithmic due to the * Correspondence:[email protected]
1Zhengzhou Information Science and Technology Institute, Zhengzhou,
China
Full list of author information is available at the end of the article
facts that humans perceive musical intervals approxi-mately logarithmically. Let f(p) denote the center fre-quency of the pitch p∈[21 : 108] corresponding to the musical noteA0 toC8. And the pitch 108 is correspond-ing to frequency 4186 Hz. Then, the relationship be-tween the pitch p and its center frequencyf(p) is given by:
f pð Þ ¼2p−6912⋅440 ð1Þ
Pitch-based audio features are extracted by decompos-ing audio signals into 88 frequency bands, where each band corresponds to a pitch of the equal-tempered scale [13]. The decomposition is realized by a suitable multi-rate filter bank consisting of elliptic filters [13]. This rep-resentation of audio signals can then be used as a basis for deriving various audio features of various character-istics [13, 14], such as chroma pitch, chroma log pitch, and chroma energy normalized statics [15].
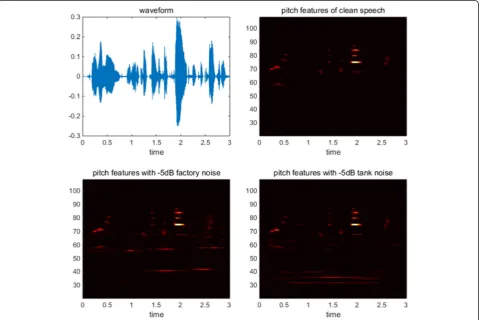
Figure 1 shows the waveform of an audio recording and its corresponding pitch features in various noise en-vironments. It can be seen that the energies of this audio are mostly concentrated in pitches range from pitch 57 to pitch 102. And other pitches are easily corrupted by
noise. Theoretically, it has a weak effect on speech intel-ligibility when filtering out the low frequency parts of speech [16] which are easy to be distorted by noises. The low frequency endpoint is commonly 300 or 500 Hz, but no lower than 220 Hz [17] corresponding to pitch 57. While the most critical intelligibility elements of speech lie above 3 kHz, the most of average energies in speech signals lie below 3 kHz [17] which are of more importance for speech/non-speech detection. Thus, pitches range from 57 to 102 are used in the proposed method.
2.2 Definition of LTPD
LetXbe a sequence of pitch features and, X(p,t) be the value ofpth pitch at framet, wherep= 57,⋯, 102 andt
= 1, 2,⋯,T. The M-order long-term pitch envelope
(LTPE) is defined as follows:
LTPEMðp;tÞ ¼ maxfX pð ;t−MþmÞjm¼0;1;⋯;2Mg ð2Þ
The noise pitch features N is estimated from X by
using the MMSE-based estimator [18]. And the average
noise pitch N pð Þ for the pth pitch band at frame t is defined as:
Ntð Þ ¼p 1tððt−1ÞNt−1ð Þ þp N pð ;tÞÞ;t
¼2;⋯;T ð3Þ
where, N(p,t) is the noise feature value of pth pitch at frametandN1ð Þ ¼p N pð ;1Þ.
The M-order long-term pitch divergence between
speech and noise is defined as the deviation of the LTPE respect to thepth average noise pitch and is given by:
LTPDMð Þ ¼t 10 log10
1 46
X102
p¼57
LTPE2Mðp;tÞ
N2
tð Þp
!
ð4Þ
The definitions are quite identical between LTPD and LTSD. The main difference is the scale of spectral bands, logarithmic rather than linear. However, this subtlety is of considerable importance because logarithmic spectral decomposition is superior to the linear form in theory as well as in practice. And this conclusion can be proved by comparing the distributions of LTPD and LTSD shown in Section 2.3.
2.3 LTPD distributions of speech and non-speech
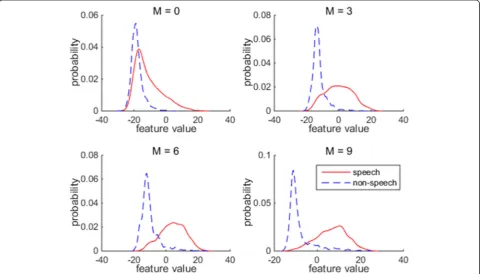
In this section, we will present the distributions of the LTPD as a function of the window orderMso as to clar-ify the motivations for the algorithm proposed. To study
the distribution of the LTPD feature, speeches from the TIMIT corpus [19] and noises (factory, fighter jet, des-troyer, and tank noise) from the NOISEX-92 corpus [20] were used in the analyses. More details about the data-bases will be presented in Section 4.
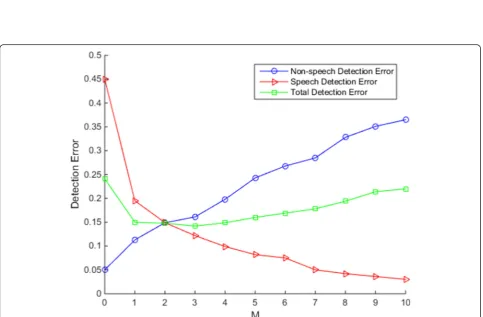
Figures 2 and 3 show the effects of window length on distributions of LTPD and LTSD for speech and speech, respectively. Figure 4 shows the speech, non-speech, and total detection errors vs. the window length. Comparing Fig. 2 with Fig. 3, it can be concluded that the LTPD feature is more discriminative than LTSD fea-ture. In Fig. 2, it is not difficult to find out that the dis-tributions of speech and non-speech are more easily
separated along with the increasing window length M.
In corroboration, the speech classification error is re-duced when increasing the order of the long-term win-dow, as shown in Fig. 4. The optimal value of the order
of window would be M= 3 according to the total
mis-classification errors of speech and noise in Fig. 4. The conclusion about LTPD above is identical to that the conclusion in [11] concerning the effect of window length on LTSD feature. Consequently, LTPD can also take advantage of the long-time information of speech as LTSD does.
3 The proposed VAD algorithm
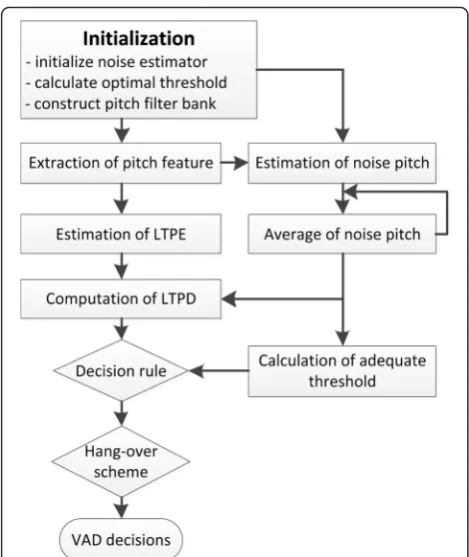
A flowchart diagram of LTPD-based VAD algorithm is shown in Fig. 5. The specific procedure can be described
Fig. 3Effect of window length on the LTSD distribution (SNR =−5 dB): speech (red full line) and non-speech (blue dashed line)
as follows. In the initialization step, the MMSE-based noise estimator is initialized by using the first Nframes and the pitch filter banks are designed (see [13] for de-tails). After initialization, the pitch features are extracted by applying the pitch filter banks to audio signals. Then, the LTPE is estimated by means of Eq. (2), the average noise pitch feature is obtained by using Eq. (3), and the LTPD is computed as Eq. (4). The original VAD deci-sions are made by comparing the LTPD value of each frame to a given threshold γ. If the LTPD value is larger than the threshold, the current frame is labeled as speech; otherwise, it is labeled as silence. The final VAD decisions are obtained from original decisions by apply-ing the hang-over scheme.
It should be noted that the distribution of LTPD changes with SNRs, thus the threshold should also vary accordingly. In LTSD-VAD algorithm, the thresh-old is set according to the observed noise energy levels. Here, we use a SNR-based method to deter-mine the threshold [11]:
γ¼
γ0 SNRð Þt≤SNR0
SNRð Þt−SNR0
SNR0−SNR1 γ0−γ1
þγ0 SNR0<SNRð Þt <SNR1
γ1 SNRð Þt≥SNR1 8 > < > : ð5Þ
where, SNR(t) is the SNR estimated at frame t. SNR0
and SNR1 are the SNRs in the cleanest and noisiest
background noises, and γ0 and γ1 are their optimal
thresholds, respectively.
This method is the very similar to [11]. However, since we use an MMSE-based noise estimator, the estimation of SNR is easier:
SNRð Þ ¼t 10 log10
Xt
τ¼t−K
X
pX
2ðp;τÞ
Xt
τ¼t−K
X
pN
2ðp;τÞ−1
0 @
1
A ð6Þ
where, Kis a constant. The estimation of SNR is only based on theK+ 1 frames before framet; thus, it can di-minish the effect of time-variation of SNR.
4 Experiments and results
To illustrate the effectiveness of LTPD-VAD, some up-to-date voice-active detection methods, which have been proved to be noise robust, are chosen for comparison. They are Sohn [21], Harmfreq [10], LTSD [11], LTSV [2], and LSFM [22].
4.1 Data and experimental setup
To evaluate the proposed method, utterances from TIMIT corpus are used. Utterances in TIMIT are on average no longer than 4 s and contain a very small number of non-speech segments. Thus, single utterance is too short to evaluate a VAD algorithm properly. Hence a number of randomly chosen utterances from every dialects (i.e., DR1 to DR8) have been concatenated into a single speech recording, adding 2.5 s of silence at the beginning, ending, and junctions of the utterances. And amplitudes of each utterance have been normalized in order to equalize the power. The initial labels have been obtained by a simple energy VAD and examined visually. 47.06 % of the whole samples are labeled as ac-tive speech samples. Two datasets, development and test, have been constructed, and the duration of each dataset is about 600 s. The development and test data-sets are used to estimate the parameters and evaluate the performance, respectively.
All noise types are taking from NOISEX-92 corpus. And the complete list of noise types used in this evaluation is:
factory1 (noise near plate-cutting and electrical welding equipment);
factory2 (noise in a car production hall);
leopard (military vehicle noise);
m109 (tank noise);
opsroom (destroyer operations room background noise);
f16 (F-16 cockpit noise);
buccaneer1 (Buccaneer jet traveling at 190 knots)
buccaneer2 (Buccaneer jet traveling at 450 knots)
engine (destroyer Engine Room noise)
hfchannel (noise in an HF radio channel after demodulation)
machinegun (a .50-caliber gun fired repeatedly)
pink (pink noise)
volvo (Volvo 340 noise)
white (white noise)
Among these noises, only white and pink noises are stationary.
To add noises to speeches at a desired SNR, the open-source Filtering and Noise Adding Tool (FaNT)1is used. The audio signals have been divided into 50 ms-long non-overlapping frames and windowed with a periodic Hamming window. The pitch features are extracted by
using The Chroma Toolbox.2 The MMSE-based noise
estimator is based on MATLAB implementation
estnoi-seg in Voicebox.3The order of LTSD is 3. And to
com-pute LTSV and LSFM, the long-term window length is 6 and the parameter of Welch-Bartlett method is 2. All of these parameter values are smaller than those recom-mended in the corresponding references because of a longer frame length and a lack of the overlap factor.
The receiver operating characteristic (ROC) curves and area under curve (AUC) values are used to describe the average performance of the VAD algorithms. And detection performances under different SNR levels are also assessed in terms of non-speech hit rate (HR0) and speech hit rate (HR1).
4.2 Evaluation results
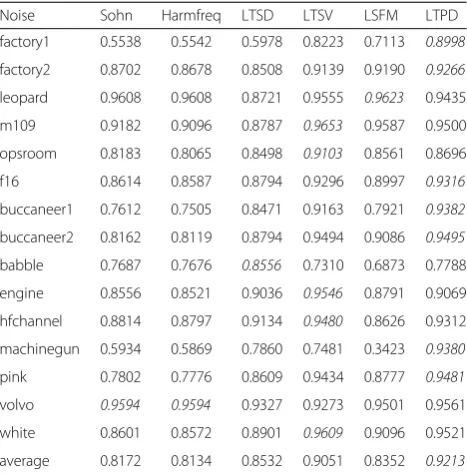
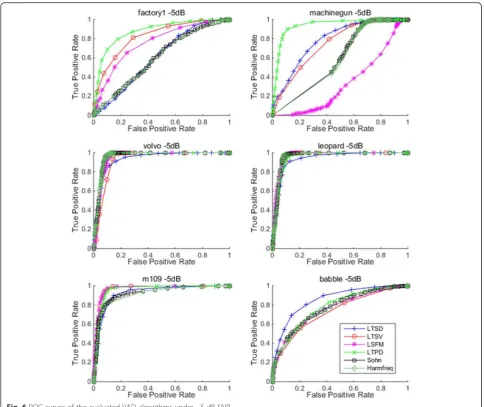
Table 1 shows the AUC values of six evaluated methods for all 15 types of noises under−5 dB SNR, and the best values among all methods in different noises are given with red bold. And Fig. 6 presents the ROC curves of the evaluated algorithms for the six typical types of noise
under −5 dB SNR. It can be seen that the LTPD-based
VAD algorithm outperforms all other VAD methods in seven noisy cases since these noisy cases are the most non-stationary among NOISEX-92 dataset according to the variability of short-time energy. The proposed method is very suitable for such cases while other methods deteriorate dramatically. Especially for factory1 and machinegun noises, the proposed method still ob-tains good results while some other VAD methods seem to exhibit worse performance nearly close to random guess. This is due to the fact that both machinegun and factory1 noises consist of mainly two different signals: gun firing and silence between firing for machinegun noise [2], and relatively stationary background noise of electric motor roaring as well as embedded irregular random bursts like metal banging or plate-cutting for factory1 noise, leading to misclassifications between noisy speech and noises because of the similar
non-stationary degrees. Moreover, comparing with the silence background in machinegun noise, the background noise of factory1 is more complex and challenging, resulting in higher misclassification errors.
For other noises such as m109, opsroom, engine, and hfchannel, the best performance is obtained by the LTSV-based VAD algorithm, which means the LTSV measure can effectively distinguish these noises from the corresponding noisy speech. Not only does LTSV method takes advantage of the long-term information but also benefits from the signal variability defined in LTSV. However, the LTPD-based VAD algorithm still outperforms other algorithms except LTSV.
For the vehicle interior noise like leopard and volvo, the characteristics of noisy speech do not change sig-nificantly compared to that of pure speech [2]
result-ing wonderful performances for all evaluated
methods. As an exceptional case, all methods do not perform very well under babble noise composed of voices from 100 people speaking. However, in this case, LTSD-based VAD algorithm is superior to other algorithms, which means that linear spectrum-based LTSD measure is successful in distinguishing such noise consisting of human voices from the corre-sponding noisy speech.
According to the average AUC value in measuring the comprehensive property of each VAD algorithm under different noisy environments, LPTD-based VAD algo-rithm is significantly superior to other algoalgo-rithms, even with a stronger robustness even at low SNR.
Table 1AUC values of the evaluated VAD algorithms under−5 dB SNR
Noise Sohn Harmfreq LTSD LTSV LSFM LTPD
factory1 0.5538 0.5542 0.5978 0.8223 0.7113 0.8998
factory2 0.8702 0.8678 0.8508 0.9139 0.9190 0.9266
leopard 0.9608 0.9608 0.8721 0.9555 0.9623 0.9435
m109 0.9182 0.9096 0.8787 0.9653 0.9587 0.9500
opsroom 0.8183 0.8065 0.8498 0.9103 0.8561 0.8696
f16 0.8614 0.8587 0.8794 0.9296 0.8997 0.9316
buccaneer1 0.7612 0.7505 0.8471 0.9163 0.7921 0.9382
buccaneer2 0.8162 0.8119 0.8794 0.9494 0.9086 0.9495
babble 0.7687 0.7676 0.8556 0.7310 0.6873 0.7788
engine 0.8556 0.8521 0.9036 0.9546 0.8791 0.9069
hfchannel 0.8814 0.8797 0.9134 0.9480 0.8626 0.9312
machinegun 0.5934 0.5869 0.7860 0.7481 0.3423 0.9380
pink 0.7802 0.7776 0.8609 0.9434 0.8777 0.9481
volvo 0.9594 0.9594 0.9327 0.9273 0.9501 0.9561
white 0.8601 0.8572 0.8901 0.9609 0.9096 0.9521
average 0.8172 0.8134 0.8532 0.9051 0.8352 0.9213
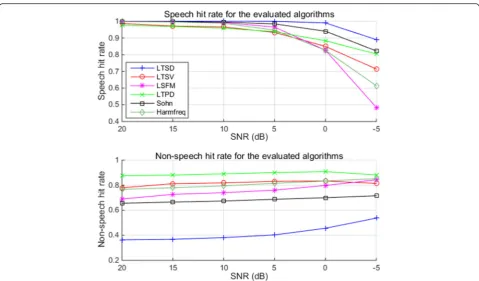
Figure 7 provides the comparisons of six evaluated VAD algorithms in terms of speech hit rate and non-speech hit rate for different SNR levels ranging from 20 to −5 dB. Note that the results show here are averaged values for the whole set of noises. It can be concluded that:
1) Sohn-VAD algorithm yields a moderate behavior with relatively high speech hit rate but slightly low non-speech hit rate.
2) Harmfreq-VAD, LTSV-VAD, and LSFM-VAD algo-rithms also obtain a moderate behavior with rela-tively high non-speech hit rate but slightly low speech hit rate.
3) The LTSD-VAD algorithm yields the best speech hit rate while non-speech hit rate is poor.
4) The LTPD-VAD achieves the best compromise among the four evaluated VADs. The speech hit rate
of LTPD-VAD is less than all the other methods in clean conditions (above 5 dB) but better than Harm-freq, LTSV, and LSFM in noisy conditions (−5 dB). Moreover, its non-speech hit rate is much better than all the other methods in all cases.
Table 2 compares the LTPD-VAD with the other VAD methods in terms of the average speech/non-speech hit rates. LTPD-VAD yields an 87.77 % HR0 average value which is 27.97, 13.07, and 48.85 % higher than that of Sohn, Harmfreq, and LTSD-VAD
methods, respectively. And LTPD-VAD attains a
94.23 % average speech hit rate while Sohn,
Harm-freq, and LTSD-VAD provide 96.25, 90.63, and
98.28 %, respectively. Thus, considering speech and non-speech hit rates together, LTPD-VAD is more su-perior to the other VAD algorithms.
5 Conclusions
In this paper, a new VAD algorithm is presented for improving the performance of speech detection ro-bustness in various noisy environments. The algo-rithm is based on the estimation of long-term pitch envelope and measure of long-term pitch divergence between speeches and noises. And an adapted LTPD decision threshold is also given using the measured signal-to-noise ratios. The experimental results show that the proposed method outperforms the other
up-to-date VAD algorithms under the most
non-stationary noisy environments and is more robust than other VAD algorithms even at low SNR due to the highest non-speech hit rate and a moderate speech hit rate.
However, from the experimental results, it can be ar-gued that LTSV-based VAD method is superior to LTPD-based algorithm in some noisy environments (m109, opsroom, engine, and hfchannel). This may
indicate that the long-term signal variability based on loga-rithmic spectrum decomposition, constructed by combin-ing pitch feature with LTSV feature, may be suitable for VAD tasks. Further, comparing with strict logarithmic scale, some critical-band-based scales is more conforming to human perception of speech signals. Hence, studies of com-bining these critical-band-based spectrum decomposition with long-term spectral divergence or long-term signal variability are worth further exploration.
6 Endnotes
1
http://dnt.kr.hsnr.de/aurora/download/fant.tar.gz 2
http://resources.mpi-inf.mpg.de/MIR/chromatoolbox/ 3
http://www.ee.ic.ac.uk/hp/staff/dmb/voicebox/ voicebox.html
Acknowledgements
This work was supported in part by the National Natural Science Foundation of China (No. 61175017, No. 61370034, and No. 61403224).
The pitch is different to that used in speech signal processing. Here, the pitches mean the spectral bands corresponding to the equal-tempered scale as used in Western music.
Competing interests
The authors declare that they have no competing interests.
Author details 1
Zhengzhou Information Science and Technology Institute, Zhengzhou, China.2The State Key Laboratory of Integrated Service Networks, Beijing, China.3Department of Electronic Engineering, Tsinghua University, Beijing, China.
Table 2Average speech and non-speech hit rates for SNR levels ranging from 20 to−5 dB
VAD Sohn Harmfreq LTSD LTSV LSFM LTPD
HR0 (%) 59.80 74.70 38.92 81.51 76.00 87.77
HR1 (%) 96.25 90.63 98.28 90.34 87.77 94.23
Note: The italicized numbers mean the highest average speech or non-speech hit rate among all evaluated algorithms
Received: 12 January 2016 Accepted: 23 June 2016
References
1. LR Rabiner, MR Sambur, An algorithm for determining the endpoints of isolated utterances. The Bell System Technical Journal54(2), 297–315 (1975) 2. PK Ghosh, A Tsiartas, S Narayanan, Robust voice activity detection using
long-term signal variability. IEEE Transactions on Audio, Speech and Language Processing19(3), 600–613 (2011)
3. Y Datao, H Jiqing, Z Guibin, Z Tieran,Sparse power spectrum based robust voice activity detector(IEEE International Conference on Acoustics, Speech and Signal Processing (ICASSP), Kyoto, 2012)
4. W Hongzhi, X Yuchao, L Meijing, Study on the MFCC similarity-based voice activity detection algorithm (International Conference on Artificial Intelligence, Management Science and Electronic Commerce (AIMSEC), 2011)
5. G Martin, A Abeer, E Dan et al.,All for one: feature combination for highly channel-degraded speech activity detection(INTERSPEECH, Lyon, 2013), pp. 709–713
6. T Kristjansson, S Deligne, P Olsen, Voicing features for robust speech detection (INTERSPEECH, 2005), pp. 369–372
7. S Ahmadi, AS Spanias, Cepstrum-based pitch detection using a new statistical V/UV classification algorithm. IEEE Transactions on Speech Audio Processing7, 333–338 (1999)
8. BF Wu, KC Wang, Robust endpoint detection algorithm based on the adaptive band partitioning spectral entropy in adverse environments. IEEE Transactions Speech Audio Processing13, 762–775 (2005)
9. Z Tuske, P Mihajlik, Z Tobler, T Fegyo, Robust voice activity detection based on the entropy of noise-suppressed spectrum (INTERSPEECH, 2005) 10. L. N. Tan, B. J. Borgstrom, and A. Alwan, Voice activity detection using
harmonic frequency components in likelihood ratio test (IEEE International Conference on Acoustics, Speech, and Signal Processing (ICASSP), 2010) 11. J Ramirez, JC Segura, C Benitez, A de la Torre, A Rubio, Efficient voice
activity detection algorithms using long-term speech information. Speech Communication42(3–4), 271–287 (2004)
12. K Manohar, P Rao, Speech enhancement in nonstationary noise environments using noise properties. Speech Communication48(1), 96–109 (2006) 13. M Muller, Information retrieval for music and motion (Springer Verlag, 2007) 14. M Meinard, E Sebastian, Chroma Toolbox: MATLAB implementations for
extracting variants of chroma-based audio features, in Proceedings of the 12th International Conference on Music Information Retrieval (ISMIR) (2011) 15. MA Bartsch, GH Wakefield, Audio thumbnailing of popularmusicusing
chroma-based representations. IEEE Transactions on Multimedia7(1), 96– 104 (2005)
16. EH Berger, LH Royster, DP Driscoll, JD Royster, M Layne, The Noise Manual, 5th edn. (American Industrial Hygiene Association, 2003)
17. J Rodman,“The effect of bandwidth on speech intelligibility”, White paper (POLYCOM Inc., USA, 2003)
18. T Gerkmann, RC Hendriks, Unbiased MMSE-based noise power estimation with low complexity and low tracking delay. IEEE Transactions on Audio, Speech and Language Processing20(4), 1383–1393 (2012)
19. JS Garofolo, LF Lamel, WM Fisher et al., DARPA TIMIT acoustic phonetic continuous speech corpus CDROM (NIST, 1993)
20. A Varga, HJM Steeneken, Assessment for automatic speechrecognition: Ii. NOISEX-92: a database and an experiment to study the effect of additive noise on speech recognition systems. Speech Communication12(3), 247– 251 (1993)
21. J Sohn, NS Kim, W Sung, A statistical model-based voice activity detection. IEEE Signal Processing Letter6(1), 1–3 (1999)
22. M Yanna, A Nishihara, Efficient voice activity detection algorithm using long-term spectral flatness measure. EURASIP Journal on Audio, Speech and Music Processing, 21 (2013)
Submit your manuscript to a
journal and benefi t from:
7Convenient online submission
7Rigorous peer review
7Immediate publication on acceptance
7Open access: articles freely available online
7High visibility within the fi eld
7Retaining the copyright to your article