www.adv-radio-sci.net/12/143/2014/ doi:10.5194/ars-12-143-2014
© Author(s) 2014. CC Attribution 3.0 License.
Common mode chokes and optimisation aspects
T. Kut1, A. Lücken2, S. Dickmann1, and D. Schulz2
1Institute of Fundamentals of Electrical Engineering, Helmut Schmidt University, Hamburg, Germany 2Institute of Electrical Power Systems, Helmut Schmidt University, Hamburg, Germany
Correspondence to: T. Kut ([email protected])
Received: 3 January 2014 – Accepted: 29 January 2014 – Published: 10 November 2014
Abstract. Due to the increasing electrification of modern air-craft, as a result of the More Electric Aircraft concept, new strategies and approaches are required to fulfil the strict EMC aircraft standards (DO-160/ED-14–Sec. 20). Common mode chokes are a key component of electromagnetic filters and often oversized because of the unknown impedance of the surrounding power electronic system. This oversizing results in an increase of weight and volume. It has to be avoided as far as possible for mobile applications. In this context, an ad-vanced method is presented to measure these impedances un-der operating conditions. Furthermore, the different parame-ters of the inductance design is explained and an optimisation for weight and volume is introduced.
1 Introduction
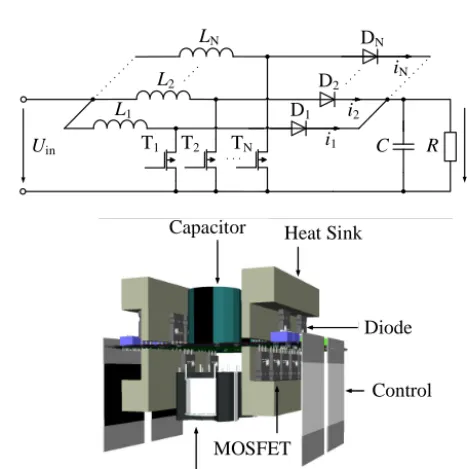
Power electronic converters, for example an interleaved boost converter as shown in Fig. 1, consist of switching devices, which are turned on or off, based on a modula-tion scheme to adjust the output voltage. The main draw-back is the generated level of electromagnetic interferences on power lines and other communication wires due to the non-ideal behaviour of the used semiconductors (Farhadi and Jalilian, 2006; Mainali and Oruganti, 2007). The spec-trum is usually spread from 10 kHz to 100 MHz. Filtering the transmission wires is a challenge, which often leads to re-designed filters, tested in a “trial and error" procedure and op-timised only rarely in terms of weight, size or costs (Mayer, 1998). These optimisations are required, especially for ap-plications in modern aircraft (Derouineua, 2009; Kut et al., 2013a; Chand et al., 2013). Therefore, an advanced method is presented to measure the impedances of the power con-verter to improve the performance of the filter (Tarateeraseth et al., 2011; See and Deng, 2004; Kut et al., 2013b).
Fur-Uin T1 TN Uout
L1
L2
LN
C
D1
D2
DN
R i1
T2
i2
iN
Capacitor
Diode
Control
Inductor MOSFET
Heat Sink
Figure 1. Schematic of a boost converter in interleaved structure
(above) with prototypical realization (3-D-model) as four-step in-terleaved converter (below) as an exemplary application for modern aircraft.
Saturation Flux Density in Tesla
0 1
Iron Powder
F e r r i t e s
Nanocrystalline
Fe Co
Amorphous Alloy
P
er
mea
bi
li
ty
102
103
104
105
106
0 0,2 0,4 0,6 0,8 1,0 1,2 1,4 1,6 1,8 2,0
Figure 2. Magnetic properties for ferrites, iron powder and metal
alloys: permeability vs. saturation flux density (Roc’h and Leferink, 2013).
2 Designable parameters and impedance modelling This section focuses on the designable parameters of a com-mon mode choke or a storage inductor such as core material, operating frequency, saturation and impedance behaviour. 2.1 Core material
The main purpose of common mode chokes is to transform the electromagnetic interferences to heat rather than for en-ergy storage as a storage inductor. The application of the core material is quite similar. The material can be used to increase the inductance, to absorb energy and to transform it to heat. The permeabilityµas the ratio of the magnetic flux density B toH is the most important magnetic material parameter. Typical requirements of an optimised choke are a high satu-ration level and a wide frequency range. Figure 2 shows the dependence of the permeability as a function of the saturation flux density and Fig. 3 of the frequency, respectively. Three basic materials, i.e. ferrites, iron powder and metal alloys (nanocrystalline and amorphous structure) are used in the de-sign of traditional common mode chokes. The highest perme-abilities are found in nanocrystalline materials. Amorphous alloys have somewhat smaller values whereas iron powder cores have relatively low permeabilities. Ferrite cores can be used over a wide frequency range but exhibit a significantly lower level of saturation. Higher flux densities can be found in nanocrystalline and amorphous materials as well as in iron powder cores but are limited in the used frequency range. Nanocrystalline materials are a good alternative to the tradi-tional chokes made of ferrite or iron powder. So, the main advantage is the high level of saturation and the resulting smaller size. The use of this material as a filter element or the use as a storage inductor due to the distributed air gap, in contrast to a conventional ferrite core is a step towards
vol-P
er
me
abil
it
y
Frequency in kHz
100 101 102 103 104 105 106
0 100
10
Nanocrystalline
Fe Co
Iron Powder
MnZn Ferrite Amorphous All.
MnZn Ferrites
NiZn & NiCuZn
101
102
103 104
105
106
Figure 3. Magnetic properties for ferrites, iron powder and metal
alloys: permeability vs. frequency (Roc’h and Leferink, 2013).
ume reduction. Reaching 50–80 % lower compared to a fer-rite volume and more than 80 % lower compared to an iron core. The resulting weight reduction is an important property in aircraft applications or any other areas where weight is a design constraint (Wen, 2011).
2.2 Impedance modelling
A main objective of a common mode choke is to block the electromagnetic interferences. The study of the behaviour in-volves five types of impedances. Figure 4 presents the gen-eral equivalent circuit with the coupling factorK:
– the common mode (Lcm)
– the differential mode (Ldm)
– the inter-winding (Cp)
– the intra-winding (Cw)
– the line impedance (Rwire)
Equation (1), the value of the common mode impedance is the most important value and is strongly related to the per-meability (assuming linearity) of the core. In addition to the operating current, the inductance and the capacitance – the designable parameters in these context are the core material
µ=µ0
µ0RL−jµ00RR, the dimension and configuration (Amat), the wire material (frequency, diameter, isolation), the
number of turns (N) and the effective length (lmat). This can
Ldm Rwire Cp
Ldm Rwire
Cp
Cw Lcm
Lcm K
Figure 4. Equivalent circuit of the common mode choke.
Zcm=jωLcm=
=jωµ0·µ
0
RL·Amat·N2
lmat
| {z }
Lser
+ωµ0·µ
00
RR·Amat·N2
lmat
| {z }
Rser
Lcm=µ0
µ0RL−jµ00RR·Amat·N2
lmat
(1)
2.3 Measurements
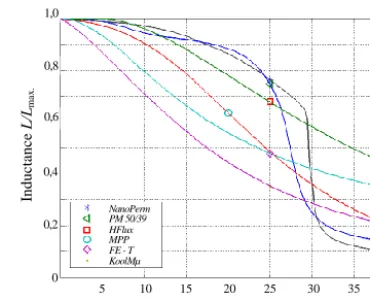
In order to evaluate the influence of each parameter, mea-surements with a precision LCR meter with dc bias unit are performed for various core materials, which can be assigned to the respective classes of materials. The influence of the frequency (Fig. 5 forf =100 kHz, Fig. 6 forf =300 kHz) and the flux density is presented. Only the suitable materi-als have been measured for the higher frequency in Fig. 6. The maximum saturation flux densityBmaxranges from 0.5 T
(PM 50/39) to 2 T (HFlux) and can be described by Eq. (2) with the maximum operating current Iˆmax, the minimum
Aminand effective cross-sectional areaAefffor ferrite cores
and with the material-dependent inductance factor AL for
toroidal cores. Bmax=
N· ˆImax
lmat
µ0·µmat+
lair
µ0
· Aeff
Amin
| {z }
Ferrites
=N· ˆImax·AL
Amat
| {z }
Toroid
(2)
As already mentioned, the common mode chokes, induc-tors or storage inducinduc-tors constitute a high influence in power electronic systems. The design of these elements has been a challenging task with the increasing complexity of the power electronic. In order to optimize this in the context of weight savings, the area product method is used. This is defined as the product of the core area Acore and the window area
Awindowfor a core – according to Eq. (3). The various
param-eters involved in the design are divided into three categories: design requirements, material and manufacturing constraints. Here, the valueAPmincan be determined and should be
min-imised from the output power P and operating frequency
800
5 10 15 20 25 30 35 0
400 250
50 150
Current in A
250
0 1500,2 0,4 0,6 0,8 1,0
Induc
ta
nc
e
L
/Lm
a
x
.
NanoPerm PM 50/39 HFlux MPP FE - T KoolMµ
Figure 5. Core materials atf=100 kHz.
800
5 10 15 20 25 30 35 0
400 250
50 150
Current in A
250
150 0,4 0,8 1,0
Induc
ta
nc
e
L
/Lm
a
x
.
FE - T KoolMµ
0,6
MPP HFlux
Figure 6. Core materials atf=300 kHz.
f as design requirements, the maximum flux density Bmax
and maximum current densityJmax as material constraints
and the window utilisation factorC as manufacturing con-straint. The area product method is a very useful expression involving mechanical and electrical parameters. The increase of the operating frequency and the material-dependent satu-ration flux density contribute to the weight saving effect.
APmin=Acore·Awindow=
2·P C·Bmax·f·Jmax
800
104
105
106
107
108 0
400 250
50 150
Frequency in Hz
250
100 15010 1 103 104
Imp
eda
nc
e i
n
AmoFlux HFlux PM 50/39 KoolMµ VitroVac NanoPerm
102
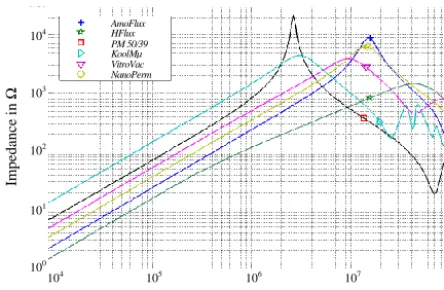
Figure 7. Measured common mode impedance for various cores.
32 mm
32
mm
58 mm
50
mm
245 g
40 g
Figure 8. Overview about the core materials.
indicated in Fig. 8. In summary, it can be noted that weight can be saved by the choice of newer materials for common mode chokes as well as for storage inductors. A further ad-vantage is that they have a higher saturation flux density and can also be used for a much higher frequency range.
3 System impedance measurement
An accurate measurement method to extract the common and differential mode impedance of a power electronic sys-tem under operating conditions is presented in this section. For this purpose a pre-measurement calibration process and the extraction of common and differential mode is described to systematically design an electromagnetic filter with mini-mum effort. The system impedance is very important for fil-ter design because only with this information it can be best adapted to the system, without oversizing the filter. In con-trast to other systems due to converter topology, component parasitics, printed circuit board layout etc. the impedance is not 50and must be taken into account. For example, the differential mode is influenced by the reverse recovery effect of the diode or the equivalent series resistance and induc-tance of a capacitor. As for the common mode, the deciding components are parasitic effects between the semiconductor, heat-sink, chassis and printed circuit board. To illustrate, why the system impedances are important parameters for filter de-sign, the simple schematic as shown in Fig. 9 is analysed by Eq. (4), which represents the transfer function of the entire system. The parameters axy are the elements of a cascaded
filter structure. This clearly illustrates that for optimum EMI filter design, the impedances of source and load should be
EMI Filter
Iin Iout
Uin Zin Uout Zout
Source Load
Figure 9. Consideration of the system impedances in filter design.
taken into account in power electronic applications. A de-tailed description is given by (Kut et al., 2013b).
Uout
Uin
= 1
a11+Za12out +a21·Zin+a22·ZZoutin
(4)
Therefore, a two-probe measurement procedure for common and differential mode impedances is advantageous for power electronic systems. It was originally developed for built-in power line electromagnetic filters as small-signal behaviour (Tarateeraseth et al., 2011). It has been extended as follows:
– Measurements under operating conditions in each oper-ating point of the power electronic system
– Independent of each used measurement tool (calibrated out of cables, current probes etc.)
– Minimal frequency range from 9 kHz to 30 MHz – Separation between common and differential mode – Operating parameters of several hundred volts and
sev-eral tens of amperes
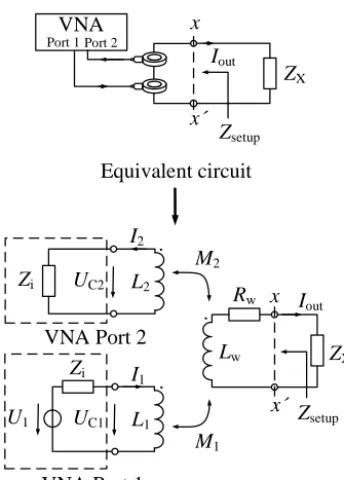
The basic concept of the method to measure the unknown impedanceZXis shown in Fig. 10 (above). It consists of an
injection probe, a detection current probe, a vector network analyser (VNA) and the unknown impedance. Port 1 gener-ates a signal into closed-loop through the injection probe and the resulting current is measured at port 2. Figure 10 (be-low) shows the complete equivalent circuit of the measure-ment setup with port 1 as sourceU1as well as the internal
resistanceZi, the source voltageUC1as well as the resulting
voltageUC2, the primaryL1/L2and the mutual inductances
M1/M2, the formed wiring elementsLwandRw. These
vari-ables are summarised in addition toZsetup(Kut et al., 2013b).
By solving the Eq. (5) as equation of the system as indicated in Fig. 10 (below), the unknown impedanceZX can be
ex-pressed by Eq. (6), whereF is a frequency-independent fac-tor (ZT is the ratio ofUC2 andIout). The ratio of the
two-probe voltages is given by Eq. (7).
U1
0
−ZX·Iout
=
=
Zi+jωL1 0 −jωM1
0 Zi+jωL2 j ωM2
−jωM1 j ωM2 Rw+jωLw
·
I1
I2
Iout
ZX
Lw
Iout
Rw
Zsetup
U1
Zi I1
VNA Port 1
Zi
I2
VNA Port 2
M1
M2
L1
L2
x
x´
Zsetup
ZX
VNA
Iout
Equivalent circuit
x
x´
Port 1Port 2
UC1
UC2
Figure 10. Basic concept and equivalent circuit of the measurement
setup.
ZX=F·
U
C1
UC2
−Zsetup ; F =
M1·ZT
L1
(6)
UC1
UC2
=S11+1
S21
(7) The coefficientF and the setup impedanceZsetupcan be
ob-tained by two additional measurements: First, by replacing the unknown impedanceZXin Fig. 10 with a known
preci-sion resistorR. The resistor should be chosen in the middle range of the unknown impedance to be measured. The next measurement should be done without the resistorR. There-fore, R can be short-circuited in Fig. 10. With these addi-tional measurements and Eqs. (5) and (6), F and the setup impedanceZsetupcan be obtained by solving this system of
equations. All parameters, which are influenced by the mea-surement setup are determined and can be eliminated for the determination ofZX. The measurement setup to extract the
“unknown” common mode impedance is shown in Fig. 11. In order to avoid any unwanted electromagnetic interferences from the source supplying the power electronic, these con-nections are terminated by line impedance stabilisation net-works (LISN). Basically, the setup and the connecting wires should correspond to those of the calibration measurements. It is the same procedure with the electronic load to be sup-plied in Fig. 11. To measure the differential mode impedance one of the two wires must be rotated by 180◦and routed back through the two current probes. Figure 12 shows exemplary the magnitude of the extracted common mode impedance. The intermediate steps for determining theZsetupand
differ-ential mode impedance are omitted for clarity, at this point.
VNA LISN
LISN
Power Converter
LISN
LISN
Rvar
Uin
Figure 11. Setup for common mode impedance measurement.
M
agnit
ude
in
800
Frequency in kHz
10 100 1.000 10.000 100.000 0
400 4000
0 2000
ZDCDC,CM n = 10 n = 20
Figure 12. Measured common mode impedance with interpolated
values of polynomialn=10 andn=20.
It can also be seen in Fig. 12 that for calculation of the fil-ter elements, the measured curve is represented by a poly-nomial function, in order to use them in Eq. (4). In sum-mary, with accurate measurements of common and differen-tial mode impedances over the frequency range of interest, an appropriate filter can be chosen or can be designed with op-timal component values and is no longer overdimensioned.
4 Conclusions
The EMC requirements increased as a result of the required DC/DC converters due to the installation of electric system components instead of heavy mechanical, pneumatic and hydraulic systems in modern aircraft. In order that these filters do not take up a large part of the overall system weight, they must be optimally adjusted to the converter system. Two aspects should be considered: on the one hand there are weight savings possible by the optimised selection of the inductor material. For this purpose, the dependencies with respect to frequency and saturation flux density for various modern materials have been identified and the potential savings were clearly pointed out. In addition, an accurate measurement method to extract common mode and differential mode impedance of power electronic converters under operation conditions was presented. With these mea-surements and with the knowledge of the correct material an appropriate EMI filter can be chosen or can be designed with optimal component values and is no longer overdimensioned.
Edited by: F. Sabath
References
Chand, B., Kut, T., and Dickmann, S.: Optimal design of active EMC filters, Adv. Radio Sci., 11, 243–249, doi:10.5194/ars-11-243-2013, 2013.
Derouineua, J.-L.: Power Optimized More Electrical Aircraft, in: Proceedings of the European Conference towards eEnvironment, 293–295, Prag, 2009.
Farhadi, A. and Jalilian, A.: Modeling and Simulation of Electro-magnetic Conducted Emission Due to Power Electronics Con-verters, in: Power Electronics, Drives and Energy Systems, In-ternational Conference on, 1–6, New Delhi, 2006.
Kut, T., Chand, B., Lücken, A., Dickmann, S., and Schulz, D.: EMC studies on systems with hybrid filter circuits for modern aircraft applications, Adv. Radio Sci., 11, 237–242, doi:10.5194/ars-11-237-2013, 2013a.
Kut, T., Lücken, A., Dickmann, S., and Schulz, D.: Design von Gleich- und Gegentaktfiltern unter Berücksichtigung der Ein- und Ausgangsimpedanzen für Gleichspannungswandler im HVDC-Netz, in: 62. Deutscher Luft- und Raumfahrtkongress, urn:nbn:de:101:1-2013112910658, Stuttgart, September, 2013b. Magnetics: A Critical Comparison of Ferrites with other Magnetic
Materials, in: Technical Information, 2010.
Mainali, K. and Oruganti, R.: Simple Analytical Models to Pre-dict Conducted EMI Noise in a Power Electronic Converter, in: Industrial Electronics Society, 33rd Annual Conference of the IEEE, 1930–1936, Taipei, 2007.
Mayer, F.: Electrical Power and Signal Distribution in Modern Air-crafts, combines Weight Advantages and EMC Compatibility, in: Electromagnetic Compatibility, IEEE International Symposium on, 1, 281–283, Denver, 1998.
Roc’h, A. and Leferink, F. B. J.: Analysis of Common Mode Induc-tors and Optimization Aspects, in: Power Electronics and Power Systems, Electromagnetic Interference Issues, Bentham Science Publishers, Australien, 3–37, ISBN 978-1-60805-240-0, 2012. See, K. Y. and Deng, J.: Measurement of Noise Source Impedance
of SMPS Using a Two Probes Approach, in: Power Electronics, IEEE Transactions on, 19, 862–868, Mai, 2004.
Tarateeraseth, V., See, K. Y., Wang, L. B., and Canavero, F. G.: Sys-tematic Power Line EMI Filter Design for SMPS, in: EMC Eu-rope, 586–591, York, September, 2011.
Vacuumschmelze GmbH & Co. KG: Nanocrystalline Material in Common-Mode Chokes, in: Technical Information, 2013. Wen, B.: Weight Estimation of Electronic Power Conversion