RESEARCH ARTICLE
Transcriptomic analysis of a moderately
growing subisolate
Botryococcus braunii
779 (
Chlorophyta
) in response to nitrogen
deprivation
Lei Fang
1,6†, Deying Sun
2,7†, Zhenyu Xu
1, Jing He
3, Shuyuan Qi
1, Xin Chen
4, Wee Chew
5and Jianhua Liu
1,3*Abstract
Background: The colonial microalga Botryococcus braunii has been brought to people’s attention for its conspicuous
ability to accumulate a variety of lipids including hydrocarbons. B. braunii strains are classified into 3 races based on
the types of hydrocarbons. A and B races are known to accumulate high level of lipids. However, their extreme slow growth rate has impeded its application for renewable biofuel production.
Results: In this study, we report the transcriptomic response of a moderately growing subisolate from the culture of Botryococcus sp. CCALA-779 upon nitrogen deprivation (ND). We show that the subisolate has an average growth
rate of 0.52 g l−1 day−1 under photoautotrophic growth conditions and lipid content is enhanced to 75 % of CDW
upon ND. Both rDNA sequence and hydrocarbon composition analyses indicate that the subisolate belongs to A
race B. braunii. Hence, it is designated as B. braunii 779. We show that B. braunii 779 transcriptome shares homology
to majority of the A race but not B race B. braunii ESTs, suggesting that transcriptomes of A race differ from that of
B race. We found that many homologous ESTs between A races 779 and Bot-88 are unknown sequences, implying that A race contains many unknown genes. Pathway-based transcriptomic analysis indicates that energy metabo-lisms are among the top expressed functions in log-phase cells, indicating that the slow growth rate is a result that energy flow is directed to lipid biosynthesis but not population growth. Upon ND, reconfiguration of metabolisms for
reducing power is apparent, suggesting that B. braunii 779 is rapidly adapting under ND condition by transcriptomic
reprogramming.
Conclusions: Taken together, our result shows that the subisolate B. braunii 779, similar to the Gottingen strain, is
useful for biofuel production. Difference between transcriptomes of A and B races implies that different races of B.
braunii strains belong to different sub-species. Furthermore, there are many novel genes that are unique to A race, suggesting that sequences of many enzymes involved in hydrocarbon biosynthesis are not currently known. We
propose that B. braunii transcriptomes provide a rich source for discovery of novel genes involved in hydrocarbon
biosynthesis.
Keywords: Botryococcus braunii, Green microalgae, Hydrocarbon, Transcriptome, Response to nitrogen deprivation
© 2015 Fang et al. This article is distributed under the terms of the Creative Commons Attribution 4.0 International License (http://creativecommons.org/licenses/by/4.0/), which permits unrestricted use, distribution, and reproduction in any medium, provided you give appropriate credit to the original author(s) and the source, provide a link to the Creative Commons license, and indicate if changes were made. The Creative Commons Public Domain Dedication waiver (http://creativecommons.org/ publicdomain/zero/1.0/) applies to the data made available in this article, unless otherwise stated.
Open Access
*Correspondence: [email protected]
†Lei Fang and Deying Sun contributed equally to this work
3 Ocean Research Centre of Zhoushan, Zhejiang University, 10 Tiyu Road,
Room 502, Zhoushan 316021, Zhejiang, China
Background
Microalgae have been getting renewed interests for its
CO2 mitigation and lipid production. Photosynthetic
microalgae, like green plants, utilize photon energy to
convert CO2 (in presence of water) into sugar and
oxy-gen. Lipid yield from oleaginous algae is believed to be at least an order of magnitude higher than that of many energy plants [1, 2], besides that cultivation of microalgae can avoid competing arable lands and irrigation water for crops [3, 4]. Many oleaginous microalgae accumulate triacylglycerols (or TAG) that need to be transesterified with methanol to methyl esters of fatty acids and glycerol, for example, before being refined to biodiesel [5]. On the
other hand, oleaginous green colonial microalga
Botryo-coccusbraunii has been brought to people’s attention for its conspicuous ability to accumulate a variety of lipids including hydrocarbons that are found in petroleum deposits and can be refined directly without the need of esterification because they are not fatty acids [4, 6].
However, B. braunii has suffered from an extreme slow
growth (i.e., population doubling time is approximately 5–7 days) that has hampered from its application for bio-fuel production [6]. The slow growth has also prevented it from genetic studies. Hence, many researches have focused on the analysis of hydrocarbon compositions and the discovery of DNA sequences encoding enzymes involved in biosynthesis of hydrocarbons [7–12]. Depending on the types of hydrocarbons accumulated in
cells and cell wall matrix, B. braunii is classified into three
principal races, A, B, and L. A race produces very long chain fatty acid (or VLCFA)-derived
odd-carbon-num-bered n-alkadiene and alkatriene, B race produces mainly
botryococcenes (or triterpenoids), and L race produces lycopadiene (or tetraterpenoid) [13–16]. Several genes encoding enzymes such as triterpene methyltransferases TMTs [8], 1-deoxy-D-xylulose 5-phosphate synthase DXS [10], squalene synthase-like SSL botryococcenes
synthase [9, 17], Botryococcus squalene synthase BSS
[18], and squalene epoxidases SQE [11] have been cloned and their enzymatic activities have been tested.
Genomic sequences of a number of photosynthetic microalgae have been completed (http://genome.jgi-psf. org). These comprehensively annotated genomes have provided rich sources for annotation of novel genomes and transcriptomes. Using the comprehensively anno-tated genomes, de novo transcriptome analysis without reference genomic sequences has permitted the discov-ery of genes and reconstitution of metabolic pathways in some non-model microalgae [19–22]. De novo
tran-scriptomic analyses in B. braunii have extended our
knowledge on potential enzymes involved in biosynthesis
of hydrocarbons in B. braunii [21, 23–25]. For example,
19 out of 55 sequences encoding enzymes potentially involved in biosynthesis of VLCFA have been
discov-ered in A race B. braunii Bot-88 [24] and 100 curated and
machine-assembled sequences potentially involved in biosynthesis of botryococcenes and squalene have been
revealed in B race B. braunii Showa [21]. However, it is
unclear why not all the enzymes that are involved in bio-synthesis of VLCFA are found in the transcriptomes of A
race B. braunii.
ND is one of the most widely used methods for enhancement of storage lipids in a number of
TAG-con-taining green microalgae [2, 5, 22]. In A race B. braunii,
nitrogen limitation enhances accumulation of oleic acid [26], but not hydrocarbons [27]. Global transcriptional profiling of microalgal cells in response to ND using next-generation sequencing (or NGS) technologies allows identification of gene regulatory networks involved in adaptation and survival [22, 28, 29].
In this study, we report (1) the characterization of a
moderately growing subisolate derived from the
Bot-ryococcus sp. CCALA779 culture, (2) biochemical analysis of the lipids and hydrocarbons accumulated in the subisolate, and (3) transcriptomic profiling of the subisolate in response to ND. We show that the
subiso-late can reach a maximal growth rate of 1.23 g l−1 d−1
and an average growth rate of 0.52 g l−1 d−1 in 2× BB
medium [30] under photoautotrophic growth condi-tions. Lipid contents are enhanced by nitrogen depriva-tion (ND). The 18S rRNA sequence-based phylogenetic analysis places the subisolate to the group of A race. Consistent with this, GC–MS analysis of hydrocarbon composition in the subisolate reveals the presence of heptacosdiene and heptacostriene. Four giga-nucleo-tide short-read sequences of RNA (or cDNA) generated using Illumina sequencing platform were assembled by Trinity software. Approximately 20 % (i.e., 12,292) of the non-redundant transcriptome was found to have best-hit in the 6 algal genomes that are comprehensively annotated (http://genome.jgi-psf.org). Comparison to
other previously reported transcriptomes of other B.
braunii strains implies that the similarity between tran-scriptomes of A and B races is very low (i.e., at a level of 15 %). On the other hand, majority of the homolo-gous ESTs between A races are unknown sequences. Taken together, our results indicate that the
moder-ately growing subisolate belong to the A race B. braunii.
Transcriptomes between A and B races B. braunii
dif-fer dramatically, suggesting that A and B races belong to different sub-species. Additionally, many ESTs in A race transcriptomes are unknown sequences, pro-viding a useful resource for discovery of novel genes.
well-characterized strains such as Gottingen strain [27], attractive for biofuel production.
Results
Accumulation of lipid and hydrocarbon in a moderate growing Botryococcus subisolate is enhanced by ND
A moderately growing subisolate from a culture of
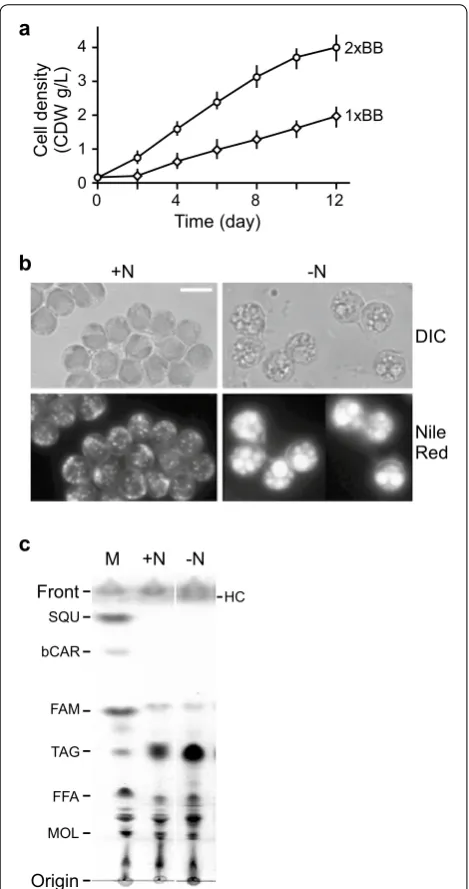
Bot-ryococcus sp. CCALA 779 on solid BB medium was obtained. Photoautotrophic growth rate of the subisolate in liquid BB medium was examined under the condition
of 250 μmol photon m−2 s−1. The growth curve indicated
that this subisolate exhibited a maximum growth rate of
0.61 g l−1 d−1 (i.e., gram of cell dry weight or CDW per
liter per day) and a maximum cell density of 1.98 g l−1 in
terms of CDW per liter (Fig. 1a; Table 1). When using 2×
BB medium (i.e., to double the nutrient concentration of the BB medium), we found that both the growth rate
and cell maximum density were doubled to 1.23 g l−1 d−1
and 4 g l−1, respectively. Subsequently, we examined the
content of lipid and hydrocarbon in log-phase cells (e.g.,
at the density of ~1.61 g/L in 1× BB medium) that were
extracted by methanol/chloroform solution (i.e., the ratio was 2:1 by volume) and hexane, respectively, using gravimetric methodologies (see “Methods”). Our results indicated that the total lipid and hydrocarbon contents in log-phase cells were approximately 0.58 g/L (or 36 % of CDW) and 0.31 g/L (or 19 % of CDW), respectively (Table 2).
To investigate whether ND treatment would enhance the lipid and/or hydrocarbon content, the log-phase cells were subjected to ND by replacing BB-N medium (or nitrogen-less BB medium) without altering the cell density. Three days after ND, cell density was slightly increased by 4 % of CDW (i.e., from 1.61 to 1.68 g/L). Nile red is a fluorescent hydrophobic probe that is commonly used for detection of cellular neutral lipid and hydrocar-bon deposits [31]. Fluorescence microscopic analysis of Nile red-stained subisolate cells showed that many tiny lipid deposits were visible in cells prior to ND, which were likely composed of triacylglycerols or hydrocarbons
or both (Fig. 1b). On the other hand, these tiny deposits
were aggregated to form much large lipid droplets upon ND. This result suggests that contents of lipids (i.e., tria-cylglycerols or hydrocarbons or both) are enhanced by ND in this subisolate.
Botryococcus cells tended to form bundles, which made it unsuitable for FACS analysis to determine lipid con-tents in individual cells. Hence, we applied gravimetric method to estimate total lipid and hydrocarbon con-tents in cells prior to and after ND (see “Methods”). To this end, total lipid (i.e., extracted by methanol/chloro-form) and hydrocarbon (i.e., extracted by hexane) con-tents were found to increase by 2.2-fold and 2.8-fold,
+N -N
DIC
Nile Red
SQU
bCAR
FAM
TAG
FFA
MOL
HC M +N -N
Origin Front
0 4 8 12
0 1 2 3 4
Cell
densit
y
(CDW
g/L)
Time (day)
1xBB 2xBB
a
b
c
Fig. 1 Characterization of the moderately growing subisolate from
a Botryococcus CCALA 779 culture. a Growth curve of the subisolate.
X- and Y-axis indicate time in days and cell dry weight in gram per liter. Nutrient strength of 1× BB and 2× BB indicates medium with standard nutrient concentration and twofold of standard concentra-tion. b Fluorescence microscopic analysis of Nile red-stained cells of subisolate. Cells prior to and after ND are indicated by +N and −N, respectively. Cell images are captured under the setting of differential interference contrast (DIC) and fluorescence (Nile red). A scale bar
of 20 μm is shown. c Analysis of total lipids extracted by methanol/ chloroform solution (i.e., 2:1 by volume). Equal amount of total lipid extract from cells prior to (+N) and after (−N) ND is loaded onto a TLC plate and developed with hexane/diethyl ether/acetic acid solu-tion (i.e., 35:15:0.1 by volume). Origin and front of TLC are indicated. Marker (M) of standard chemicals includes squalene (SQU), beta-carotene (bCAR), FAME C14-C22 (FAM), tri-oleic acid glyceride (TAG),
respectively (see Table 2). This result indicated that the lipid and hydrocarbon contents in the subisolate were highly enhanced upon ND.
The methanol/chloroform extract or total lipid was subsequently subjected to thin-layer chromatographic analysis. Our results indicated that levels of triacylglyc-eride (TAG), diacylglyctriacylglyc-eride (DAG), free fatty acid (FFA), but not monoacylglyceride (MAG) were increased in the subisolate upon ND (Fig. 1c). These results indicated that
the moderately growing subisolate’s neutral lipid accu-mulation was enhanced by ND.
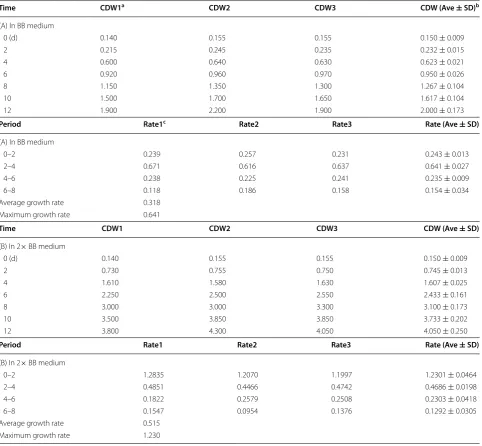
The subisolate belongs to the group of race A B. braunii To investigate the phylogenic placement of this subi-solate, we performed the 18S rDNA sequences-based phylogenetic analysis. For this reason, the 18S rDNA sequences were amplified using PCR with sequence-spe-cific primers [32] (see “Methods”). Our result indicated Table 1 Growth curves of the Botryococcus sp. subisolate
a CDW stands for cell try weight, repeat number is indicated.
b Ave and SD stand for average and standard deviation based on 3 repeats.
c Growth rate in an 2 days-period of 0–2 days, 2–4 days, 4–6 days, and 6–8 days was calculated using the formula √2CDW
t2/CDWt1−1.
Time CDW1a CDW2 CDW3 CDW (Ave ± SD)b
(A) In BB medium
0 (d) 0.140 0.155 0.155 0.150 ± 0.009
2 0.215 0.245 0.235 0.232 ± 0.015
4 0.600 0.640 0.630 0.623 ± 0.021
6 0.920 0.960 0.970 0.950 ± 0.026
8 1.150 1.350 1.300 1.267 ± 0.104
10 1.500 1.700 1.650 1.617 ± 0.104
12 1.900 2.200 1.900 2.000 ± 0.173
Period Rate1c Rate2 Rate3 Rate (Ave ± SD)
(A) In BB medium
0–2 0.239 0.257 0.231 0.243 ± 0.013
2–4 0.671 0.616 0.637 0.641 ± 0.027
4–6 0.238 0.225 0.241 0.235 ± 0.009
6–8 0.118 0.186 0.158 0.154 ± 0.034
Average growth rate 0.318
Maximum growth rate 0.641
Time CDW1 CDW2 CDW3 CDW (Ave ± SD)
(B) In 2× BB medium
0 (d) 0.140 0.155 0.155 0.150 ± 0.009
2 0.730 0.755 0.750 0.745 ± 0.013
4 1.610 1.580 1.630 1.607 ± 0.025
6 2.250 2.500 2.550 2.433 ± 0.161
8 3.000 3.000 3.300 3.100 ± 0.173
10 3.500 3.850 3.850 3.733 ± 0.202
12 3.800 4.300 4.050 4.050 ± 0.250
Period Rate1 Rate2 Rate3 Rate (Ave ± SD)
(B) In 2× BB medium
0–2 1.2835 1.2070 1.1997 1.2301 ± 0.0464
2–4 0.4851 0.4466 0.4742 0.4686 ± 0.0198
4–6 0.1822 0.2579 0.2508 0.2303 ± 0.0418
6–8 0.1547 0.0954 0.1376 0.1292 ± 0.0305
Average growth rate 0.515
that the subisolate was mostly related to the group of A
race B. braunii spp. (Fig. 2a). It is known that A race B.
braunii accumulates mainly the n-alkadiene and
alka-triene [13], unlike B and L races of B. braunii that
accu-mulate largely botryococcenes (or triterpenoids) and lycopadiene (or tetraterpenoids), respectively [14, 15].
To investigate whether the subisolate contained
n-alkadiene and triene, the hexane extract was
sub-jected to GC–MS analysis. To this end, heptacosdiene
(C27H52) and heptacostriene (C27H50) were found to be
the predominant composition in the hydrocarbon extract
(Fig. 2b, c), supporting the 18S rDNA sequence-based
phylogenetic analysis. Hence, we designated this
subiso-late as A race B. braunii 779. We found that the contents
of total hydrocarbons (see Table 2), possibly including
heptacosdiene and heptacostriene were increased upon
ND in B. braunii 779.
The de novo‑assembled transcriptome of B. braunii 779 appears to mostly resemble that of Coccomyxa subellipsoidea
To investigate the transcriptomic change upon ND, we
first wanted to assemble the B. braunii 779
transcrip-tome. For this reason, B. braunii 779 log-phase growing
cells prior to and 3 days after ND were collected for total RNA extraction (see “Methods”). The resulting total RNA samples were individually subjected to sequencing analy-sis using the Illumina HiSEQ 2000 platform (BGI). Over 27 million good reads with 90 nt in length were obtained from each sample. All 55 million reads were pooled for de novo assembly of transcriptome using Trinity software [33] (see “Methods”).
We obtained 61,220 non-redundant ESTs based on the cutoff of identity <90 % (i.e., based on CD-Hit analysis), EST length >300 bps, and read count per EST >40. Anno-tation of the non-redundant ESTs was performed based on the best-hit proteins/genes generated by sequence homology comparison using the Basic Local Alignment
Search Tool BLASTX suite (http://blast.ncbi.nlm.nih. gov) against the “best” proteins/genes in the compre-hensively annotated genomes of 5 green microalgae Coccomyxa subellipsoidea [34], Chlorella variabilis [35], Chlamydomonas reinhardtii [36], Micromonas pusilla
[37], and Ostreococcus lucimarinus [38] and a brown alga
Thalassiosira pseudonana [39] with a cutoff expectation
value of 1E−07 (see “Methods”). To this end, a total of
12,292 (20.1 %) of the non-redundant ESTs in B. braunii
779 were shown to have best-hits (i.e., e value <1.0E−07)
(for a complete list of annotated ESTs, see Additional
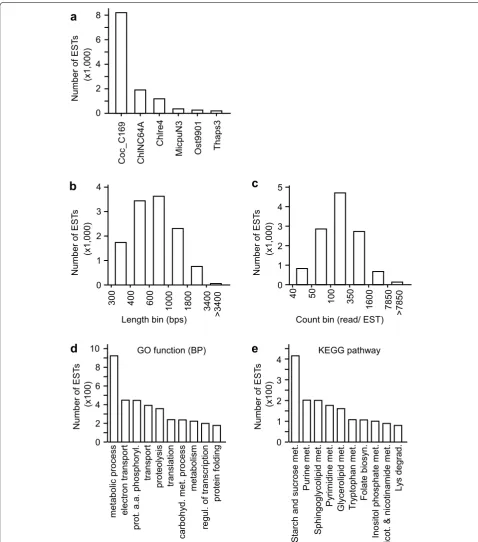
file 1: Table S1). We found that majority (~70 %) of the
best-hits in B. braunii 779 were derived from C.
subel-lipsoidea, suggesting that the transcriptome of B.
brau-nii 779 is most closely related to that of C. subellipsoidea
(Fig. 3a). This observation was supported by the result of the 18S rDNA sequence-based phylogenetic analysis (see Fig. 2a).
The 12,292 annotated ESTs in the transcriptome of B.
braunii 779 were subjected to functional analysis in this study. The length of these ESTs was ranged from 301 bps to 8,268 bps with the median length of 663 bps (Fig. 3b). The read count per EST was ranged from 42 to 182,192 with the median of 174. Of the 12,292 ESTs, 8,888 were found to be associated with at least one gene-ontology (GO) function. A total of 539 GO functions in Biologi-cal Process, 171 functions in Cellular Component, and 1,549 functions in Molecular Function associated to the B. braunii 779 transcriptome (for a complete list of EST-associated GO functions, see Additional file 2: Table S2). Ten GO biological processes associated with the most
number of ESTs are listed in Fig. 3d (for top 10 CC and
MF, see Additional file 3: Figure S1).
Subsequently we found that 3,386 out of the 12,292 ESTs were associated with at least one KEGG ortholog. The metabolic pathways associated with the most
num-ber of ESTs are shown in Fig. 3e (for a complete list of
EST-associated pathways, see Additional file 4: Table S3). Table 2 Lipid and hydrocarbon contents are enhanced upon nitrogen deprivation in a subisolate of Botryococcus sp.
a CDW for cell dry weight.
N‑replete Individual measurements Average % CDWa
CDW (g/L) 1.61 1.58 1.63 1.61 ± 0.03
TL (g/L) 0.59 0.6 0.56 0.58 ± 0.02 36.0
HC (g/L) 0.30 0.36 0.28 0.31 ± 0.04 18.3
N‑depleted Individual measurements Average % CDW
CDW (g/L) 1.67 1.67 1.70 1.68 ± 0.02
TL (g/L) 1.25 1.29 1.23 1.25 ± 0.03 74.4
Richness of the GO and KO (KEGG ortholog) annotation of the transcriptome allowed performing pathway-based transcriptional analysis (see “Methods”).
Majority of the ESTs in the previously reported A race, but not B race transcriptome of B. braunii are found in the transcriptome of B. braunii 779
To compare the similarity of the B. braunii 779
transcrip-tome with the previously reported transcriptranscrip-tomes of A
race B. braunii Bot-88 and B race B. braunii Showas,
Bot-70, and Bot-22, we first processed the datasets as did for the B. braunii 779 by removing any ESTs/cDNAs/con-tigs (for consistency, we use ESTs) whose length was less than 300nts and CD-Hit identity was 90 % or greater in
the transcriptomes of B. braunii Bot-88, Showa, Bot-70,
and Bot-22 [21, 23–25, 35]. To this end, we obtained sets of 8,302, 38,920, 1,665, and 6,848 ESTs in transcriptomes of B. braunii Bot-88, Showa, Bot-70, and Bot-22, respec-tively. The processed transcriptomes were subjected to BLASTN analysis (http://blast.ncib.nlm.nih.gov) against
the transcriptome of B. braunii 779. Based on a cutoff of
e value 1E−05, we found that, compared to others, the A
race B. braunii Bot-88 transcriptome shared the highest
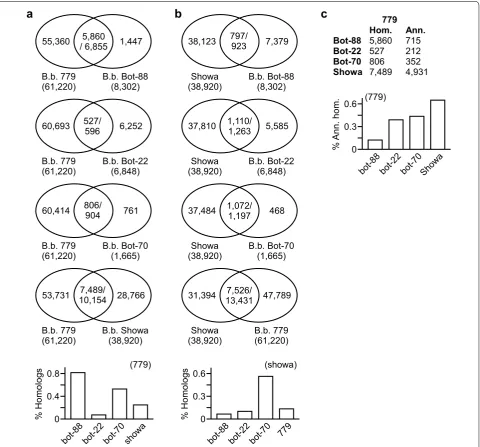
percentage of ESTs to that of B. braunii 779 (Fig. 4a, for
a complete list of homologous ESTs, see Additional file 5: Tables S4–S7).
Among the 3 published B race B. braunii
transcrip-tomes, Showa had the most completed transcriptome [21, 23, 25]. Hence, the Showa transcriptome was used as
reference for B race B. braunii transcriptome. Sequences
of B. braunii Bot-88, Bot-22, Bot-70, and 779 tran-scriptomes were subjected to homology analysis using
BLASTN against that of B. braunii Showa. With a
cut-off of e value 1E−05, we found that, among others, the
B race B. braunii Bot-70 shared the highest percentage of
ESTs to that of B. braunii Showa (Fig. 4b, for a complete
list of homologous ESTs, see Additional file 6: Tables S8– S11). It was noted that majority (i.e., ~75 %) of
transcrip-tomes between B. braunii A race 779 and B race Showa
were found to be different, implying that A and B races
belong to different sub-species of B. braunii.
Of the 5,860 B. braunii 779 ESTs that shared homolog
to A race B. braunii Bot-88, we noted that only 715
(or 12.2 %) had best-hit in the “best” proteins of the
6 comprehensively annotated genomes (Fig. 4c). On
the other hand, 40–60 % of the B. braunii 779 sheared
homologous ESTs to the B races appeared to have func-tional annotations. This result implied that many ESTs in B. braunii 779 or Bot-88 without a best-hit in the 6 selected genomes might represent novel genes specific to
A race B. braunii species.
ESTs associated with energy metabolisms are abundantly expressed in the log‑phase B. braunii 779 cells
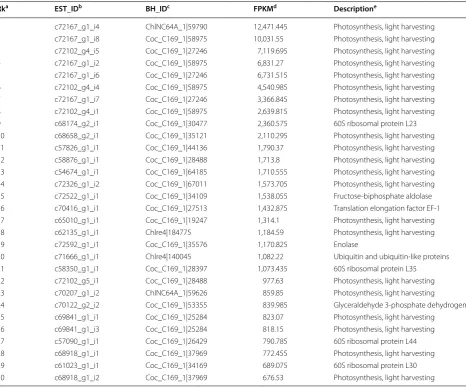
Individual EST levels were normalized to FPKM (i.e., Fragments Per Kilobase of EST per Million fragments mapped) and averaged from two biological repeated experiments for functional analysis of the transcriptome. Based on association with GO functions, we found that, of the top 30 most abundant ESTs ranked by level, 21 were associated with photosynthesis function (or light harvesting, GO:0009765) that was greatly enriched (i.e.,
239-fold increase, p value <1E−26). Besides,
glycoly-sis (i.e., GO:0006096) and translation (i.e., GO:0006412)
were also enriched by 20-fold and sixfold (i.e., p
value = 4.3E−03 and 8.7E−03), respectively (Table 3).
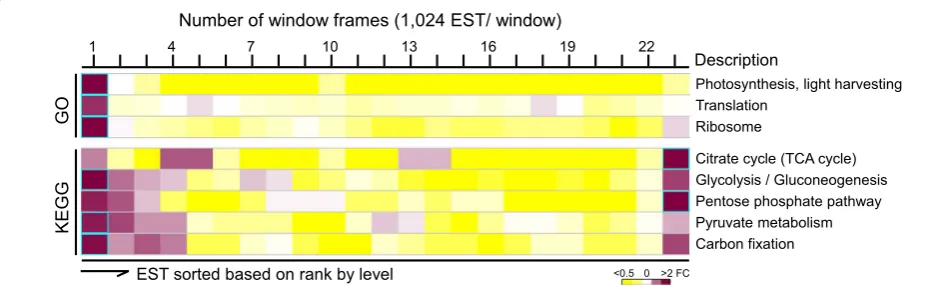
We assumed that a subset of ESTs in a pathway dis-playing a similar expression level (i.e., based on ranks) or expression coherence was likely to be co-regulated by a common transcriptional regulatory network. To search for potentially co-regulated transcriptional networks, we performed the sliding window analysis using a win-dow size of 1024 ESTs and a moving step of 512 ESTs along the sorted ESTs based on rank by level (see “Meth-ods”). According to 44 GO biological processes and 59 KEGG metabolic pathways (i.e., number of process- or pathway-associated EST >30), we found that 2 biologi-cal processes (i.e., photosynthesis and translation) and 5 metabolic pathways (i.e., TCA cycle, glycolysis/gluconeo-genesis, pentose phosphate pathway, pyruvate metabo-lism, and carbon fixation) whose ESTs were enriched in 1 of the 23 windows alone the sorted ESTs based on rank by level (Fig. 5). Photosynthesis and translation pro-cesses and glycolysis/gluconeogenesis, pyruvate metabo-lism and carbon fixation pathways were enriched in the window containing the highest ranked ESTs or in
win-dow 1 (i.e., fold change >2, p value <0.05 after
Bonfer-roni correction [40, 41]). Similar to translation, ribosome (See figure on previous page.)
Fig. 2 The subisolate belongs to the group of Botryococcus braunii race A. a Phylogenetic analysis of the subisolate with other Botryococcus spp. based on the 18S rDNA sequence. Groups of Botryococcus spp. race A, B, L are indicated. The subisolate of CCALA 779 in the phylogenetic tree is indicated. b GC spectrum of hydrocarbons extracted from cells of the subisolate prior to and after ND. X- and Y-axis indicate time in minute (min) and absorbance (abs) in arbitrary unit (a.u.). Compositions of hydrocarbon are indicated. The asterisk (*) indicates an unknown chemical species. c Mass spectra of the heptacosdiene C27H52 and heptacostriene C27H50. X- and Y-axis indicate mass in Dalton and density in arbitrary unit (a.u.),
b
0 1 2 3 4
30
0
40
0
60
0
1000 1800 3400 >340
0
Length bin (bps)
Number
of
EST
s
(x1,000
)
0 1 2 3 5 4
40 50 100 350
1600 7850 >785
0
Count bin (read/ EST)
Number
of
EST
s
(x1,000
)
0 2 4 6 8
Coc_C169 ChlNC64A
Chlre4
MicpuN
3
Ost9901 Thaps
3
Number
of
EST
s
(x1,000
)
0 2 4 6 8
Number
of
EST
s
(x100)
10
metabolic
proces
s
electro
nt
ransport
prot
.a
.a.
phosphor
yl
.
transport
proteol
ysis
translatio
n
carboh
yd
.m
et
.p
rocess
metabolism
regul.
of
transcriptio
n
protei
nf
olding
GO function (BP)
a
d
0 1 2 3 4
Number
of
EST
s
(x100)
Starch
and
sucros
em
et
.
Purine
met
.
Sphingogly
colipid
met.
Py
rimidine
met.
Glycerolipid
met.
Tr
yp
tophan
met
.
Folate
bios
yn
.
Inositol
phosphate
met.
Nicot
.&
nicotinamid
em
et
.
Ly
sd
egrad.
KEGG pathway
e
c
component-encoding ESTs were also enriched in win-dow 1 (i.e., fold change >2, p value <0.05 after Bonfer-roni correction). On the other hand, ESTs associated with the TCA cycle and pentose phosphate pathway were enriched the window containing the least abundant ESTs or in window 23 (i.e., fold change >2, p value <0.05 after Bonferroni correction). Photosynthesis (or light
harvesting) and carbon fixation were essential for cell growth under photoautotrophic conditions. High-level
expression of these functions in log-phase B. braunii cells
indicated that the slow growth was not a result of ineffi-cient energy metabolisms, rather than its devoting major portion of its energy flow to the lipid and hydrocarbon synthesis.
B.b. 779
(61,220) B.b. Bot-88(8,302)
55,360 / 6,855 1,4475,860
B.b. 779
(61,220) B.b. Bot-22(6,848)
60,693 527/596 6,252
B.b. 779
(61,220) B.b. Bot-70(1,665)
60,414 806/904 761
B.b. 779
(61,220) B.b. Showa(38,920)
53,731 7,489/10,154 28,766
0.8
0.4
0
%H
omolog
s
bot-8 8
bot-2 2
bot-7 0
show a
(779)
Showa
(38,920) B.b. Bot-88(8,302)
38,123 797/923 7,379
Showa
(38,920) B.b. Bot-22(6,848)
37,810 1,110/1,263 5,585
Showa
(38,920) B.b. Bot-70(1,665)
37,484 1,072/1,197 468
Showa
(38,920) B.b. 779(61,220)
31,394 7,526/13,431 47,789
0.6
0.3
0
%H
omolog
s
bot-8 8
bot-2 2
bot-7 0
779
(showa)
a
b
779Hom. Ann.
Bot-88 5,860 715
Bot-22 527 212
Bot-70 806 352
Showa 7,489 4,931
0.6
0.3
0
%A
nn
.h
om
.
bot-8 8
bot-2 2
bot-7 0
Show a
(779)
c
Fig. 4 Highest level of similarities is found between transcriptomes of the same race B. braunii strains. a Highest level of similarity is observed between transcriptomes of B. braunii Bot-88 and 779. Venn diagrams show the homologous ESTs between the query transcriptome (e.g., Bot-88, Bot-22, Bot-70, or Showa) and the subject transcriptome 779. Percent of homologous ESTs in query transcriptomes is shown at the bottom. b High-est level of similarity is found between the query transcriptomes of B. braunii Showa and Bot-70. Percent of homologous ESTs in query transcrip-tomes is shown at the bottom. c Lowest percentage of the known sequences is found in the homologous ESTs between B. braunii 779 and Bot-88. Number of all homologous (Hom.) ESTs and annotated (Ann.) ESTs between B. braunii 779 and other transcriptomes are listed on the upper panel. A
ESTs encoding photosynthesis and ribosome functions are down‑regulated upon ND in B. braunii 779
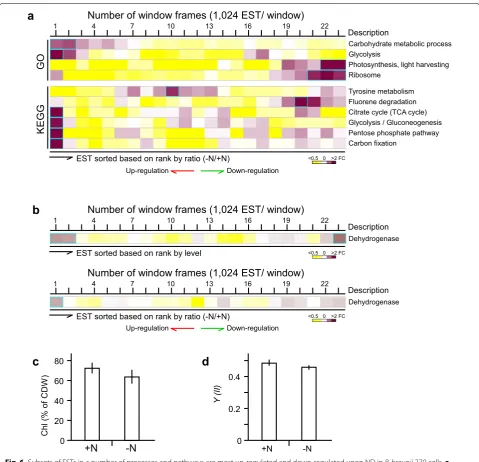
To investigate changes of transcriptional activities upon ND, levels of individual ESTs after ND were compared with those prior to ND. We assumed that if a subset of ESTs associated with a pathway was enriched within a window of 1024 ESTs ranked by ratio (i.e., fold change >2, p value <0.05 after Bonferroni correction), the subset of ESTs was potentially co-regulated by a common tran-scription regulatory network in response to ND. Using the sliding window approach along the sorted ESTs based on rank by ratio, we found that subsets of ESTs associ-ated with 3 GO biological processes (i.e., carbohydrate
metabolism, glycolysis, and photosynthesis) and 6 KEGG metabolic pathways (i.e., tyrosine metabolism, fluorene degradation, TCA cycle, glycolysis/gluconeogenesis, pen-tose phosphate pathway, carbon fixation) plus ribosome subunit were enriched in one of the 23 sliding windows (Fig. 6a).
We found that subsets of ESTs associated with carbohy-drate metabolism and glycolysis processes or TCA cycle, glycolysis/gluconeogenesis, pentose phosphate pathway, and carbon fixation metabolic pathways were enriched in the top most up-regulated window (see Fig. 6a). This was puzzling because cell growth would be arrested upon ND. However, it was proposed that ND induced oxidative Table 3 List of the top 30 most abundant ESTs in log-phase B. braunii 779 cells
a Rk stands for rank based on average level of FPKM. b EST_ID for ID of the B. braunii 779 ESTs.
c BH_ID for EST’s best-hit consistent of species and protein ID. d FPKM for average level of individual ESTs.
e Description is based on GO annotations.
Rka EST_IDb BH_IDc FPKMd Descriptione
1 c72167_g1_i4 ChlNC64A_1|59790 12,471.445 Photosynthesis, light harvesting
2 c72167_g1_i8 Coc_C169_1|58975 10,031.55 Photosynthesis, light harvesting
3 c72102_g4_i5 Coc_C169_1|27246 7,119.695 Photosynthesis, light harvesting
4 c72167_g1_i2 Coc_C169_1|58975 6,831.27 Photosynthesis, light harvesting
5 c72167_g1_i6 Coc_C169_1|27246 6,731.515 Photosynthesis, light harvesting
6 c72102_g4_i4 Coc_C169_1|58975 4,540.985 Photosynthesis, light harvesting
7 c72167_g1_i7 Coc_C169_1|27246 3,366.845 Photosynthesis, light harvesting
8 c72102_g4_i1 Coc_C169_1|58975 2,639.815 Photosynthesis, light harvesting
9 c68174_g2_i1 Coc_C169_1|30477 2,360.575 60S ribosomal protein L23
10 c68658_g2_i1 Coc_C169_1|35121 2,110.295 Photosynthesis, light harvesting
11 c57826_g1_i1 Coc_C169_1|44136 1,790.37 Photosynthesis, light harvesting
12 c58876_g1_i1 Coc_C169_1|28488 1,713.8 Photosynthesis, light harvesting
13 c54674_g1_i1 Coc_C169_1|64185 1,710.555 Photosynthesis, light harvesting 14 c72326_g1_i2 Coc_C169_1|67011 1,573.705 Photosynthesis, light harvesting
15 c72522_g1_i1 Coc_C169_1|34109 1,538.055 Fructose-biphosphate aldolase
16 c70416_g1_i1 Coc_C169_1|27513 1,432.875 Translation elongation factor EF-1
17 c65010_g1_i1 Coc_C169_1|19247 1,314.1 Photosynthesis, light harvesting
18 c62135_g1_i1 Chlre4|184775 1,184.59 Photosynthesis, light harvesting
19 c72592_g1_i1 Coc_C169_1|35576 1,170.825 Enolase
20 c71666_g1_i1 Chlre4|140045 1,082.22 Ubiquitin and ubiquitin-like proteins
21 c58350_g1_i1 Coc_C169_1|28397 1,073.435 60S ribosomal protein L35
22 c72102_g5_i1 Coc_C169_1|28488 977.63 Photosynthesis, light harvesting
23 c70207_g1_i2 ChlNC64A_1|59626 859.85 Photosynthesis, light harvesting
24 c70122_g2_i2 Coc_C169_1|53355 839.985 Glyceraldehyde 3-phosphate dehydrogenase
25 c69841_g1_i1 Coc_C169_1|25284 823.07 Photosynthesis, light harvesting
26 c69841_g1_i3 Coc_C169_1|25284 818.15 Photosynthesis, light harvesting
27 c57090_g1_i1 Coc_C169_1|26429 790.785 60S ribosomal protein L44
28 c68918_g1_i1 Coc_C169_1|37969 772.455 Photosynthesis, light harvesting
29 c61023_g1_i1 Coc_C169_1|34169 689.075 60S ribosomal protein L30
stress that in turn triggered reconfiguration of metabolic flux to provide the reducing power for the main cellular redox systems [42, 43]. Hence, we hypothesized that the up-regulation of citrate cycle, glycolysis/gluconeogenesis, pentose phosphate pathway, and carbon fixation metab-olisms was a result of reconfiguration of carbohydrate metabolisms for production of reducing power upon ND.
To test this possibility, we investigated all ESTs that were associated with unspecific dehydrogenase activ-ity based on annotation of “dehydrogenase”. We found that unspecific dehydrogenase ESTs were enriched in 20 metabolisms (i.e., fold change >2, p value <0.05) includ-ing citrate cycle, glycolysis/gluconeogenesis, pentose phosphate pathway, and carbon fixation metabolisms. ESTs associated with unspecific dehydrogenase were found to be up-regulated upon ND (i.e., fold change >1.5, p value <0.05 after Bonferroni correction) (Fig. 6b). This result implied that up-regulation of the unspecific dehy-drogenase-enriched metabolisms such as citrate cycle, glycolysis/gluconeogenesis, pentose phosphate pathway, and carbon fixation is likely a result of reconfiguration of metabolic flux to provide the reducing power for the main cellular redox systems.
We found that ESTs encoding photosynthesis (or light harvesting) and ribosome functions were enriched in the most down-regulated windows (i.e., ranked at bottom by
ratio) (see Fig. 6a). It was proposed that excess proteins
involved in light harvesting and protein synthesis were used as nitrogen-rich molecules to recycle nitrogen dur-ing ND [22]. To test this possibility, we measured chlo-rophyll content and photosynthetic yield in cells prior to and after ND. Although transcription level of ESTs asso-ciated with light harvesting and ribosome function was dramatically down-regulated, the level of chlorophyll and photosynthetic yield was only marginally affected
(Fig. 6c, d). This result implied that excess transcripts
encoding photosynthesis function and ribosomes were recycled for nitrogen hardly affecting the photosynthetic
efficiency upon ND in B. braunii 779.
Up‑ and down‑regulated ESTs induced by ND appear to be low‑ and high‑abundant ESTs in log‑phase B. braunii 779 cells, respectively
Based on the duplicate, read count per EST was esti-mated by RSEM [44] and subsequently the differential expression level was determined using EdgeR [45]. To this end, we obtained 593 and 116 differentially up- and
down-regulated ESTs in response to ND in B. braunii
779, respectively, based on a cutoff of fold change >2 and p value <0.05 (see “Methods”, for a complete list of
dif-ferentially transcribed ESTs, see Additional file 7: Table
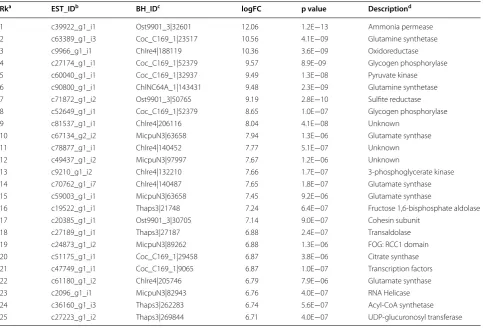
S12). Lists of the top 25 up-regulated and
down-regu-lated ESTs are shown in Tables 4 and 5. We found that
many up-regulated ESTs upon ND (i.e., fold change >2, p value <0.05) appeared to be the least abundant ESTs prior to ND (Fig. 7). Though nitrogen metabolic pathway was not up-regulated upon ND, we found that 7 ESTs (i.e., 1 ammonia permease, 2 glutamine synthases, and 4 gluta-mate synthases) out of the top 25 most up-regulated ones
were involved in nitrogen metabolism (see Table 4). On
the other hand, many down-regulated ESTs upon ND tended to be relatively highly abundant in cells prior to ND (see Fig. 7).
Transcriptional alteration of ESTs involved in alkadiene/ triene‑related biosynthesis of VLCFA upon ND in B. braunii 779
A subset of 55 enzymes that were potentially involved in the biosynthesis of VLCFA was proposed by Baba et al.,
out of which they detected 19 enzymes in the A race B.
EST sorted based on rank by level <0.5 0 >2 FC
Description 7
1 4 10 13 16 19 22
Number of window frames (1,024 EST/ window)
Photosynthesis, light harvesting Translation
Ribosome
Citrate cycle (TCA cycle) Glycolysis / Gluconeogenesis Pentose phosphate pathway Pyruvate metabolism Carbon fixation
GO
KEG
G
braunii Bot-88 [24]. Based on association with these EC
numbers, we detected 20 enzymes in the B. braunii 779
transcriptome, of which, 11 were those previously found in B. braunii Bot-88 [24], suggesting that A race B.
brau-nii strains share many VLCFA biosynthetic enzymes (i.e.,
p value = 0.0137).
We found that each enzyme was encoded by various
copies of the non-redundant ESTs (Fig. 8a). Levels of
individual copies of non-redundant ESTs ranged from 1.9 to 110 FPKM in cells prior to and from 1.9 to 80 FPKM after ND based on the average of two repeats. There were 1 significantly up-regulated and 3 down-regulated ESTs
EST sorted based on rank by level <0.5 0 >2 FC
Description 7
1 Number of window frames (1,024 EST/ window)4 10 13 16 19 22
Dehydrogenase
EST sorted based on rank by ratio (-N/+N) <0.5 0 >2 FC
Up-regulation Down-regulation
GO
KEG
G
Description 7
1 Number of window frames (1,024 EST/ window)4 10 13 16 19 22
Carbohydrate metabolic process Glycolysis
Photosynthesis, light harvesting Ribosome
Tyrosine metabolism Fluorene degradation Citrate cycle (TCA cycle) Glycolysis / Gluconeogenesis Pentose phosphate pathway Carbon fixation
a
b
Up-regulation Down-regulation
EST sorted based on rank by ratio (-N/+N) <0.5 0 >2 FC
Description 7
1 Number of window frames (1,024 EST/ window)4 10 13 16 19 22
Dehydrogenase
c
+N -N
0 20 40 60 80
Ch
l(
%o
fC
DW
)
+N -N
0 0.4
Y(
II)
0.2
d
Fig. 6 Subsets of ESTs in a number of processes and pathways are most up-regulated and down-regulated upon ND in B. braunii 779 cells. a Distribution of ESTs associated with 4 GO functions and 6 KEGG pathways based on ranks by ratio. b Distribution of ESTs associated with unspecific dehydrogenase based on ranks by level (upper panel) and ratio (lower panel). The display is identical to Fig. 5. c Levels of chlorophyll content. The
(i.e., fold change >2, p value <0.05). After summation of levels of all ESTs associated with the same enzyme, we found that the summative level of all enzymes tested was not greatly altered (i.e., fold change <2) upon ND except for acetyl-CoA oxidase (i.e., >twofold decrease) (Fig. 8b, for summative level of individual enzymes, see Additional
file 8: Table S13). This result indicated that no apparent
transcriptional alteration for most enzymes (i.e., not indi-vidual ESTs) involved in VLCFA biosynthesis upon ND in B. braunii 779.
Transcriptional alteration of ESTs involved
in botryococcene or squalene‑related biosynthesis upon ND in B. braunii 779
Transcriptome of the B race B. braunii Showa was well
assembled and comprehensively annotated [21]. To examine whether the transcription of enzymes involved in biosynthesis of botryococcene or squalene was altered
upon ND in A race B. braunii 779, we compared the ESTs
between B. braunii 779 and Showa based on the
associa-tion with EC numbers. To this end, we found 58 and 42 enzymes related to botryococcene or squalene biosynthe-sis were associated with curated and machine-assembled
ESTs in B. braunii Showa [21], respectively (see
“Meth-ods”). Of the 58 enzymes associated with curated ESTs in B. braunii Showa, 13 (or 22.4 %) were found to
asso-ciate with a total of 29 ESTs in B. braunii 779 (Fig. 9a,
left panel). Based on the summation of all ESTs associ-ated with the same enzyme, we found that summative transcription level of all enzymes was not dramatically altered upon ND (i.e., fold change <2), except for TKTL and G44OX (i.e., >twofold increase) (Fig. 9a, right panel, for summative level of individual enzymes, see Addi-tional file 9: Table S14). On the other hand, 23 out of 42
(or 54.8 %) machine-assembled enzymes in B. braunii
Showa were found to associate with 171 ESTs in B.
brau-nii 779, five of which associated with 19 or more ESTs
(Fig. 9b, left panel). Similar to that of curated enzymes,
Table 4 List of the top 25 most up-regulated ESTs upon ND in B. braunii 779
a Rk stands for rank (i.e., by ratio). b EST_ID for B. braunii ESTs. c BH_ID for ID of the best-hit.
d Description is based on the KOG annotation associated with the 6 completed algal genomes in JGI (see text).
Rka EST_IDb BH_IDc logFC p value Descriptiond
1 c39922_g1_i1 Ost9901_3|32601 12.06 1.2E−13 Ammonia permease
2 c63389_g1_i3 Coc_C169_1|23517 10.56 4.1E−09 Glutamine synthetase
3 c9966_g1_i1 Chlre4|188119 10.36 3.6E−09 Oxidoreductase
4 c27174_g1_i1 Coc_C169_1|52379 9.57 8.9E–09 Glycogen phosphorylase
5 c60040_g1_i1 Coc_C169_1|32937 9.49 1.3E−08 Pyruvate kinase
6 c90800_g1_i1 ChlNC64A_1|143431 9.48 2.3E−09 Glutamine synthetase
7 c71872_g1_i2 Ost9901_3|50765 9.19 2.8E−10 Sulfite reductase
8 c52649_g1_i1 Coc_C169_1|52379 8.65 1.0E−07 Glycogen phosphorylase
9 c81537_g1_i1 Chlre4|206116 8.04 4.1E−08 Unknown
10 c67134_g2_i2 MicpuN3|63658 7.94 1.3E−06 Glutamate synthase
11 c78877_g1_i1 Chlre4|140452 7.77 5.1E−07 Unknown
12 c49437_g1_i2 MicpuN3|97997 7.67 1.2E−06 Unknown
13 c9210_g1_i2 Chlre4|132210 7.66 1.7E−07 3-phosphoglycerate kinase
14 c70762_g1_i7 Chlre4|140487 7.65 1.8E−07 Glutamate synthase
15 c59003_g1_i1 MicpuN3|63658 7.45 9.2E−06 Glutamate synthase
16 c19522_g1_i1 Thaps3|21748 7.24 6.4E−07 Fructose 1,6-bisphosphate aldolase
17 c20385_g1_i1 Ost9901_3|30705 7.14 9.0E−07 Cohesin subunit
18 c27189_g1_i1 Thaps3|27187 6.88 2.4E−07 Transaldolase
19 c24873_g1_i2 MicpuN3|89262 6.88 1.3E−06 FOG: RCC1 domain
20 c51175_g1_i1 Coc_C169_1|29458 6.87 3.8E−06 Citrate synthase
21 c47749_g1_i1 Coc_C169_1|9065 6.87 1.0E−07 Transcription factors
22 c61180_g1_i2 Chlre4|205746 6.79 7.9E−06 Glutamate synthase
23 c2096_g1_i1 MicpuN3|82943 6.76 4.0E−07 RNA Helicase
24 c36160_g1_i3 Thaps3|262283 6.74 5.6E−07 Acyl-CoA synthetase
Table 5 List of the top 25 most down-regulated ESTs upon ND in B. braunii 779
a Rk stands for rank (i.e., by inverse ratio). b EST_ID for B. braunii ESTs.
c BH_ID for ID of the best-hit.
d Description is based on the KOG annotation associated with the 6 completed algal genomes in JGI (see text).
Rka EST_IDb BH_IDc logFC p value Descriptiond
1 c73365_g3_i6 Coc_C169_1|45719 −4.55 6.4E−03 Unknown
2 c54903_g1_i1 Coc_C169_1|45718 −4.40 2.5E−03 Tyrosine kinase
3 c72890_g1_i2 ChlNC64A_1|144962 −4.20 1.8E−03 Prolylcarboxypeptidase
4 c69499_g1_i5 Chlre4|149722 −4.18 4.5E−03 Unknown
5 c66708_g1_i4 Coc_C169_1|65911 −3.98 2.8E−04 Collagens
6 c72757_g1_i1 Coc_C169_1|17756 −3.54 1.5E−03 Isocitrate lyase
7 c66635_g1_i1 ChlNC64A_1|139124 −3.46 2.8E−03 Nuclear receptor coregulator
8 c32919_g1_i2 Coc_C169_1|18195 −3.44 2.1E−04 Aspartate aminotransferase
9 c71206_g1_i2 Coc_C169_1|62318 −3.36 2.0E−02 UDP-glucuronosyl transferase
10 c68672_g1_i4 Coc_C169_1|65911 −3.31 9.4E−04 Collagens
11 c55715_g1_i1 Coc_C169_1|68180 −3.27 6.9E−04 Ca2+-dependent protein kinase
12 c71767_g1_i2 Chlre4|104719 −3.23 5.1E−03 ATP-dependent RNA helicase
13 c69499_g1_i4 Chlre4|149722 −3.16 1.7E−02 Unknown
14 c73427_g1_i1 Coc_C169_1|35165 −3.01 1.0E−02 O-linked GlcNAc transferase
15 c66185_g1_i1 Coc_C169_1|33465 −3.01 1.6E−02 Unknown
16 c67100_g1_i1 Chlre4|130199 −3.01 2.2E−02 Acetylglutamate kinase
17 c71718_g1_i18 Coc_C169_1|68054 −3.01 4.4E−03 Ca2+-permeable cation channel
18 c70935_g1_i8 Coc_C169_1|13500 −3.00 4.4E−03 Unknown
19 c51991_g1_i1 Coc_C169_1|63373 −2.99 1.2E−02 Diacylglycerol acyltransferase
20 c74265_g5_i3 Coc_C169_1|30369 −2.94 3.9E−03 Malate synthase
21 c73301_g5_i1 Coc_C169_1|17144 −2.94 1.5E−02 Serine/threonine protein kinase
22 c71077_g1_i3 ChlNC64A_1|59702 −2.94 8.1E−03 Unknown
23 c73505_g1_i1 Coc_C169_1|41290 −2.92 2.0E−03 Unknown
24 c74003_g1_i7 Coc_C169_1|35165 −2.89 6.3E−03 O-linked GlcNAc transferase 25 c62188_g1_i1 Coc_C169_1|11065 −2.89 9.6E−03 Sensory transduction histidine kinase
Up-regulation Down-regulation
Description 7
1 4 Number of window frames (1,024 EST/ window)10 13 16 19 22
Up-regulated Down-regulated
EST sorted based on rank by ratio (-N/+N) <0.5 0 >2 FC
Description 7
1 4 Number of window frames (1,024 EST/ window)10 13 16 19 22
Up-regulated Down-regulated
EST sorted based on rank by level <0.5 0 >2 FC
transcriptional level of all enzymes was not dramatically altered upon ND (i.e., fold change <2), except for DGAT and HK (i.e., >twofold increase), based on the summa-tive level of all ESTs associated with the same enzyme
(Fig. 9b, right panel, for summative level of individual
enzymes, see Additional file 10: Table S15). These results suggested that transcriptional level of most enzymes involved in botryococcene or squalene biosynthetic
path-ways was not significantly altered upon ND in A race B.
braunii 779.
Discussion
The colonial green microalga B. braunii is unique for its
accumulation of hydrocarbons, which is applicable for biofuel production. However, slow growth has impeded its application for large-scale production of hydrocar-bons. Unlike our previous report that a rapidly growing
subisolate from a culture of B. braunii UTEX572 has
turned out to be a Botryosphaerella (UTEX2629)
con-taining no hydrocarbons [22], we show, in this study, that the moderately growing subisolate from a culture
Level
Rati
o
EC# +N -N
Bot-88 779
non-redundant EST copies Group of non -redundant EST s 0
<0.5 >2 FC
02040>80 FPKM
Activity Level Rati o EST-ID +N -N 1 2 3 4 5 6 7 8 9 10 11 12 13 14 15 16 17 18 19 20 0
<0.5 >2 FC
02040>80 FPKM
a
b
c55416_g1_i1__ c71963_g3_i1 c71963_g3_i3__ c72521_g1_i6 c49241_g1_i1 c61371_g2_i1 c61371_g1_i1 c34700_g1_i1 c61371_g3_i1 c48912_g1_i1 c41718_g1_i1__ c70584_g3_i1 c70584_g1_i1 c70584_g1_i2__ c70316_g1_i1__ c62492_g1_i1__ c68497_g1_i1 c69375_g2_i2 c69923_g1_i1 c71638_g1_i2 c61348_g1_i1 c64133_g1_i2 c74046_g1_i1 c57307_g1_i1 c63597_g1_i2 c67293_g2_i2 c67293_g1_i5 c67293_g1_i1 c67293_g1_i2 c67293_g2_i1 c63597_g1_i4 c70578_g1_i4 c70578_g1_i1 c57307_g1_i2 c70578_g1_i3 c23367_g1_i2 c61348_g1_i2 c68171_g1_i1 c75190_g1_i1 c7077_g1_i1__ c5750_g1_i1__ c477_g1_i1 c61357_g2_i1 c70378_g1_i3 c70378_g1_i4 c70378_g1_i1 c22017_g1_i1 c9479_g1_i1 c64750_g1_i1__ c73965_g1_i4 c73965_g1_i2 c73403_g1_i2 c73403_g1_i3 c71812_g1_i1 c65400_g1_i1 c65400_g2_i2__ c63546_g1_i1__ c34625_g1_i1 c80212_g1_i1__ c75891_g1_i1 c53243_g2_i1 c67457_g2_i2 c67457_g2_i3 c57664_g1_i1 c24167_g1_i1 c61572_g2_i2 c54915_g1_i1__ c43791_g1_i1 c71467_g1_i4 c71467_g1_i3 c43770_g1_i1 c44431_g1_i4__ c59773_g1_i2 c71728_g1_i2 c54192_g1_i1 c65236_g1_i1__ c64271_g1_i1 c49787_g1_i1 c63108_g1_i1 c67140_g1_i1 c16480_g1_i1 c59260_g1_i1__ c54204_g1_i1 c68075_g2_i2 c68075_g1_i1 c72385_g1_i4 c72385_g1_i5__ c55935_g1_i1 c73898_g2_i3 c73898_g2_i1__ c28192_g1_i1 c59349_g1_i1__ c3592_g1_i1 c61167_g1_i2 c65606_g1_i1 c50602_g1_i1 c70782_g2_i1 c70782_g2_i2 c66295_g2_i2 c37967_g1_i1 c80884_g1_i1 c45525_g1_i2 c61100_g1_i2 c61100_g1_i4 c91787_g1_i1 c61100_g1_i1 c66284_g1_i1 c70192_g2_i1 c73140_g1_i6 c73140_g1_i3 c73140_g1_i5 c37432_g1_i1 c69675_g1_i2__ 4.1.1.9 2.3.1.39 1.1.1.100 4.2.1.-1.3.1.9 3.1.2.22 6.2.1.3 2.3.1.9 4.2.1.17 1.3.3.6 1.3.99.3 2.3.1.16 1.3.1.38 2.3.1.51 3.1.3.4 2.7.1.107 3.1.1.23 3.1.1.3 2.7.1.30 2.3.1.-Malonyl-CoA decarboxylase ACP S-malonyltransferase 3-Oxoacyl-ACP reductase 3-Hydroxyacyl-enzyme dehydratase Enoyl-ACP reductase (NADH) Palmitoyl-protein hydrolase Long-chain-fatty-acid--CoA ligase Acetyl-CoA C-acetyltransferase Enoyl-CoA hydratase Acyl-CoA oxidase* Acyl-CoA dehydrogenase Acetyl-CoA C-acyltransferasetrans-2-Enoyl-CoA reductase (NADPH) 1-Acylglycerol-3-phosphate O-acyltransferase Phosphatidate phosphatase Diacylglycerol kinase Acylglycerol lipase Triacylglycerol lipase Glycerol kinase 3-Ketoacyl-CoA synthase 1 2 3 4 5 6 7 8 9 10 11 12 13 14 15 16 17 18 19 20 0 0 1 0 0 1 8 0 1 0 0 0 2 1 1 2 0 5 4 4 1 2 8 3 1 1 24 1 8 7 1 2 8 5 4 6 5 3 2 21 113 EST ** * *
Fig. 8 Change of transcriptional levels of ESTs involved in VLCFA biosynthesis upon ND. +N and −N indicate prior to and after ND, respectively. Individual enzymes are numbered and whose EC# is indicated. Many enzymes are encoded by various numbers of non-redundant ESTs in B. braunii
(779) or (Bot-88). a Level and ratio of individual EST involved in VLCFA biosynthesis in cells prior to (+N) and after (−N) ND are shown. Differentially transcribed ESTs upon ND are marked by asterisks on the left. b Level and ratio of group ESTs (i.e., sum of individual levels of ESTs encode the same enzyme) involved in VLCFA biosynthesis are shown. Activity whose summative level is greatly changed (i.e., fold change >2) is indicated by an
Level
Rati
o
EC#
+N -N Activity
Level Rati o EST-ID +N -N non-redundant EST copies 8 9 10 11 12 13 Grou po fnon -redundant EST s 0
<0.5 >2 FC
02040>80 FPKM
1 2 3 4 5 6 7 0
<0.5 >2 FC
02040>80 FPKM
c69391_g1_i3__ c42783_g1_i1 c42843_g1_i1 c53615_g1_i1 c53759_g1_i1__ c72698_g2_i4 c35651_g1_i1__ c8142_g1_i1 c10756_g1_i1 c77577_g1_i1__ c53351_g1_i1 c63708_g1_i1__ c71117_g1_i1 c71796_g2_i1 c71796_g2_i2 c67368_g1_i1 c67368_g1_i5__ c71875_g1_i2__ c42457_g1_i2 c80940_g1_i1__ c72046_g3_i1__ c68346_g2_i1 c57672_g1_i1__ c65326_g1_i1 c72250_g2_i2__ c56166_g1_i1 c92722_g1_i1__ c52098_g1_i3 c52098_g1_i2__ 4.6.1.12 5.3.3.2 5.1.3.1 2.2.1.1 2.5.1.21 5.4.99.8 5.5.1.9 1.3.1.21 1.1.1.170 3.1.1.13 2.1.1.95 2.1.1.114 1.14.11.12 2-C-methyl-D-erythritol 2
Isopentenyl-diphosphate D-isomerase (Idi) Ribulose phosphate 3-epimerase (RPE) Transketolase (TKTL)*
Squalene synthase (SQS) Cycloartenol synthase (CAS)
Cycloeucalenol cycloisomerase (CPI1) 7-dehydrocholesterol reductase (DHCR7) Sterol-4a-carboxylate 3-dehydrogenase Sterol esterase (LIPA)
Tocopherol methyltransferase (GTMT)
Hexaprenyldihydroxybenzoate methyltransferase (Coq3) Gibberellin-44 dioxygenase (G44OX)*
1 4 2 3 2 5 1 2 1 2 2 2 2 1 2 3 4 5 6 7 8 9 10 11 12 13 13 14 15 16 17 18 19 c48170_g1_i1 c43644_g1_i1__ c74057_g2_i2 c73357_g2_i1 c74267_g4_i1 c74267_g1_i2__ c73836_g1_i8__ c73929_g2_i2 c42610_g1_i1__ c72419_g1_i1 c65039_g1_i2 c64865_g1_i1 c88469_g1_i1__ c71963_g3_i1 c71963_g3_i3__ c72521_g1_i6 c49241_g1_i1 c61371_g2_i1 c61371_g1_i1 c34700_g1_i1 c61371_g3_i1 c48912_g1_i1 c41718_g1_i1__ c68497_g1_i1 c69375_g2_i2 c69923_g1_i1 c71638_g1_i2 c61348_g1_i1 c64133_g1_i2 c74046_g1_i1 c57307_g1_i1 c63597_g1_i2 c67293_g2_i2 c67293_g1_i5 c67293_g1_i1 c67293_g1_i2 c67293_g2_i1 c63597_g1_i4 c70578_g1_i4 c70578_g1_i1 c57307_g1_i2 c70578_g1_i3 c23367_g1_i2 c61348_g1_i2 c68171_g1_i1 c75190_g1_i1 c7077_g1_i1___ c74349_g1_i4__ c3592_g1_i1 c61167_g1_i2 c65606_g1_i1 c50602_g1_i1 c70782_g2_i1 c70782_g2_i2 c66295_g2_i2 c37967_g1_i1 c80884_g1_i1 c45525_g1_i2 c61100_g1_i2 c61100_g1_i4 c91787_g1_i1 c61100_g1_i1 c66284_g1_i1 c70192_g2_i1 c73140_g1_i6 c73140_g1_i3 c73140_g1_i5 c37432_g1_i1 c69675_g1_i2__ c61968_g1_i4 c61968_g1_i3 c70688_g2_i2 c48858_g1_i1 c36259_g1_i1 c51929_g1_i1 c89746_g1_i1 c48860_g1_i1 c4646_g1_i1 c59949_g1_i1 c59949_g2_i1 c65651_g1_i1 c68718_g1_i3 c71611_g2_i1 c63060_g1_i1 c44226_g1_i1 c71611_g2_i3 c33715_g1_i1 c33715_g1_i2 c68718_g1_i1 c68995_g2_i1 c72638_g3_i2 c57994_g1_i2 c57994_g1_i1 c73585_g1_i6__ 2.1.1.10 2.1.1.13 2.1.1.14 2.5.1.6 6.3.4.14 2.3.1.39 1.1.1.100 6.2.1.3 1.14.19.- 2.3.1.- 1.1.1.- 4.2.1.-2.7.1.30 2.3.1.51 3.1.3.4 2.3.1.20 2.7.1.1 5.4.2.2 2.7.7.27 2.4.1.18 2.7.7.9 2.7.1.137
3.4.22.-Homocysteine S-methyltransferase (MmuM) Homocysteine S-methyltransferase (MetH) Homocysteine S-methyltransferase (MetE) S-adenosylmethionine synthase (MetK) Type I acetyl-CoA carboxylase ACP:S-malonyltransferase (FabD) b-ketoacyl:ACP reductase (FabG) Long chain fatty acid:CoA ligase (FadD) Delta (12) fatty acid desaturase (FAD6) Very long chain fatty acid elongase (ELOVL5) b-ketoacyl-CoA reductase (KAR)
3-hydroxyacyl-CoA dehydratase (PHS1) Glycerol kinase (GlpK)
Lysophosphatidic acid acyltransferase (LPAAT) Phosphatidic acid phosphatase (PAP) Diacylglycerol acyltransferase (DGAT)* Hexokinase (HK)*
Phosphoglucomutase (PGM)
Glucose-1-phosphate adenylyltransferase (GlgC) 1,4-alpha-glucan branching enzyme
UTP:a-D-glucose-1-phosphate uridylyltransferase (UGP) Phosphatidylinositol 3-kinase (VPS34)
Autophagy-related protein 4 (ATG4) 2 4 1 2 4 2 8 24 1 21 25 3 2 5 4 3 4 3 4 3 8 19 19 c70584_g3_i1 c70584_g1_i1 c70584_g1_i2__ c28192_g1_i1 c59349_g1_i1__ c43791_g1_i1 c71467_g1_i4 c71467_g1_i3 c43770_g1_i1 c44431_g1_i4__ c59773_g1_i2 c71728_g1_i2 c54192_g1_i1 c65236_g1_i1__ c55911_g1_i3 c42505_g1_i1 c55911_g1_i2__ c16885_g1_i1 c14349_g1_i1 c41464_g1_i1 c41464_g1_i3__ c74170_g1_i4 c72938_g1_i4 c72938_g1_i3__ c71884_g1_i1 c64913_g1_i2 c73294_g3_i1 c73294_g2_i1__ c73582_g1_i2 c67082_g1_i1 c56557_g1_i1__ c63070_g1_i1 c60717_g1_i2 c63070_g2_i1 c73709_g1_i8 c73709_g1_i2 c73709_g1_i3 c73709_g1_i7 c73709_g1_i1__ c89642_g1_i1 c54907_g1_i1 c60444_g1_i1 c89114_g1_i1 c31095_g1_i1 c72652_g2_i1 c71871_g1_i3 c71871_g1_i1 c71871_g1_i2 c43153_g1_i1 c89128_g1_i1 c20526_g1_i2 c25041_g1_i1 c74412_g1_i1 c79576_g1_i1 c84371_g1_i1 c48692_g1_i1 c15193_g1_i1 c44923_g1_i2__ c53101_g1_i1 c88245_g1_i1 c6189_g1_i1 c57095_g1_i1 c69532_g1_i1 c69532_g1_i3 c73687_g2_i1 c72897_g1_i6 c72897_g1_i4 c84169_g1_i1 c71313_g1_i4 c70602_g2_i2 c71313_g1_i5 c70402_g2_i4 c70402_g2_i3 c72396_g1_i4 c71516_g1_i5 c71516_g1_i4 c70402_g1_i1__ Level Rati o EC#
+N -N Activity
Level Rati o EST-ID +N -N Grou po fn on -redundant EST s 0 <0.5 >2 FC
02040>80 FPKM
0 <0.5 >2 FC
02040>80 FPKM
1 2 3 4 5 6 7 8 9 10 11 12 13 14 15 16 17 18 19 20 21 22 23 10 9 8 7 6 5 43 2 1 12
11 2021
22 23 Level Rati o EST-ID +N -N non-redundant EST copies
a
b
29 EST 171 EST ** ** * 0 0 0 0 0 0 0 0 0 0 0 0 0 0 * * 0 0 0 0 0 0 0 0 0 1 0 0 0 0 0 0 0 0 0 0 0 0 0 0 0 0 0 0 0 0 0 0 0 0 0 0 0 0 0 0 0 0 0 0 0 *0 0 0 0 0 0 0 0 0 0 0 0 0 0 0 0 0 0 0 0 0 0 0 *0 0 0 *0 0 0 0 0 0 0 0 0 0 0 0 0 0 0 0 0 0 0 0 0 0 0 0 0 0 0 0 0 0 0 0 0 0 0 0 0 0 0 0 0 0 0 0 0 0 0 0 0 0 0 0 0 0 0 0 0 0 0 0 0 0 0 0 0 0 0 0 0 0 0 0 0 0 0 0 0 0 0 0 0 **0of Botryococcus sp. CCALA-779 belongs to the A race B. braunii based on the results of 18S rRNA sequence-based phylogenetic analysis and GC–MS analysis of hydrocarbon compositions (see Fig. 2). The lipid content
of this moderately growing B. braunii 779 strain under
phototrophic conditions can be greatly enhanced by ND, making it attractive for potential production of hydrocar-bons at large scale.
In comparison with that of model green algal
organ-isms Chlorella variabilis [35] and Chlamydomonas
reinhardtii [36], growth rate of B. braunii is very slow (i.e., population doubling time of less than a day versus 5–7 days). In this study, we show that, according to the pathway-based transcriptomic analysis, energy metabolic ESTs are highly abundant in the log-phase cells,
indicat-ing that the slow growth rate of B. braunii species is not
a result of inefficient energy metabolic activity in cells. It is likely that energy flow generated from photosynthesis in B. braunii cells is largely directed to the biosynthesis of lipid and hydrocarbon. We propose that if the direction of energy flow could be controlled in cells, the productiv-ity would be improved by first directing the energy flow to population growth. After reaching the maximum den-sity of cell population, energy flow would be re-directed to lipid and hydrocarbon synthesis.
It has been shown that the modes of hydrocarbon
biosynthesis in A race B. braunii Bot-88 and B race B.
braunii Showa, Bot-22, and Bot-70 are very different according to the 454 sequencing-based transcriptomic
analyses [21, 23–25]. In this study, we performed
tran-scriptomic analysis of the B. braunii 779 using the
Illu-mina sequencing-based platform. Comparative analysis indicates that highest percentage of sequence similarities is found between transcriptomes of the same race such
as A race B. braunii strains 779 and Bot-88 and B race
strains Showa and Bot-70 (see Fig. 4). However, we find
that transcriptome of Bot-22 shares little similarity to
either B race B. braunii Showa or A race 779 strains,
sug-gesting that it represents no A or B race transcriptome. The difference between transcriptomes of A and B races implies that they belong to different sub-species.
It is worth noting that 40–60 % of the homologous
ESTs between B. braunii 779 and other B race strains
are known sequences (or having best-hit in the 6 algal genomes used in this study). On the other hand, only
12 % of the homologous ESTs between A race B.
brau-nii 779 and Bot-88 are known sequences. Majority of the
homologous ESTs in A race transcriptomes are unknown sequences, suggesting that there are many novel genes in B. braunii. Given that many enzymes encoding VLCFA
biosynthesis have not been found in A race B.
brau-nii, it is possible that sequences encoding these
enzy-matic activities may not be currently known. Hence, we
propose that B. braunii provides a rich source for
discov-ery of novel genes involved in VLCFA biosynthesis.
To understand the biosynthesis of n-alkadiene and
triene, Baba et al. have proposed a list of 55 enzymes that are involved in biosynthesis of VLCFA [24]. Nineteen out
of the 55 enzymes are found in B. braunii Bot-88. In this
study, we find 20 out of the 55 enzymes involved in the biosynthesis of the VLCFA, 13 of which are those
pre-viously found in B. braunii Bot-88 (i.e., p value <0.05),
consistent with the notion that A race B. braunii strains
belong to the same sub-species. Eight more enzymes involved in biosynthesis of VLCFA are found in this
study. Additionally, 36 out of 100 enzymes in B. braunii
Showa [21] involved in biosynthesis of botryococcene or
squalene are found in B. braunii 779 (see Fig. 9),
consist-ent with the level of similarity between the two transcrip-tomes (see Fig. 4).
Conclusions
Taken together, our results show that the subisolate B.
braunii 779 exhibits a moderate growth rate (i.e., up to
1.23 gram of CDW per liter per day in 2× BB medium)
and high lipid content (i.e., up to 75 % of DCW after induction by ND), attractive for biofuel production.
Comparative transcriptomic analysis between A (i.e., B.
braunii 779 and Bot-88) and B (i.e., B. braunii Showa, Bot-22, and Bot-70) races indicates that difference races of B. braunii strains may belong to different sub-spe-cies. Many homologs of unknown sequences found in B. braunii 779 and Bot-88 suggest that these unknown sequences are most likely novel genes, part of which pos-sibly encodes enzymes involved in VLCFA biosynthe-sis. This is consistent with the observation of half of the proposed enzymes involved in VLCFA biosynthesis has
not been found in A race B. braunii. We propose that B.
braunii transcriptomes provide a rich source for discov-ery of novel genes involved in hydrocarbon biosynthesis.
Methods
Algal culture manipulation
The algae culture CCALA779 was obtained from the Culture Collection of Autotrophic Organisms, Czech
(ccala.butbn.cas.cz) and a subisolate B. braunii 779 was
obtained as rapidly growing colonies on Bold’s modified Bristol (BB) [30] solid medium. The subisolate was
cul-tivated using BB (or 2× BB) liquid medium in a 2.5-L
low-form flask with shaking at 100 rpm at 25 °C under
continuous illumination flux density of ~250 μmol
pho-ton m−2 s−1. Culture was shaken at 100 rpm at 25 °C (or
RT) supplied with 2 % CO2 through bubbling. For
analy-sis of the subisolate in response to ND, the log-phase cells
in nitrogen-replete 2× BB medium (or 2BB + N) were
and resuspended in nitrogen-depleted 2× BB medium (or 2BB-N) isovolumetrically. After growing in 2BB-N medium for 3 days, cells were harvested by filtration for cell dry weight analysis and centrifugation for lipid con-tent and transcriptomic analyses.
For growth rate analysis, cell dry weight (CDW) was determined using the gravimetric methodology. In brief, approximately 200 ml (i.e., for the first 2 time points) or 100 ml (i.e., for the time points at 4 days and after) from the cell culture was harvested by filtration using the glass fiber filter GF/A (Whatman/GE Healthcare, Kent, UK) and dried in oven at 80 °C overnight. CDW was gravi-metrically determined in triplicate using the AG204 bal-ance (Mettler-Toledo Inc., Columbus, OH, USA). Growth rate was estimated using the exponential growth formula
where r is growth rate in a time interval from t2 to t1, and
xt2 and xt1 is the CDW at time points t2 and t1,
respec-tively. Here, the time interval t2 − t1 is 2 days. The growth
rates at each 2-day interval from day 0 to day 8 are pre-sented in Table 2.
Determination of chlorophyll contents
To determine chlorophyll content, cells were collected by centrifugation and the cell pellet was resuspended in 96 % ethanol and broken in the glass-bead beater (Fast-Prep, MP Biomedicals, Solon, OH, USA). After incuba-tion with ethanol for 2 h at 4 °C, cell debris was removed using centrifugation. The resulting supernatant was sub-jected to OD measurement at the wavelength of 645 nm and 663 nm, with the 96 % ethanol as blank. Total chlo-rophyll content (i.e., chl a and b) was estimated using a
formula C (mg/L) = 20.2 OD645 + 8.05 OD663 [46] and
was converted to percent of CDW.
Determination of photosynthesis efficiency
To determine photosynthesis efficiency, cells were sub-jected to PAM-fluorescence analysis using a fluorom-eter (Imaging-PAM, Heinz Walz GmbH, Effeltrich, Germany) according to the manufacturer’s instruction.
Briefly, the Fm′ and F were determined at the arctic light
of 250 μmol photon m−2 s−1 to mimic the growth
con-ditions. The quantum yield was based on the formula
Y(II) = (Fm′ − F)/Fm′ [47].
Fluorescence microscopic analyses
To examine the accumulation of lipid and
hydrocar-bon contents in B. braunii 779 cells, 4 μl of 0.25 mg/ml
Nile red in acetone was added to 1 ml of fresh culture
r=
x
t2
xt1
1/(t2−t1)
−1
according to a previously described method [22]. In brief, after incubation at RT in dark for 15 min, fluorescence signals in the cells were examined using the Zeiss Axio-vert 200 M (Carl Zeiss AG, Oberkochen, Germany) with a Zeiss EC Plane Neofluar 40x/0.75 objective lens with a filter cube no. 15 (EX BP 546/12, BS FT 580, EM LP 590). The images were captured by a CoolSNAP HQ mono-chrome digital camera (Roper Scientific, Ottobrunn, Germany) and processed using MetaMorph software (Molecular Devices, Sunnyvale, CA, USA).
Analysis of lipid and hydrocarbon contents in B. braunii 779 cells
Total lipids and hydrocarbons were extracted using meth-anol/chloroform (2:1 by volume) and hexane solutions, respectively. In brief, cell samples taken from cultures at various time points were harvested by centrifuga-tion. The resulting cell pellet was resuspended in 0.5 ml
PBS buffer (10 mM Na2HPO4/1.8 mM K2PO4/137 mM
NaCl/2.7 mM KCl, pH7.4) and mixed with 0.5 g of the 0.5 mm acid-washed glass beads (Cat no. G2968, Sigma-Aldrich, St. Louis, MO, USA). Cells were subsequently broken by 6 bursts using a glass-bead beater (MP Bio-medicals). Each burst was set for 30 s and a 2-min inter-val was set between bursts. Broken cells were mixed with 10 volumes of methanol/chloroform (2:1 by volume) or hexane overnight. Organic phase was separated from cell debris and glass beads by centrifugation and transferred into a fresh tube. The tube was subsequently placed in a fume hood with a stream of nitrogen gas to evaporate the solvent. The resulting lipids or hydrocarbons were quan-tified gravimetrically using the AG204 balance (Mettler-Toledo Inc.).
The lipids were dissolved in chloroform at a
concentra-tion of 0.1 mg/μl. Equal amount of lipid was loaded on
silica TLC plate (60F254, Merck Corporate, Whitehouse Station, NJ, USA) and developed in hexane/diethyl ether/ acetic acid (35:15:0.1 by volume). TAG (tri-oleic acid (C18:1, [cis-9]) glyceride) and FFA (oleic acid (C18:1, [cis-9])) (Sigma-Aldrich, St. Louis, MO, USA) and oth-ers were used as standard. Lipid profile on TLC plate was visualized using iodine vapor. The hydrocarbons were
dissolved in hexane at a concentration of 0.1 mg/μl and
analyzed using Shimadzu GC/MS-QP2010 Plus system (Shimadzu, Kyoto, Japan) equipped with an HP-5 ms
Ultra Inert column (30 m × 0.25 mm × 0.25 μm, Agilent
Technologies, Santa Clara, CA, USA).
18S rDNA sequence‑based phylogenetic analysis
Primer sequences (CV1: 5′-TACCTGGTTGATCCTGC
CAGTAG-3′; CV2: 5′-CCAATCCCTAGTCGGCATCG