RESEARCH
Genome-wide landscape of position
effects on heterogeneous gene expression
in
Saccharomyces cerevisiae
Xiao‑Le Wu
1,2†, Bing‑Zhi Li
1,2†, Wen‑Zheng Zhang
1,2, Kai Song
1, Hao Qi
1,2, Jun‑biao Dai
3and Ying‑Jin Yuan
1,2*Abstract
Background: Integration of heterogeneous genes is widely applied in synthetic biology and metabolic engineering. However, knowledge about the effect of integrative position on gene expression remains limited.
Results: We established a genome‑wide landscape of position effect on gene expression in Saccharomyces cerevisiae. The expression cassette of red fluorescence protein (RFP) gene was constructed and inserted at 1044 loci, which were scattered uniformly in the yeast genome. Due to the different integrative loci on the genome, the maximum rela‑ tive intensity of RFP is more than 13‑fold over the minimum. Plots of the number of strains to RFP relative intensity showed normal distribution, indicating significant position effect on gene expression in yeast. Furthermore, changing the promoters or reporter genes, as well as carbon sources, revealed little consequences on reporter gene expression, indicating chromosomal location is the major determinant of reporter gene expression.
Conclusions: We have examined the position effects to integration genes expression in large number loci around whole genome in S. cerevisiae. The results could guide the design of integration loci for exogenous genes and path‑ ways to maximize their expression in metabolic engineering.
Keywords: Position effect, Genome, Gene expression, Synthetic biology, Yeast
© The Author(s) 2017. This article is distributed under the terms of the Creative Commons Attribution 4.0 International License (http://creativecommons.org/licenses/by/4.0/), which permits unrestricted use, distribution, and reproduction in any medium, provided you give appropriate credit to the original author(s) and the source, provide a link to the Creative Commons license, and indicate if changes were made. The Creative Commons Public Domain Dedication waiver (http://creativecommons.org/ publicdomain/zero/1.0/) applies to the data made available in this article, unless otherwise stated.
Background
Are genes scattered within the genome randomly? The answer is probably no. However, the pattern and under-ling principle of gene distribution remain largely elusive. The genomic locations of specific sequences are impor-tant for their regulatory functions [1], and it is reason-able that the genomic location of a coding sequence plays important roles on its expression. DNA sequences, such as promoters, enhancers, insulators and so on [2–4], are usually used as the common regulatory factors to control gene expression. The effect of genomic location will open another door to regulate gene expression.
For decades, regulation of the heterogeneous or homogenous gene expression is the key approach for biologists and bioengineers [5, 6]. In consideration of stability and efficiency of gene expression, chromosomal integration is preferred to episomal plasmid [7–9]. The structure of chromosome affects and regulates the cel-lular processes, including gene expression [10–12], DNA replication [13, 14] and transformation efficiency [15, 16]. The position effect refers to that the heterologous genes inserted at different loci of chromosomes presented various expression levels, which have been reported in Escherichia coli [17, 18], Salmonella typhimurium [19, 20], Bacillus subtilis [21], Lactobacillus lactis [22], Sac-charomyces cerevisiae [22–26], Drosophila melanogaster [27], mouse cells [28], and human cells [29].
In S. cerevisiae, the position effects on gene expression have drawn attention for decades due to its wide applica-tion. Flagfeldt et al. characterized 20 different integration sites using LacZ expression variation [24]. Thompson and
Open Access
*Correspondence: [email protected]
†Xiao‑Le Wu and Bing‑Zhi Li contributed equally to this work 1 Key Laboratory of Systems Bioengineering (Ministry of Education),
School of Chemical Engineering and Technology, Tianjin University, Tianjin 300072, People’s Republic of China
Gasson analyzed 18 loci and found a 14-fold expression variation due to different integrative loci [22]. The posi-tion effects on gene expression were also investigated in one chromosome [23, 25]. However, there are nearly 6000 genes distributed across 16 chromosomes in S. cer-evisiae genome. A systematic analysis the genome-wide landscape of position effect in S. cerevisiae is required. Chen used GFP to characterize the position effects at 482 different loci in the yeast genomic scale, approximately one third of which were on the chromosome (CHR) I and VI [26].
In this study, we characterized the position effects of 1044 uniformly scattered loci with red fluorescence pro-tein (RFP) as the reporter gene. It reveals the genome-scale landscape of position effect on gene expression, and provides new reference to control gene expression during genetic engineering in S. cerevisiae.
Results and discussion
Expression of RFP at different chromosome loci
In this study, RFP gene with URA3 promoter was inte-grated into deletion strains from the Yeast Knock-Out library by replacing the kanMX gene (Fig. 1a). To avoid the interference from the native promoter, CYC1 termi-nator was inserted upstream of the URA3 promoter to prevent the potential interruption from the native pro-moters or the read-through of the native terminators (Additional file 1: Figure S1). RFP, instead of green fluo-rescent protein (GFP), was used as the reporter, because GFP measurement is prone to be interrupted by auto-fluorescence of S. cerevisiae (Additional file 1: Figure S2). Compared with previous studies on position effects [24], variation of position effects on reporter gene expression was observed in this study.
To investigate the genomic landscape of position effects, 1044 loci were selected among 16 chromosomes and the interspace between two loci is about 12 kb. A list of selected locus was collected in the Additional file 1: Table S1. The relative fluorescence intensity was used to represent the expression level of each integrant (Addi-tional file 1: Table S2).
The strains with the reporter gene inserted in different locus exhibited distinct relative fluorescence intensities, ranging from 0.98 to 12.98 and divided into five groups according to the relative fluorescence intensity, including extreme high (blue), high (violet), moderate (green), low (yellow) and extreme low (red), as shown in Fig. 1b. The number of strains in each group was 91, 161, 410, 311 and 71, and the corresponding proportions were 8.7, 15.4, 39.3, 29.8 and 6.8%, respectively. The majority strains were allocated into the high, moderate and low groups, accounting for 84.5% of the entire library. However, the remaining two groups (extreme high and extreme low) caught our attention although they accounted for only 15.5%.
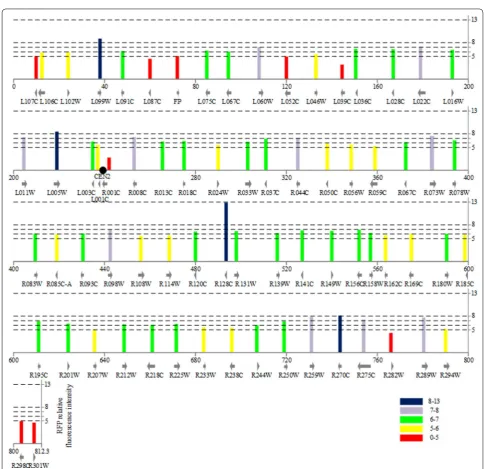
We compared the relative fluorescence intensity of strains with different integrative locus in 16 chromo-somes. The RFP relative fluorescence signals of 71 loci within CHR II were shown in Fig. 2. RFP expression at different positions varied significantly and the distribu-tion of RFP expression was roughly random except for the regions near the telomere and centromere. Similar results were also observed in other 15 chromosomes (Fig. 3). To further confirm this finding, we calculated the percentage of strains in the five groups for loci within the region of 20 kb flanking centromeres and 10 kb away from telomeres. Table 1 indicated that these loci are over-represented by lower relative fluorescence intensity
Fig. 1 Basic configuration of vectors and homologous recombination approach. a Targeted integration of RFP reporter gene cassette. b The num‑ bers of positions with different relative fluorescence intensities. Column color indicates relative fluorescence intensity. Red, yellow, green, violet and
(51.3%), while only 29.8% loci in the whole genome were at this level of intensity. Furthermore, no locus near the telomere and centromere exhibited extreme high rela-tive fluorescence intensity (Table 1). The result of the Chi-square consistency test was 51.26 which is much bigger than the corresponding threshold value (9.49, when α = 0.05, α is the significance level). Consequently, the null hypothesis was denied, which meant that the
distribution of the specific loci was independent from the distribution of the whole genome loci.
Loci with extreme high or extreme low gene expression levels
A total of 162 loci fell in extreme high or extreme low groups and were marked on the 16 chromosomes in Fig. 3. The locus with the highest expression level was Fig. 2 Region specificity on expression of pURA3‑RFP cassette at various positions on CHR II. Tag height is degree of relative fluorescence intensity.
YBR128C on CHR II with the relative fluorescence inten-sity of 12.98 and the loci exhibiting high expression level included YDR448W, YGR240C, YHR142W, YML059C, YPL014W, and YPR028W, which were distributed among the 16 chromosomes.
The loci with low gene expression were mostly restricted to the regions near the telomeres and centromeres. On the CHR XI, there are eight loci in the extreme low group but only one locus in the extreme high group. Moreover, the extreme low locus was lacking on CHR V.
Fig. 3 Region specificity on expression of pURA3‑RFP cassette at various positions on genome of S. cerevisiae. Tag height is degree of relative fluo‑ rescence intensity. Red and blue indicated extreme low (0–5) and extreme high (8–13), respectively. Centromere is located on the chromosome by a
solid dot. (The detail positions are in the Additional file 1: Table S4)
Table 1 Distributions of fluorescence intensities within the loci over all the whole genome and the loci near telomere and centromere (TEL/CEN)
Groups Genome (%) TEL/CEN
It was reported that the genome 3D structure affected gene expressions [30]. Among the loci identified here, 16 were overlapped with the top 88 loci with the high-est interaction frequencies. We found that all 16 loci were in the group of extreme low, low or moderate expression levels. The results suggested that the chromosome inter-actions in 3D chromosome conformation would affect position effect on gene expressions, and higher interac-tion frequencies could possibly reduce gene expression.
It is known that telomeres and centromeres could inhibit the expression of genes nearby [26], which is consistent with our finding that the reporters integrated near these regions have lower expression. On the other hand, it has been reported that the high gene expressions were related with the location near to autonomously replicating sequence (ARS) [24]. However, we found not all the reporter genes around ARS exhibited high level of expression, especially the ARS near the telomere and centromere. The influence discrepancy could due to the different effectiveness of various ARS in S. cerevisiae, as reported [31–33]. We further analyzed all the strains with the reporter gene at the loci near the high effec-tive ARS in CHR III and CHR VI according to previous studies [31–33], and no strains fell into the group of the extreme low (Table 2).
Robustness of the position effect
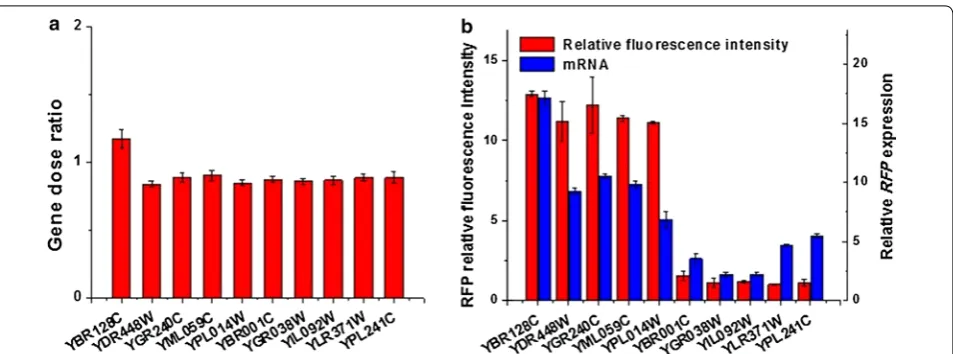
Gene expressions are affected by many factors, such as the gene copy number and the strength of promoter. To elim-inate the noise effects from copy number on gene expres-sion, we examined how many copies of reporter genes were inserted into the genome in ten selected strains, which included five strains with extreme high relative fluorescence intensity (YBR128C, YDR448W, YGR240C, YML059C and YPL014W) and five strains with extreme low relative fluorescence intensity (YBR001C, YGR038W, YIL092W, YLR371W and YPL241C). As Fig. 4a shows, the copy number of the reporter gene was all around 0.9. The corresponding standard deviation value was only 0.097 (<10% of the mean value), which meant the disper-sion of these values was very small. Therefore, the num-ber of reporter genes was not the reason for the different relative fluorescence intensities in these strains. The rela-tive fluorescence intensity was mainly due to the position effects.
The relative fluorescence was used to evaluate the rela-tive position effect on gene expression here. We next examined the amount of RNA transcripts of the reporter gene in ten strains. Results indicated that the five strains with extreme high relative fluorescence intensity also accumulated significantly more RNAs than the five strains with extreme low relative fluorescence intensity (Fig. 4b), despite that the difference was much smaller than that of relative fluorescence. The Pearson’s correla-tion coefficient between the relative fluorescence inten-sity and the corresponding RNA transcripts was as high as 0.85. When the Pearson’s correlation coefficient is big-ger than 0.5, it indicates a very strong positive linear rela-tionship between these two sets of values.
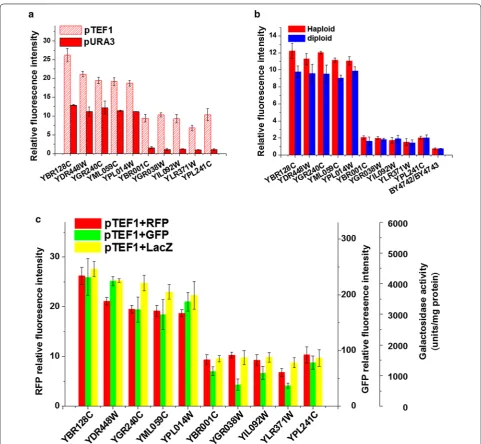
To evaluate the possibility that the position effects might be influenced by the expression level of the reporter gene, an alternative promoter pTEF1, was used to control the reporter gene instead of pURA3. As shown in Fig. 5a, although the variation of intensities among strains carrying pTEF1 was reduced, the pattern of rela-tive fluorescence intensities in these strains was similar to those with pURA3. The biggest difference on relative fluorescence intensity among the ten strains with pURA3 was 13.2-fold, whereas it was 3.9-fold among the strains with pTEF1. This result implied that with the increas-ing expression level of the reporter, the position effect still exists but its contribution was largely diminished in S. cerevisiae. Furthermore, we used Crisper-cas9 system in removing the marker gene (LEU2) which was neigh-bored the report gene. The result implied that the posi-tion effect was still robust in extreme high and extreme low group (Additional file 1: Figure S3).
In addition, besides RFP, two other reporter genes, GFP and LacZ, were applied to investigate the influence of Table 2 The relative fluorescence intensities of the
reporter gene integrated at the loci near the ARS on CHR III and CHR VI
ARS Loci Distance (bp) Relative fluorescence intensity
Groups
ARS305 YCL051W 1892 6.42 ± 0.16 Moderate YCL044C 7516 6.54 ± 0.26 Moderate ARS306 YCL027W 1117 7.38 ± 0.42 High
YCL025C 1341 5.99 ± 0.16 Low ARS307 YCL016C 12,964 7.05 ± 0.37 High
YCL005W Partial overlap 5.74 ± 0.47 Low ARS309 YCR004C 11,725 6.41 ± 0.22 Moderate
YCR010C 153 6.82 ± 0.51 Moderate ARS310 YCR024C‑A 3436 5.01 ± 0.29 Low
YCR027C 22 5.58 ± 0.26 Low ARS315 YCR051W 10,077 8.14 ± 0.12 Extreme high
YCR061W 502 5.08 ± 0.32 Low ARS319 YCR107W 1917 5.07 ± 0.59 Low ARS603 YFL036W 5922 8.70 ± 0.34 Extreme high
YFL033C 254 6.87 ± 0.06 Moderate ARS606 YFR006W 9795 5.27 ± 0.36 Low
YFR012W 87 5.57 ± 0.32 Low ARS607 YFR021W 3081 6.58 ± 0.45 Moderate
different reporter genes on position effect. As shown in Fig. 5c, the resulting pattern of position effect was similar among all three types of reporters, which indicated that position effect was not a consequence from a particular reporter.
The report genes were integrated into the knock-out yeast strains with genes deleted at different locus, which might cause the possibility that the position effects were partly resulted from the gene deletion. Ten heterozygote diploids were applied to determine the potential effects of the deleted genes. As shown in Fig. 5b, similar gene expression levels were observed between the haploid and diploid strains. Therefore, the reporter gene expression was not significantly affected by the gene deletion.
The Kullback–Leibler divergence values of the data in the three subplots in Fig. 5 were 0.07, 0.00 and 0.01, which meant that there was no information gained or lost using any set of samples. For example, in Fig. 5a, there was no information gained or lost using TEF1 or URA3 as promoters. In other words, the promoters had no effect on the relative fluorescence intensity here. Neither did the locus of deleted genes nor the reporter genes.
Furthermore, it is known that different carbon sources were often used for the biosynthesis of different chemi-cals in yeast, which requires the cells to shift the meta-bolic pathways to utilize these carbon sources. To investigate whether the position effect could also be affected by carbon sources, we characterized the RFP gene expression integrated into CHR II under different carbon sources. We found that the ratio of RFP expres-sion between glucose and glycerin fell within a narrow range 0.6–1.7, indicating that position effect is almost independent on carbon source (Additional file 1: Table S4).
Conclusions
Saccharomyces cerevisiae is also a model system for basic researches in life sciences. Different relative fluorescence intensities were observed depending on the integration sites, revealing the genomic landscape of position effects. The observations of position effect provide additional regulatory mechanism of gene expression. Besides the known regions such as telomere and centromere which could silence the adjacent genes, many other loci were identified. The mechanism how genes inserted within these loci are repressed remains unknown and further studies will be required. We also confirmed the robust-ness of the position effects by testing different promoters, reporter genes, and different carbon sources.
Methods Strains and media
All the strains with reporter genes were developed by homologous integration of the reporter genes (RFP) at different locus of kanMX cassettes in strains from Yeast Knock-Out (YKO) collection. The strains of YKO were grown in YPD (glucose 20 g/L, yeast extract 10 g/L, tryp-tone 20 g/L) with 200 μg/mL G418. The strains with reporter genes were grown in synthetic dextrose (SD) medium containing 6.7 g/L yeast nitrogen base without amino acids, 2 g/L complete supplement mixture (with-out histidine, leucine, tryptophan, uracil), 20 g/L glucose, 20 mg/L histidine, 20 mg/L tryptophan, and 20 mg/L uracil.
Construction of expression cassettes and reporter gene integration
The plasmid carrying the reporter gene was constructed on the basis of the plasmid pUC19, which included two homologous arms, kanMX-L and kanMX-R, reporter genes Fig. 4 Position effect occur at the level of transcription. a Copy numbers of the RFP gene at ten loci. b Relative fluorescence intensity and RFP
(RFP, GFP or LacZ) with promoters (pURA3 or pTEF1), and a screening gene LEU2 (Fig. 1a). The enzymatic sites sacI and BamHI were inserted to the ends of the cassette, respectively. The plasmid was digested by sacI and BamHI, and the DNA fragments with reporter genes were purified and used to the following transformation procedure.
Transformation protocol
The transformations were performed individually in 96-well plates [15, 34]. The 1044 selected strains from YKO were grown overnight in 150 μL of YPD with 200 μg/mL of G418 each deep. Ten microliters of strain
suspension from each strain were inoculated in 150 μL of YPD with 200 μg/mL of G418 in the plate-shaking incu-bator for 5 h. Cells were harvested by centrifugation at 4000g for 2 min and washed once with sterile water. Next, cells were re-suspended in 0.1 M LiAc (lithium acetate). Cells were harvested by centrifugation at 4000g for 2 min and were re-suspended in 40 μL 0.1 M LiAc. The trans-formation mix was added to each transtrans-formation reac-tion (each well): 124 μL 50% PEG, 40 μL 1 M LiAc, 10 μL boiled ss-carrier DNA (10 mg/mL) and 10 μL DNA frag-ment. The plate was incubated at 30 °C for 30 min, and 10 μL of DMSO (dimethyl sulfoxide) was add in each Fig. 5 The robustness of the position effect. a The influence of promoter on position effect. b The influence of gene deletion on position effect. c
transformation reaction, then the plate was heat shock at 42 °C for 30 min. Cells were harvested by centrifugation at 4000g for 5 min and washed once with 5 mM CaCl2
and water. After the transformation, cells were plated on SD-Leu plates, which were incubated for 2 days at 30 °C. The counter-selection and PCR were both used to con-firm the correct insertion of reporter genes in chromo-somes (PCR primers are in the Additional file 1: Table S5).
Fluorescence assays
The fluorescence assays were performed individually in 96-well plates which were black and optically clear. The selected strains with reporter gene were grown overnight in 150 μL SD-Leu each deep. 10 μL bacterial suspension from each strain were inoculated in 150 μL SD-Leu and incubated 5 h in the plate-shaking incubator. Cells were harvested by centrifugation at 4000g for 2 min and re-suspended in PBS (phosphate-buffered saline). RFP fluo-rescence at excitation wavelength 587 nm and emission wavelength 610 nm was measured by plate reader (Spec-traMax M2, molecular devices) [35, 36]. The excitation wavelength and emission wavelength of GFP fluores-cence are 485 and 510 nm [37–39]. The relative fluores-cence intensity was derived as fluoresfluores-cence/OD600.
Q‑PCR
Real-time PCR was carried out on a CFX96 Cycler real-time PCR detection system (Bio-Rad Laboratories, Inc., Hercules, CA, USA), in white-walled PCR plates (96 wells). A ready to use master-mix containing a fast proof-reading polymerase, dNTPs, stabilizers, MgCl2 and SYBR® Green dye was used according to the manufactur-er’s instructions (Bio-Rad). Reactions were prepared in a total volume of 18 μL containing 400 nM each primer (MWG), 2 × SsoAdvanced™ SYBR® Green Supermix (Bio-Rad) and 2 μL cDNA. The cycle conditions were set as follows: initial template denaturation at 95 °C for 3 min, followed by 40 cycles of denaturation at 95 °C for 10 s, and combined primer annealing/elongation at 57 °C for 20 s. The amount of fluorescence for each sample, given by the incorporation of SYBR® Green into dsDNA, was measured at the end of each cycle and analyzed via CFX Manager™ software 2.1 (Bio-Rad Laboratories, Inc.). The gene copies were represented by the expression level of RFP gene divided by that of ALG9 gene which performed as the internal reference gene [40].
β‑galactosidase activity assay
The β-galactosidase activity assay was performed individ-ually in 96-well plates and used the yeast β-galactosidase assay kit (Thermo). The β-galactosidase activities were normalized to the cell density and measured
in β-galactosidase activity according to the follow-ing equation: β-galactosidase activity = 1000 × A420/
(t × V × OD600). Where t represents the incubation time
in minutes and V represents the culture volume (mL) used in the assay [41, 42].
Mating
The reporter strains were constructed by replacing the kanMX of Yeast Knock-Out library (BY4742) with report gene (RFP). To exclude the gene deletion effect, we test the relative fluorescence intensity of diploid strains gen-erated by mating the reporter strain with the wild-type strain (BY4741), in which the corresponding gene was existed [43].
Kullback–Leibler divergence
For discrete probability distributions P and Q, in the context of machine learning, the Kullback–Leibler diver-gence DKL(P||Q) is often called the information gain
achieved if P is used instead of Q [44, 45]. The smallest limit of it is 0. The smaller its value is, the smaller the gain or loss can get using Q instead of P. If we consider the percentage of a sample’s value to the sum of the val-ues of all samples in the same set as the contribution of that sample, we can use the Kullback–Leibler divergence to evaluate the information gain or loss between two sample sets. Because the Kullback–Leibler divergence is not symmetric, that is, DKL(P||Q) ≠ DKL(Q||P), we used
DKL = (DKL(P||Q) +DKL(Q||P))/2.
Abbreviations
S. cerevisiae: Saccharomyces cerevisiae; RFP: red fluorescence protein; CHR: chromosome; TEL: telomere; CEN: centromere.
Authors’ contributions
XLW, WZZ, performed the experiments. YJY, BZL, KS, HQ, JBD, and XLW con‑ ceived the project and wrote the manuscript. All authors read and approved the final manuscript.
Author details
1 Key Laboratory of Systems Bioengineering (Ministry of Education), School
of Chemical Engineering and Technology, Tianjin University, Tianjin 300072, People’s Republic of China. 2 SynBio Research Platform, Collaborative Innova‑
tion Center of Chemical Science and Engineering (Tianjin), Tianjin University, Tianjin 300072, People’s Republic of China. 3 Key Laboratory of Industrial
Biocatalysis (Ministry of Education) and Center for Synthetic and Systems Additional file
Additional file 1: Figure S1. Influence of the CYC1 terminator. Figure S2. Relative fluorescence intensities of the GFP and RFP at the same locus.
Figure S3. The influence of marker gene on position effect. Table S1.
Number of integrative loci of each chromosome. Table S2. The relative fluorescence intensity of 1044 loci. Table S3. Fit curve of the distribution of the numbers of positions with different relative fluorescence intensities.
Table S4. The position effect of the loci with extreme low and extreme
Biology, School of Life Sciences, Tsinghua University, Beijing 100084, People’s Republic of China.
Acknowledgements
The authors are grateful for the financial support from the Ministry of Sci‑ ence and Technology of China (“973”Program: 2014CB745100, international cooperative program: 2015DFA00960), and the National Natural Science Foun‑ dation of China (21390203, 21576198, 21622605), and the Tianjin Municipal Science and Technology Committee (No. 13RCGFSY19800). We thank Professor Ping‑sheng Ma for the constructive discussion.
Competing interests
The authors declare that they have no competing interests.
Availability of supporting data
Data will be made available from the corresponding author on reasonable request.
Funding
The Ministry of Science and Technology of China (“973”Program: 2014CB745100, international cooperative program: 2015DFA00960).
The National Natural Science Foundation of China (21390203, 21576198, 21622605).
The Tianjin Municipal Science and Technology Committee (No. 13RCGFSY19800).
Publisher’s Note
Springer Nature remains neutral with regard to jurisdictional claims in pub‑ lished maps and institutional affiliations.
Received: 26 January 2017 Accepted: 11 July 2017
References
1. Babarinde IA, Saitou N. Genomic locations of conserved noncoding sequences and their proximal protein‑coding genes in mammalian expression dynamics. Mol Biol Evol. 2016;33(7):1807–17.
2. Teng D, Xi D, Zhang J, Wang XM, Mao RY, Zhang Y, Wang JH. Multiple cop‑ ies of the target gene enhances plectasin secretion in Pichia pastoris X‑33. Process Biochem. 2015;50(4):553–60.
3. Lee ME, Aswani A, Han AS, Tomlin CJ, Dueber JE. Expression‑level optimi‑ zation of a multi‑enzyme pathway in the absence of a high‑throughput assay. Nucleic Acids Res. 2013;41(22):10668–78.
4. Sun J, Shao Z, Zhao H, Nair N, Wen F, Xu JH, Zhao H. Cloning and characterization of a panel of constitutive promoters for applications in pathway engineering in Saccharomyces cerevisiae. Biotechnol Bioeng. 2012;109(8):2082–92.
5. Xu P, Vansiri A, Bhan N, Koffas MA. ePathBrick: a synthetic biology platform for engineering metabolic pathways in E. coli. ACS Synth Biol. 2012;1(7):256–66.
6. Lian J, Zhao H. Reversal of the beta‑oxidation cycle in Saccharomy-ces cerevisiae for production of fuels and chemicals. ACS Synth Biol. 2014;4(3):332–41.
7. Futcher B, Carbon J. Toxic effects of excess cloned centromeres. Mol Cell Biol. 1986;6(6):2213–22.
8. Som T, Armstrong KA, Volkert FC, Broach JR. Autoregulation of 2 micron circle gene expression provides a model for maintenance of stable plas‑ mid copy levels. Cell. 1988;52(1):27–37.
9. Schaerer‑Brodbeck C, Barberis A. Coupling homologous recombination with growth selection in yeast: a tool for construction of random DNA sequence libraries. Biotechniques. 2004;37(2):202–6.
10. Sekinger EA, Moqtaderi Z, Struhl K. Intrinsic histone‑DNA interactions and low nucleosome density are important for preferential accessibility of promoter regions in yeast. Mol Cell. 2005;18(6):735–48.
11. Lam FH, Steger DJ, O’Shea EK. Chromatin decouples promoter threshold from dynamic range. Nature. 2008;453(7192):246–50.
12. Tirosh I, Barkai N. Two strategies for gene regulation by promoter nucle‑ osomes. Genome Res. 2008;18(7):1084–91.
13. Bhutani K, Nazor KL, Williams R, Tran H, Dai H, Dzakula Z, Cho EH, Pang AW, Rao M, Cao H, et al. Whole‑genome mutational burden analysis of three pluripotency induction methods. Nat Commun. 2016;7:10536. 14. Eaton ML, Galani K, Kang S, Bell SP, MacAlpine DM. Conserved
nucleosome positioning defines replication origins. Genes Dev. 2010;24(8):748–53.
15. Aslankoohi E, Voordeckers K, Sun H, Sanchez‑Rodriguez A, van der Zande E, Marchal K, Verstrepen KJ. Nucleosomes affect local transformation efficiency. Nucleic Acids Res. 2012;40(19):9506–12.
16. Baumann M, Mamais A, McBlane F, Xiao H, Boyes J. Regulation of V (D) J recombination by nucleosome positioning at recombination signal sequences. EMBO J. 2003;22(19):5197–207.
17. Sousa C, de Lorenzo V, Cebolla A. Modulation of gene expression through chromosomal positioning in Escherichia coli. Microbiology. 1997;143(6):2071–8.
18. Bryant JA, Sellars LE, Busby SJ, Lee DJ. Chromosome position effects on gene expression in Escherichia coli K‑12. Nucleic Acids Res. 2014;42(18):11383–92.
19. Pavitt GD, Higgins CF. Chromosomal domains of supercoiling in Salmo-nella typhimurium. Mol Microbiol. 1993;10(3):685–96.
20. Schmid MB, Roth JR. Gene location affects expression level in Salmonella typhimurium. J Bacteriol. 1987;169(6):2872–5.
21. Sauer C, Syvertsson S, Bohorquez LC, Cruz R, Harwood CR, van Rij T, Hamoen LW. Effect of genome position on heterologous gene expression in Bacillus subtilis: an unbiased analysis. ACS Synth Biol. 2016;5(9):942–7. 22. Thompson A, Gasson MJ. Location effects of a reporter gene on expres‑
sion levels and on native protein synthesis in Lactococcus lactis and Saccharomyces cerevisiae. Appl Environ Microbiol. 2001;67(8):3434–9. 23. Yamane S, Yamaoka M, Yamamoto M, Maruki T, Matsuzaki H, Hatano
T, Fukui S. Region specificity of chromosome III on gene expres‑ sion in the yeast Saccharomyces cerevisiae. J General Appl Microbiol. 1998;44(4):275–81.
24. Flagfeldt DB, Siewers V, Huang L, Nielsen J. Characterization of chromo‑ somal integration sites for heterologous gene expression in Saccharomy-ces cerevisiae. Yeast. 2009;26(10):545–51.
25. Chen M, Licon K, Otsuka R, Pillus L, Ideker T. Decoupling epigenetic and genetic effects through systematic analysis of gene position. Cell Rep. 2013;3(1):128–37.
26. Chen X, Zhang J. The genomic landscape of position effects on protein expression level and noise in yeast. Cell Syst. 2016;2(5):347–54. 27. Markstein M, Pitsouli C, Villalta C, Celniker SE, Perrimon N. Exploiting
position effects and the gypsy retrovirus insulator to engineer precisely expressed transgenes. Nat Genet. 2008;40(4):476–83.
28. Akhtar W, de Jong J, Pindyurin AV, Pagie L, Meuleman W, de Ridder J, Berns A, Wessels LF, van Lohuizen M, van Steensel B. Chromatin position effects assayed by thousands of reporters integrated in parallel. Cell. 2013;154(4):914–27.
29. Gierman HJ, Indemans MH, Koster J, Goetze S, Seppen J, Geerts D, van Driel R, Versteeg R. Domain‑wide regulation of gene expression in the human genome. Genome Res. 2007;17(9):1286–95.
30. Duan Z, Andronescu M, Schutz K, McIlwain S, Kim YJ, Lee C, Shendure J, Fields S, Blau CA, Noble WS. A three‑dimensional model of the yeast genome. Nature. 2010;465(7296):363–7.
31. Poloumienko A, Dershowitz A, De J, Newlon CS. Completion of replica‑ tion map of Saccharomyces cerevisiae chromosome III. Mol Biol Cell. 2001;12(11):3317–27.
32. Yamashita M, Hori Y, Shinomiya T, Obuse C, Tsurimoto T, Yoshikawa H, Shirahige K. The efficiency and timing of initiation of replication of mul‑ tiple replicons of Saccharomyces cerevisiae chromosome VI. Genes Cells. 1997;2(11):655–65.
33. Shirahige K, Iwasaki T, Rashid MB, Ogasawara N, Yoshikawa H. Location and characterization of autonomously replicating sequences from chro‑ mosome VI of Saccharomyces cerevisiae. Mol Cell Biol. 1993;13(8):5043–56. 34. Schiestl RH, Gietz RD. High efficiency transformation of intact yeast
cells using single stranded nucleic acids as a carrier. Curr Genet. 1989;16(5–6):339–46.
• We accept pre-submission inquiries
• Our selector tool helps you to find the most relevant journal
• We provide round the clock customer support
• Convenient online submission
• Thorough peer review
• Inclusion in PubMed and all major indexing services
• Maximum visibility for your research
Submit your manuscript at www.biomedcentral.com/submit
Submit your next manuscript to BioMed Central
and we will help you at every step:
36. Bevis BJ, Glick BS. Rapidly maturing variants of the Discosoma red fluores‑ cent protein (DsRed). Nat Biotechnol. 2002;20(1):83–7.
37. Cormack BP, Bertram G, Egerton M, Gow NA, Falkow S, Brown AJ. Yeast‑ enhanced green fluorescent protein (yEGFP): a reporter of gene expres‑ sion in Candida albicans. Microbiology. 1997;143(2):303–11.
38. Zordan RE, Ren YX, Pan SJ, Rotondo G, De Las Penas A, Iluore J, Cormack BP. Expression plasmids for use in Candida glabrata. G3‑Genes Genomes Genet. 2013;3(10):1675–86.
39. Baruffini E, Serafini F, Lodi T. Construction and characterization of centro‑ meric, episomal and GFP‑containing vectors for Saccharomyces cerevisiae prototrophic strains. J Biotechnol. 2009;143(4):247–54.
40. Livak KJ, Schmittgen TD. Analysis of relative gene expression data using real‑time quantitative PCR and the 2(T)(−Delta Delta C) method. Meth‑ ods. 2001;25(4):402–8.
41. Rose M, Casadaban MJ, Botstein D. Yeast genes fused to beta‑galactosi‑ dase in Escherichia coli can be expressed normally in yeast. Proc Natl Acad Sci USA. 1981;78(4):2460–4.
42. Rose M, Botstein D. Construction and use of gene fusions to lacZ (beta‑galactosidase) that are expressed in yeast. Methods Enzymol. 1983;101:167–80.
43. Lindegren CC, Lindegren G. A new method for hybridizing yeast. Proc Natl Acad Sci USA. 1943;29(10):306–8.
44. Yu C, Baune BT, Licinio J, Wong ML. Whole‑genome single nucleotide variant distribution on genomic regions and its relationship to major depression. Psychiatry Res. 2017;252:75–9.