T
T
h
h
e
e
r
r
a
a
n
n
o
o
s
s
t
t
i
i
c
c
s
s
2017; 7(16): 3989-4000. doi: 10.7150/thno.21630 Research Paper
Acute Inflammatory Response Following Increased
Blood-Brain Barrier Permeability Induced by Focused
Ultrasound is Dependent on Microbubble Dose
Dallan McMahon1, 2 and Kullervo Hynynen1, 2, 3
1. University of Toronto, Department of Medical Biophysics, Toronto, M4N 3M5, Canada; 2. Sunnybrook Research Institute, Toronto, M4N 3M5, Canada;
3. University of Toronto, Institute of Biomaterials and Biomedical Engineering, Toronto, M5S 3G9, Canada.
Corresponding author: email: dallan.mcmahon@mail.utoronto.ca
© Ivyspring International Publisher. This is an open access article distributed under the terms of the Creative Commons Attribution (CC BY-NC) license (https://creativecommons.org/licenses/by-nc/4.0/). See http://ivyspring.com/terms for full terms and conditions.
Received: 2017.06.26; Accepted: 2017.08.10; Published: 2017.09.15
Abstract
Rationale: Focused ultrasound (FUS), in conjunction with circulating microbubbles (MBs), can be used to transiently increase the permeability of the blood-brain barrier (BBB) in a targeted manner, allowing therapeutic agents to enter the brain from systemic circulation. While promising preclinical work has paved the way for the initiation of 3 human trials, there remains concern regarding neuroinflammation following treatment. The aim of this study was to assess the magnitude of this response following sonication and explore the influence of MB dose.
Methods: Differential expression of NFκB signaling pathway genes was assessed in rats at 6 h and 4 days following a FUS-mediated increase in BBB permeability. Three sonication schemes were tested: (1) a clinical imaging dose of MBs + peak negative pressure (PNP) controlled by acoustic feedback, (2) 10x clinical imaging dose of MBs + constant PNP of 0.290 MPa, and (3) 10x clinical imaging dose of MBs + PNP controlled by acoustic feedback. Follow-up magnetic resonance imaging (MRI) was performed to assess edema and hemorrhage. Hematoxylin and eosin histology was used to evaluate general tissue health.
Results: MB dose has a significant impact on the expression of several key genes involved in acute inflammation and immune activation, including Tnf, Birc3, and Ccl2. At a clinical imaging dose of MBs, there were no significant changes detected in the expression of any NFκB signaling pathway genes. Conversely, a high MB dose resulted in a clear activation of the NFκB signaling pathway, accompanied by edema, neuronal degeneration, neutrophil infiltration, and microhemorrhage. Results also suggest that post-FUS gadolinium enhancement may hold predictive value in assessing the magnitude of inflammatory response.
Conclusion: While a significant and damaging inflammatory response was observed at high MB doses, it was demonstrated that FUS can be used to induce increased BBB permeability without an associated upregulation of NFκB signaling pathway gene expression. This emphasizes the importance of employing optimized FUS parameters to mitigate the chances of causing injury to the brain at the targeted locations.
Key words: focused ultrasound, blood-brain barrier, inflammation, microbubbles.
Introduction
There exists a pressing need for methods of delivering therapeutic agents to the brain [1]. FUS, in conjunction with intravenous MB administration, can be used to produce transient and targeted increases in BBB permeability [2], allowing therapeutic agents in systemic circulation to be delivered to the desired locations. Given the variety of agents that have been shown to cross the BBB following FUS [3–11], as well
as the positive therapeutic effects observed [7, 8, 12–14], this technique has the potential to have widespread impact on the way neuropathologies are treated. With a large body of promising preclinical work demonstrating safety and efficacy, FUS has entered 3 human trials (ClinicalTrials.gov identifiers: NCT02343991, NCT02986932, NCT03119961).
While FUS can be employed to increase BBB
Ivyspring
permeability with minimal short- and no evidence of long-term negative impacts on brain health, its safety profile is highly dependent on the use of optimized parameters. Currently, there exists a wide range in the transducer frequencies, PNPs, MB doses, MB compositions, acoustic control methods, etc., employed in preclinical FUS research. This has contributed to conflicting conclusions regarding the safety profile of the technique.
Kovacs et al. have recently reported an
immediate damage-associated molecular pattern following FUS leading to a sterile inflammatory response in brain parenchyma [15]. While increased gadolinium enhancement was reported in the targeted locations, the MB dose administered was approximately 10x higher than the dose used for clinical imaging [16] (0.1 ml Optison/rat; ~0.5 ml/kg, based on the reported age and sex of rats). This dose of Optison has previously been shown to induce significant tissue damage when used in conjugation with FUS [6]. Thus, it is possible that the FUS parameters used in this study contributed to an exaggerated inflammatory response, inconsistent with that seen when optimized parameters are employed. One of the aims of the current study was to explore how FUS changes the expression of genes related to the NFκB signaling pathway and to assess how MB dose can influence this response.
In addition to assessing its effects on the NFκB signaling pathway, this work explores how MB dose can influence the function of an acoustic feedback algorithm that calibrates PNP based on ultraharmonic emissions. As the PNP of sonication increases, there is a point at which a significant portion of MBs shift from oscillating with spherical symmetry to having non-spherical oscillations. This shift in MB behaviour presents as a peak in acoustic emissions at sub- and ultraharmonic frequencies. While controlling PNP based on these signals has been shown to produce more consistent and safe FUS-mediated increases in BBB permeability [17], the influence of MB dose on the effectiveness of this approach is under explored.
Methods
Animals
Eight male Sprague-Dawley rats (Taconic Biosciences, Germantown, NY, USA), weighing 270-340 g at the time of sonication, were evenly divided into two groups. Group 1 and 2 rats were sacrificed at 6 h and 4 days post-FUS, respectively. Animals were housed in the Sunnybrook Research Institute animal facility (Toronto, ON, Canada) and had access to food and water ad libitum. All animal procedures were approved by the Animal Care
Committee at Sunnybrook Research Institute and are in accordance with the guidelines established by the Canadian Council on Animal Care.
MRI-Guided FUS
To prepare animals for the FUS procedure, anesthesia was induced with isoflurane (5% at 1 L/min with oxygen), hair overlaying the skull was removed with depilatory cream, and a 22-gauge catheter was placed in the tail vein. Anesthesia was maintained with isoflurane (1-2% at 1 L/min with medical air). For the duration of the FUS procedure and subsequent imaging, animals were secured in a supine position on an MRI-compatible sled. The top of the skull was coupled to a polyimide membrane with ultrasound gel. Body temperature was maintained with heated saline bags.
MRI-guided FUS was performed using an RK100 system (FUS Instruments Inc., Toronto, ON, Canada) equipped with a spherically focused transducer (focal number = 0.8, external diameter = 75 mm, internal diameter = 20 mm, frequency = 551.5 kHz). The transducer, calibrated using a planar fiber optic hydrophone with an active tip diameter of 10 μm (Precision Acoustics Ltd., Dorset, UK), was situated in a tank of degassed, deionized water and its movement controlled with a motorized positioning system (3 degrees of freedom). To allow ultrasound propagation from the transducer to the brain, the bottom of the polyimide membrane was coupled to the water tank below. Targets of sonication were chosen in RK100 software from T2-weighted (T2w) MR images following coregistration of the FUS positioning system spatial coordinates to that of a 7-Tesla MRI scanner (BioSpin 7030, Bruker, Billerica, MA, USA). Three locations were sonicated per animal, each with a different sonication scheme. The three sonications were separated in time by approximately 15 min to allow MBs to clear from circulation [18, 19]. A description of FUS parameters used for each scheme is found in Table 1. To mitigate the variance between different regions of the brain, the schemes were rotated around the 4 target regions (Figure 2A) within each group. At the commencement of sonication, MBs (Definity, Lantheus Medical Imaging, North Billerica, MA, USA) diluted in saline, were administered via tail vein catheter using an infusion pump (120 μL/min).
the ratio of signal above baseline at the first or second ultraharmonic frequency passed 3.5, the sonicating pressure was dropped by 50% and maintained at this level for the remainder of sonication. This algorithm is designed to calibrate pressure based on in vivo MB response, producing a more consistent and safe treatment, as previously demonstrated [17]. Animals in groups 1 and 2 were sacrificed at 6 h and 4 days post-sonication, respectively, by transcardial perfusion with ice-cold saline. Brains were snap frozen in liquid nitrogen and stored at -80 °C until processing.
Follow-up MRI Assessment
Immediately prior to each sonication, a gadolinium-based contrast agent (Gadovist, Schering AG, Berlin, Germany) was injected into venous circulation via tail vein catheter. By delivering the contrast agent prior to FUS, changes in BBB permeability that occur during sonication are also measured. For the duration between each sonication, approximately 15 min, 3-4 T1-weighted (T1w) scans were performed. Contrast enhancement was assessed for each sonication scheme by normalizing mean voxel intensity at the focus to the non-sonicated control region. To assess edema and hemorrhage, T2w and T2*w scans, respectively, were performed at 4 h post-FUS for group 1 and at both 4 h and 4 days post-FUS for group 2. MRI parameters can be found in
Table 2.
Sample Collection and Preparation
Brains were horizontally cryosectioned (10 μm) and freeze-mounted onto nuclease and nucleic acid free MembraneSlide NF 1.0 PEN slides (Zeiss, Göttingen, Germany). Sections were collected every 250 μm throughout the thickens of the brain. Mounted sections were stored up to 3 days at -80 °C before laser capture microdissection (LCM). Immediately prior to LCM, sections were briefly dehydrated in ethanol (ice-cold 95% for 30 s, ice-cold 100% for 30 s, and room temperature 100% for 30 s) and cleared in xylenes (twice at room temperature for 30 s). Sections were allowed to dry for 5 min prior to LCM.
Tissue was collected by LCM from sections at the focal plane of FUS targeting using a PALM Microbeam system (Zeiss, Göttingen, Germany). Contrast-enhanced T1w MR images were used as a
guide for tissue selection. Approximately 30 000 000
μm3 of tissue was collected from each targeted
location (plus a non-sonicated control region in each animal) into AdhesiveCap 500 microcentrifuge tubes (Zeiss, Göttingen, Germany), yielding 9–15 ng of total RNA per sample. Collection times were limited to 1 h to minimize the degree of RNA degradation.
RNA isolation proceeded using the PicoPure kit (Life Technologies Inc., Waltham, MA, USA) according to the manufacturer’s instructions. Samples were treated with DNase (Qiagen, Hilden, Germany). RNA concentration and quality was assessed using the 2100 Bioanalyzer system with RNA 6000 Pico Kit (Agilent, Santa Clara, CA, USA).
qRT-PCR Array
Synthesis and amplification of cDNA was
performed using the RT2 PreAMP cDNA Synthesis
Kit (Qiagen, Hilden, Germany). RT2 SYBR Green
qPCR Master Mix (Qiagen, Hilden, Germany) was used in conjunction with CFX96 Touch Real-Time PCR Detection System (Bio-Rad Laboratories, Inc., Hercules, CA, USA) for quantitative real-time polymerase chain reaction (qRT-PCR). The expression of 84 genes related to inflammatory response and apoptosis were screened with RT2 Profiler PCR Array Rat NFκB Signaling Pathway (Qiagen, Hilden, Germany). Relative gene expression of each transcript was determined by normalizing against the mean Ct value of 5 housekeeping genes (Actb, B2m, Hprt1, Ldha, and Rplp1), using the ΔΔCt method. Within each animal, log2 fold change for each sonication scheme was calculated relative to the non-sonicated control region.
Histology
Sections adjacent to those collected for LCM were freeze-mounted onto X-tra glass slides (Leica Microsystems GmbH, Wetzlar, Germany) and stored at -80 °C until processing. Hematoxylin and eosin staining was used to broadly assess tissue health in each brain from groups 1 and 2. Tissue sections from the focal plane of FUS were imaged with a 20x objective (Axios Imager 2, Zeiss, Göttingen, Germany); post-FUS contrast-enhanced T1w MR images were used to locate targeted areas. All histological images were assessed by DM.
Table 1. FUS parameters used for each sonication scheme
Scheme MB Dose (μl Definity/kg) PNP (MPa) Pulse Repetition Frequency (Hz) Pulse Length (ms) Sonication Duration (s)
1 10 acoustic controller used 1 10 120
2 100 0.290 1 10 120
Table 2. MRI parameters
Parameter T1w T2w T2*w
Sequence type RARE RARE GEFC Echo time (ms) 10 70 19 Repetition time (ms) 500 4000 1043.9
RARE factor 2 10 NA
Averages 3 4 4
Field of view (mm) 50 x 50 50 x 50 30 x 30 Matrix 150 x 150 200 x 200 150 x 150 Slice thickness (mm) 1.5 1.5 1.0
Statistics
Fold changes in gene expression for each sonication scheme were calculated relative to the non-sonicated control region within each animal. Log2 transformed fold changes for each sonication scheme were assessed for statistical significance with one-way, repeated measures, ranked analysis of
variance (ANOVA) and post-hoc one-sample (μ=1),
two-tailed, student’s t-tests. Least-squares linear regression was used to assess the relationship between log2 fold changes in gene expression and mean voxel intensity at each target (normalized to control region) in the final T1w MR image for each
animal. For all analyses, an alpha of 0.05 was used as the threshold for statistical significance.
Results
Ultraharmonic Acoustic Emissions Independent of MB Dose
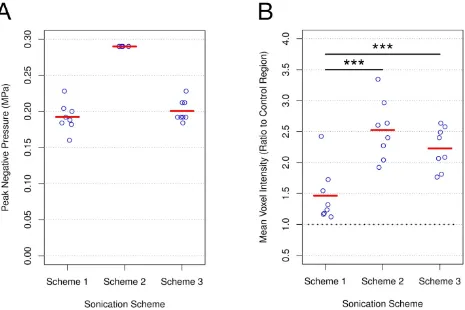
PNP for schemes 1 and 3 (Figure 1A) were
calibrated based on acoustic emissions at the first and second ultraharmonic frequencies. Once the ratio of signal above baseline at either of these frequencies passed 3.5, the PNP was dropped by 50% and maintained at this level for the remainder of sonication. While the MB dose for schemes 1 and 3 differed by an order of magnitude (10 μl/kg vs 100 μl/kg), the PNP required for the ratio of signal above baseline at the first or second ultraharmonic to surpass the threshold of 3.5 was not significantly different (scheme 1: 0.192 MPa ± 0.020 MPa; scheme 3: 0.201 MPa ± 0.015 MPa; p = 0.460). This result suggests that at a sonicating frequency of 551 kHz and for this MB dose range, the PNP required for acoustic emissions at the frequencies monitored to reach threshold is independent of the MB dose.
Post-FUS Gadolinium Enhancement Influenced by MB Dose
Post-FUS T1w MR images were used to assess gadolinium enhancement for each sonication scheme by normalizing mean voxel intensity at the focus to
the non-sonicated control region (Figure 1B).
Enhancement relative to control was greatest for scheme 2 (2.52 ± 0.47), exhibiting a significantly greater degree of enhancement than scheme 1 (1.46 ± 0.44; p = 0.002). While schemes 1 and 3 both utilized acoustic emissions feedback to control PNP, scheme 3 resulted in a significantly greater degree of enhancement relative to control (2.23 ± 0.34 vs 1.46 ± 0.44; p = 0.003). Given the similarity in mean PNP for schemes 1 and 3, as well as the difference in mean T1w contrast enhancement between these schemes, these results suggest that at a sonicating frequency of
551 kHz, MB dose has a significant effect on BBB permeability.
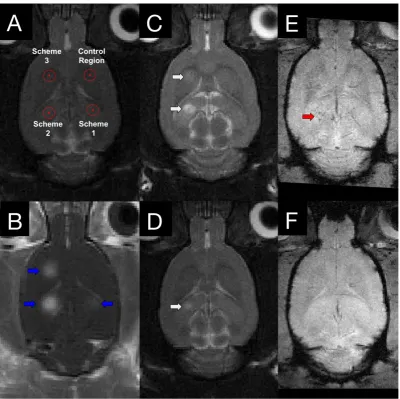
Edema and Microhemorrhage Seen in Follow-Up MRI
T2w and T2*w MR images were acquired for all animals at 4 h post-FUS and in group 2 animals at 4 days post-FUS (Figure 2). Edema was evident on T2w images in 0/8, 6/8, and 4/8 animals for schemes 1, 2, and 3, respectively, at 4 h following sonication. Only one animal displayed edema at 4 days post-FUS, in a
location sonicated with scheme 2 (Figure 2D).
Microhemorrhage, as indicated by hypointense regions on T2*w images, was observed in one animal at 4 h and no animals at 4 days following sonication. The one region of microhemorrhage was observed at a target sonicated with scheme 2 and was the same region that displayed edema 4 days post-FUS (Figure
2E).
MB Dose Influences the Expression of Inflammatory Genes Following FUS
Overall shifts in gene expression, relative to non-sonicated control regions in each animal, are depicted for each sonication scheme and grouped as
volcano plots in Figure 3. At 6 h following FUS,
schemes 2 and 3 resulted in a marked skew towards increased expression of NFκB signaling pathway genes, with the relative levels of several transcripts significantly upregulated. This pattern is also seen at 4 days in locations sonicated with these schemes, albeit less dramatic. Conversely, for scheme 1, at both 6 h and 4 days post-FUS, differences in gene expression relative to control are much less evident; differential expression levels are evenly distributed around 0 in the x direction (log2 fold change) and below the threshold for significance (p < 0.05 and log2 fold change greater or less than 1.0 or −1.0, respectively).
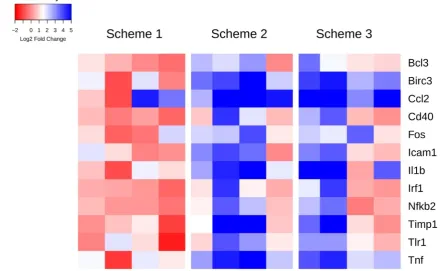
Specific genes whose expression at 6 h post-FUS in any scheme are significantly different than in the non-sonicated control regions (as assessed by
one-way, repeated measures, ranked ANOVAs), are
displayed per animal in Figure 4. A heat map
representation of this data illustrates a pattern of significant upregulation for schemes 2 and 3, with scheme 1 remaining relatively stable around no change in expression. The log2 fold change values relative to control and p-values for these genes can be
found in Table 3. Amongst the genes exhibiting
significant differences for both schemes 2 and 3 include Birc3, Ccl2, and Tnf, all have established roles in inflammatory signaling and apoptosis.
While there appears to be a trend towards increased expression of NFκB signaling pathway genes in locations sonicated with schemes 2 and 3 at 4 days post-FUS (evidenced by a skew towards positive log2 fold changes, Figure 3), no significance was detected in the expression of any single gene. A complete list of log2 fold change values relative to control and p-values for all genes assessed at 6 h and 4
days post-FUS can be found in Supplementary
Tables 1 and 2, respectively.
Figure 4. Heat map of genes displaying significant changes in expression relative to control regions 6 h post-FUS. Log2 fold changes in gene expression relative to control are depicted per animal for each sonication scheme. Statistically significant differences in expression compared to control were detected by one-way, repeated measures, ranked ANOVA for each gene displayed.
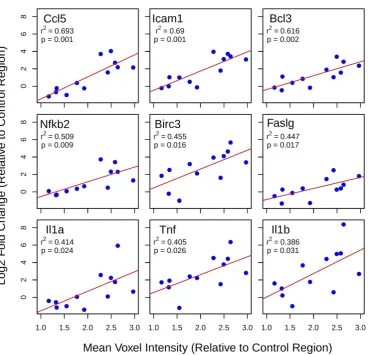
Correlation of Gadolinium Enhancement and Differential Gene Expression
Least-squares linear regression was used to assess the relationship between log2 fold changes in gene expression at 6 h post-FUS and mean voxel intensity at each target, both normalized within each animal to the non-sonicated control region (Figure 5). For several genes with established roles in acute inflammatory response and apoptosis, such as Ccl5, Faslg, Tnf, and Il1b, there is a significant positive correlation between changes in expression and gadolinium enhancement. The same analysis for group 2 suggests that gadolinium enhancement has little predictive value for changes in the expression of NFκB signaling pathway genes 4 days post-FUS (data not shown).
Histological Observations
Hematoxylin and eosin staining was used to broadly assess tissue health in each brain from groups 1 and 2. At locations that were sonicated with scheme
1 (Figure 6D), no evidence of extravasated red blood
cells (RBCs) or leukocytes was observed, nor any signs of widespread neuronal degeneration (eosinophilic neurons) or gliosis at 6 h or 4 days following FUS. Sonication with schemes 2 and 3 resulted in regions of RBC extravasation and granular
leukocyte infiltration at 6 h and evidence of widespread neuronal degeneration and gliosis at 4 days post-FUS. There were also microglial nodules
present 4 days after FUS (Figure 6B) in several
locations sonicated with scheme 2, indicating small foci of necrotic brain tissue. A summation of localized RBC extravasations, granular leukocyte infiltration, and microglial nodules at the focal plane for each sonication scheme at 6 h and 4 days following FUS is presented in Table 4.
Table 3. Genes displaying significant changes in expression relative to control regions 6 h post-FUS
Gene
Figure 5. Linear regression analysis of post-FUS gadolinium enhancement and differential gene expression. Least-squares linear regression was used to assess the relationship between log2 fold changes in gene expression at 6 h post-FUS and mean voxel intensity at each target (normalized to control region) in contrast-enhanced T1w MR images for each animal. Significant positive correlations were detected for 9 genes with well-established roles in acute inflammation and immune activation.
Discussion
The aim of this study was to explore how a FUS-mediated increase in BBB permeability changes the expression of genes related to the NFκB signaling pathway and to assess how MB dose can influence this response. A significant upregulation of genes associated with acute inflammation, immune response, and apoptotic processes, such as Tnf, Ccl2, and Birc3, was observed when the MB dose administered during sonication was 10x that recommended for clinical imaging. This response was accompanied by MRI evidence of edema and histological indications of neuronal degeneration, leukocyte infiltration, and microhemorrhage. Conversely, when the recommended MB dose for clinical imaging was administered prior to FUS, minimal changes in the expression of inflammatory markers were observed to accompany the increase in BBB permeability.
The NFκB signaling pathway affects a wide range of biological processes including innate and
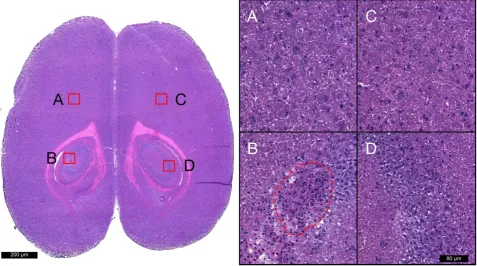
Figure 6. Histological assessment of tissue health. Hematoxylin and eosin staining was used to broadly assess tissue health in each brain from groups 1 and 2 at each target. Images acquired with 20x objective lens at locations sonicated with schemes 1 (D), 2 (B), 3 (A), and non-sonicated control (C) are displayed for a single animal at 4 days post-FUS. Microglial nodules (red dotted line), indicating the clearance of degenerated neurons, are seen in the left hippocampi following sonication with scheme 2. No signs of RBC extravasation, neuronal degeneration, or neutrophil infiltration are seen in the right hippocampi following sonication with scheme 1.
Table 4. Histological events at the focal plane summated across animals
6 h Post-FUS 4 days Post-FUS Scheme
1 Scheme 2 Scheme 3 Scheme 1 Scheme 2 Scheme 3
RBCs 0 12 3 0 26 6
Granular
Leukocytes 0 6 1 0 0 2 Microglial
Nodules 0 0 0 0 7 1
n = 4 for each time point/scheme combination
Table 5. Comparing differential gene expression 6 h post-FUS for each scheme to previously published research
Gene Fold Change in Gene Expression (relative to control) Kovacs et al.
2017 [15] Scheme 1 Scheme 2 Scheme 3 Tnf 10.87 1.87 16.22 9.00 Il1b 31.2 1.55 20.53 11.55 Ccl5 6.86 0.93 4.00 3.41 Birc3 18.96 1.77 14.52 12.55 Icam1 6.35 1.58 6.19 4.44 Il1a 5.31 0.75 3.95 1.71 Nfkb2 2.57 1.23 4.11 2.81 Bcl2a1 3.84 1.45 5.35 2.64 Cd40 2.62 1.22 3.66 3.29 Csf3 4.43 0.73 2.46 0.73 Irf1 3.12 1.25 3.43 3.07 Nfkbia 2.25 1.12 3.73 2.25 Tnfrsf1b 1.70 0.62 2.77 1.34 Linear regression between Kovacs et al. 2017 and scheme 2: r2 = 0.84; p = 0.00001
Previous work examining changes in the NFκB signaling pathway following FUS has reported the induction of a sterile inflammatory response compatible with ischemia or mild traumatic brain injury [15]. In order to test the conclusions of this work, the sonication parameters were replicated and compared to schemes in which the MB dose was lowered and the PNP was calibrated based on acoustic emissions. The changes in gene expression 6 h post-FUS previously reported [15] strongly correlate to those measured in the present study at targets sonicated with scheme 2 (Table 5), confirming these parameters to be unsuitable for clinical translation. It should be noted that these parameters may be beneficial in situations where minimizing tissue damage is not paramount, such as in the delivery of chemotherapeutic agents to brain tumours. However, we demonstrated that an increase in BBB permeability can be achieved without the associated activation of NFκB signaling pathway, histological damage, or MRI indications of edema and hemorrhage.
gene expression [22]. While it is important to recognize that the BBB plays a crucial role in ensuring proper brain homeostasis and preventing infection, it also severely limits the delivery of therapeutics to the brain. Thus, as with any medical intervention, a proper cost-benefit analysis will be required on a patient by patient basis to ensure FUS is used in a manner that maximizes positive outcomes.
Linear regression analysis between contrast-enhanced T1w voxel intensity and NFκB signaling pathway gene expression suggests that post-FUS gadolinium enhancement may have some value in predicting the degree of inflammation 6 h post-FUS. This result highlights the idea that BBB permeability is not dichotomous, open versus closed; there exists a point at which the effects of FUS move beyond a transient change in permeability and induce damage to brain tissue. Genes whose expression display a significant correlation to contrast-enhanced T1w voxel intensity include Ccl5, Icam1, Birc3, Faslg, Tnf, and Il1b. Given the relationship between the expression of these genes and acute inflammation, immune response, and apoptotic processes [31–36], gadolinium enhancement may have additional value for FUS by providing a means of estimating the magnitude of damage induced. Relationships between gadolinium enhancement and post-FUS BBB permeability have previously been demonstrated [37].
It is important to note, however, that the exact relationships between gene expression and gadolinium enhancement described here are unlikely to hold for different experimental setups. This is due to the many factors which influence the permeability of gadolinium across the BBB following FUS and the expression of these genes. These factors include the concentration of gadolinium in circulation, type of gadolinium administered, species of animal, region of brain sonicated, etc. It may be possible, however, to establish correlations, specific to a particular experimental or clinical setup, which will help guide FUS safety standards based on T1w contrast enhancement.
Analysis of post-FUS gadolinium enhancement and PNP also highlights the influence of MB dose on BBB permeability. When comparing the PNP required for the detection of ultraharmonic emissions at least 3.5 times greater than baseline at two different MB doses (10 μl/kg vs 100 μl/kg), there was no influence of MB dose observed; PNP for schemes 1 and 3 were not statistically different (scheme 1: 0.192 MPa ± 0.020 MPa; scheme 3: 0.201 MPa ± 0.015 MPa; p = 0.460). However, the higher MB dose produced significantly greater contrast enhancement. This indicates that while calibrating PNP based on MB activity has been shown to produce more consistent and safe
FUS-mediated increases in BBB permeability [17], there remains a requirement for acoustic feedback control algorithms that utilize the magnitude of sub- or ultraharmonic emissions to be calibrated to a specific MB dose.
Limitations
While the FUS parameters employed for scheme 2 were chosen to replicate those used in the published work that motivated this study [15], there are some differences to note. The first is a difference in MB type, Optison versus Definity. Differences in the acoustic properties of these MBs complicates choosing a MB dose that will produce an equivalent effect; using MB number or gas volume as a means of matching doses may be over simplistic due to key differences, such as shell composition (Optison: human serum albumin; Definity: lipid) and mean diameter (Optison: 2.0-4.5 μm; Definity: 1.1-3.3 μm), which alter the way they respond to FUS. The larger proportion of Optison MBs that are near resonant size at the sonicating frequency used in Kovacs et al. (compared to the proportion of Definity MBs near resonant size in the present study) increases the probability of inertial cavitation and subsequent vascular damage. Conversely, the higher concentration of MBs/μl in Definity may influence the biological response to FUS by affecting the magnitude of stress on vascular walls and the amount/type of bubble-bubble interactions. When these two MBs were compared for the effectiveness of increasing BBB permeability, it was shown that the Definity MBs require a higher pressure amplitude to achieve the same amount of MRI contrast enhancement [16].
Our approach was to use the clinically recommended imaging dose of each MB type as a guide. Since the dose of ~500 μl of Optison/kg used by Kovacs et al. is approximately 10x greater than the recommended clinical dose for imaging [16], we administered 100 μl of Definity/kg (10x greater than the recommended clinical dose for imaging). While we believe the high degree of correlation between gene expression changes in scheme 2 and that reported in Kovacs et al. (Table 5) suggest similar in vivo effects, we recognize that the discordance in MB type between studies may contribute to more subtle differences that are not accounted for. Additionally, PNP was adjusted to match mechanical indexes in order to account for differences in sonication frequencies between studies, although this small difference (current study: 551 kHz; Kovacs et al.: 589 kHz) is not expected to have a detectable impact on the results.
was normalized to the non-sonicated control region in each animal. This measurement was performed on the last T1w scan for each animal. Thus, sonications performed first had more time for gadolinium to accumulate, skewing the relative enhancement between schemes towards: scheme 1 > scheme 2 > scheme 3. However, since gadolinium was administered immediately prior to each sonication, which was necessitated by the time interval between sonications for MB clearance, the concentration of gadolinium in circulation would be higher for the last sonications. This skews the relative enhancement between schemes towards: scheme 3 > scheme 2 > scheme 1. While relative gadolinium enhancement in the final T1w scan should approximate differences in BBB permeability between schemes, this experimental design precludes more accurate quantification. Further work should be directed at establishing relationships between T1w contrast enhancement and inflammation using a more robust experimental design.
Conclusion
This study sought to explore how a FUS-mediated increase in BBB permeability changes the expression of genes related to the NFκB signaling pathway and to assess how MB dose can influence this response. While a significant and damaging inflammatory response was observed at high MB doses, it was demonstrated that FUS can be used to induce increased BBB permeability without an associated upregulation of NFκB signaling pathway gene expression. This emphasizes the importance of employing optimized FUS parameters in order to mitigate the chances of causing injury to the brain at the targeted locations. This work also suggests that T1w contrast-enhancement has potential to be a useful tool in estimating changes in the expression of genes related to acute inflammation, immune response, and apoptotic processes following sonication. Since the first example in 2001 [2], the combined use of MBs and FUS as a technique to increase BBB permeability has undergone substantial assessment and refinement. Efforts to apply FUS in the clinic should be strongly pursued due to its flexibility as a therapeutic intervention, as well as the great need for strategies to effectively deliver drugs to the central nervous system.
Abbreviations
ANOVA: analysis of variance; BBB: blood-brain barrier; FUS: focused ultrasound; LCM: laser capture microdissection; MB: microbubbles; MRI: magnetic resonance imaging; PNP: peak negative pressure; qRT-PCR: quantitative real-time polymerase chain
reaction; RBC: red blood cell; T1w: T1 weighted; T2w: T2 weighted.
Acknowledgements
The authors would like to extend their thanks to Shawna Rideout-Gros for animal preparation and Jennifer Sun for histological staining, as well as Ryan Jones and Dr. Meaghan O'Reilly for consultation. Funding for this work was provided by The National Institute of Biomedical Imaging and Bioengineering of the
National Institutes of Health (R01 EB003268), The
Canadian Institutes for Health Research (FRN 119312),
and the Canada Research Chair Program (awarded to KH).
Supplementary Material
Supplementary tables.
http://www.thno.org/v07p3989s1.pdf
Competing Interests
KH is the founder of FUS Instruments, from which he receives non-study related support. DM declares no competing financial interests.
References
1. Pardridge WM. The blood-brain barrier: bottleneck in brain drug development. NeuroRx. 2005;2: 3–14.
2. Hynynen K, McDannold N, Vykhodtseva N, Jolesz FA. Noninvasive MR imaging-guided focal opening of the blood-brain barrier in rabbits. Radiology. 2001;220: 640–646.
3. Burgess A, Ayala-Grosso CA, Ganguly M, Jordão JF, Aubert I, Hynynen K. Targeted Delivery of Neural Stem Cells to the Brain Using MRI-Guided Focused Ultrasound to Disrupt the Blood-Brain Barrier [Internet]. Ikezu T, editor. 2011. doi:10.1371/journal.pone.0027877
4. Kinoshita M, McDannold N, Jolesz FA, Hynynen K. Targeted delivery of antibodies through the blood–brain barrier by MRI-guided focused ultrasound. Biochem Biophys Res Commun. 2006;340: 1085–1090.
5. Weber-Adrian D, Thévenot E, O’Reilly MA, Oakden W, Akens MK, Ellens N, et al. Gene delivery to the spinal cord using MRI-guided focused ultrasound. Gene Ther. 2015;22: 568–577.
6. Treat LH, McDannold N, Vykhodtseva N, Zhang Y, Tam K, Hynynen K. Targeted delivery of doxorubicin to the rat brain at therapeutic levels using MRI-guided focused ultrasound. International journal of cancer. Wiley Online Library; 2007;121: 901–907.
7. Jordão JF, Ayala-Grosso CA, Markham K, Huang Y, Chopra R, McLaurin J, et al. Antibodies targeted to the brain with image-guided focused ultrasound reduces amyloid-beta plaque load in the TgCRND8 mouse model of Alzheimer’s disease. PLoS One. 2010;5: e10549.
8. Burgess A, Huang Y, Querbes W, Sah DW, Hynynen K. Focused ultrasound for targeted delivery of siRNA and efficient knockdown of Htt expression. J Control Release. 2012;163: 125–129.
9. Fan C-H, Ting C-Y, Lin H-J, Wang C-H, Liu H-L, Yen T-C, et al. SPIO-conjugated, doxorubicin-loaded microbubbles for concurrent MRI and focused-ultrasound enhanced brain-tumor drug delivery. Biomaterials. 2013;34: 3706–3715.
10. Alkins R, Burgess A, Ganguly M, Francia G, Kerbel R, Wels WS, et al. Focused ultrasound delivers targeted immune cells to metastatic brain tumors. Cancer Res. 2013;73: 1892–1899.
11. Etame AB, Diaz RJ, O’Reilly MA, Smith CA, Mainprize TG, Hynynen K, et al. Enhanced delivery of gold nanoparticles with therapeutic potential into the brain using MRI-guided focused ultrasound. Nanomedicine. 2012;8: 1133–1142.
12. Wei K-C, Chu P-C, Wang H-YJ, Huang C-Y, Chen P-Y, Tsai H-C, et al. Focused Ultrasound-Induced Blood–Brain Barrier Opening to Enhance Temozolomide Delivery for Glioblastoma Treatment: A Preclinical Study. PLoS One. Public Library of Science; 2013;8: e58995.
14. Ting C-Y, Fan C-H, Liu H-L, Huang C-Y, Hsieh H-Y, Yen T-C, et al. Concurrent blood-brain barrier opening and local drug delivery using drug-carrying microbubbles and focused ultrasound for brain glioma treatment. Biomaterials. 2012;33: 704–712.
15. Kovacs ZI, Kim S, Jikaria N, Qureshi F, Milo B, Lewis BK, et al. Disrupting the blood-brain barrier by focused ultrasound induces sterile inflammation. Proc Natl Acad Sci U S A. 2017;114: E75–E84.
16. McDannold N, Vykhodtseva N, Hynynen K. Use of Ultrasound Pulses Combined with Definity for Targeted Blood-Brain Barrier Disruption: A Feasibility Study. Ultrasound Med Biol. 2007;33: 584–590.
17. O’Reilly MA, Hynynen K. Blood-brain barrier: real-time feedback-controlled focused ultrasound disruption by using an acoustic emissions-based controller. Radiology. 2012;263: 96–106.
18. Wu H, Rognin NG, Krupka TM, Solorio L, Yoshiara H, Guenette G, et al. Acoustic characterization and pharmacokinetic analyses of new nanobubble ultrasound contrast agents. Ultrasound Med Biol. 2013;39: 2137–2146. 19. McDannold N, Vykhodtseva N, Hynynen K. Use of ultrasound pulses
combined with Definity for targeted blood-brain barrier disruption: a feasibility study. Ultrasound Med Biol. 2007;33: 584–590.
20. Zheng Z, Yenari MA. Post-ischemic inflammation: molecular mechanisms and therapeutic implications. Neurol Res. 2004;26: 884–892.
21. Shen W, Zhang C, Zhang G. Nuclear factor kappaB activation is mediated by NMDA and non-NMDA receptor and L-type voltage-gated Ca(2+) channel following severe global ischemia in rat hippocampus. Brain Res. 2002;933: 23–30.
22. McMahon D, Bendayan R, Hynynen K. Acute effects of focused ultrasound-induced increases in blood-brain barrier permeability on rat microvascular transcriptome. Sci Rep. Nature Publishing Group; 2017;7: 45657.
23. Berti R, Williams AJ, Moffett JR, Hale SL, Velarde LC, Elliott PJ, et al. Quantitative real-time RT-PCR analysis of inflammatory gene expression associated with ischemia-reperfusion brain injury. J Cereb Blood Flow Metab. 2002;22: 1068–1079.
24. Williams AJ, Dave JR, Tortella FC. Neuroprotection with the proteasome inhibitor MLN519 in focal ischemic brain injury: relation to nuclear factor kappaB (NF-kappaB), inflammatory gene expression, and leukocyte infiltration. Neurochem Int. 2006;49: 106–112.
25. McDannold N, Arvanitis CD, Vykhodtseva N, Livingstone MS. Temporary disruption of the blood-brain barrier by use of ultrasound and microbubbles: safety and efficacy evaluation in rhesus macaques. Cancer Res. 2012;72: 3652–3663.
26. Downs ME, Buch A, Sierra C, Karakatsani ME, Teichert T, Chen S, et al. Correction: Long-Term Safety of Repeated Blood-Brain Barrier Opening via Focused Ultrasound with Microbubbles in Non-Human Primates Performing a Cognitive Task. PLoS One. 2015;10: e0130860.
27. Horodyckid C, Canney M, Vignot A, Boisgard R, Drier A, Huberfeld G, et al. Safe long-term repeated disruption of the blood-brain barrier using an implantable ultrasound device: a multiparametric study in a primate model. J Neurosurg. 2016; 1–11.
28. McDannold N, Vykhodtseva N, Raymond S, Jolesz FA, Hynynen K. MRI-guided targeted blood-brain barrier disruption with focused ultrasound: Histological findings in rabbits. Ultrasound Med Biol. 2005;31: 1527–1537. 29. Hynynen K, McDannold N, Sheikov NA, Jolesz FA, Vykhodtseva N. Local and
reversible blood-brain barrier disruption by noninvasive focused ultrasound at frequencies suitable for trans-skull sonications. Neuroimage. 2005;24: 12–20. 30. Baseri B, Choi JJ, Tung Y-S, Konofagou EE. Multi-modality safety assessment of blood-brain barrier opening using focused ultrasound and definity microbubbles: a short-term study. Ultrasound Med Biol. 2010;36: 1445–1459. 31. Dénes A, Humphreys N, Lane TE, Grencis R, Rothwell N. Chronic systemic
infection exacerbates ischemic brain damage via a CCL5 (regulated on activation, normal T-cell expressed and secreted)-mediated proinflammatory response in mice. J Neurosci. 2010;30: 10086–10095.
32. Pleines UE, Stover JF, Kossmann T, Trentz O, Morganti-Kossmann MC. Soluble ICAM-1 in CSF coincides with the extent of cerebral damage in patients with severe traumatic brain injury. J Neurotrauma. 1998;15: 399–409. 33. Signoretti S, Vagnozzi R, Tavazzi B, Lazzarino G. Biochemical and
neurochemical sequelae following mild traumatic brain injury: summary of experimental data and clinical implications. Neurosurg Focus. 2010;29: E1. 34. Redell JB, Zhao J, Dash PK. Altered expression of miRNA-21 and its targets in
the hippocampus after traumatic brain injury. J Neurosci Res. 2011;89: 212–221.
35. Doyle KP, Simon RP, Stenzel-Poore MP. Mechanisms of ischemic brain damage. Neuropharmacology. 2008;55: 310–318.
36. Helmy A, De Simoni M-G, Guilfoyle MR, Carpenter KLH, Hutchinson PJ. Cytokines and innate inflammation in the pathogenesis of human traumatic brain injury. Prog Neurobiol. 2011;95: 352–372.