I
www.irmbrjournal.com September 2019I
nternationalR
eview ofM
anagement andB
usinessR
esearchVol. 8 Issue.3
R
M
B
R
Passengers Satisfaction Toward Oman Air Services
INDA SUKATI
Department of Marketing and Entrepreneurship, College of Commerce and Business Administration, Dhofar University, Salalah, Sultane of Oman.
E-mail: indasukatiutmjb@gmail.com
AHMED MUSALLAM MAHAD AL MASHANI
Department of Marketing and Entrepreneurship, College of Commerce and Business Administration, Dhofar University, Salalah, Sultane of Oman.
Abstract
The quality of service is important determinant to evaluate whether the customer satisfaction or not. The purpose of this survey is to identify the Oman Air Passenger perception toward Oman Air Service, and to examine the effect of Oman Air services and passenger’s satisfaction. The population of the study was the people who have took Oman Air flight at Airport of Salalah, Oman. Convenience sampling was used in this survey in distributing questionnaires to passenger aircraft at Salalah airport, Oman. Finding show that 57.5% of the variation in satisfaction of Oman Air passengers was influenced by three dimensions of Oman Air services, namely Customer Service before flight, Customer Service during flight, Customer Service after flight. The finding also shows that Oman Air Passengers both male and female passengers have the similar level of satisfaction with the three dimension services (Customer Service before flight, Customer Service during flight, Customer Service after flight) provided by Oman Air.
Keywords: Customer Satisfaction, Services Quality, Customer Service Before Flight, Customer Service During Flight, Customer Service After Flight.
Introduction
Oman Air is the national airline of the Sultanate of Oman. Now, Oman airlines offer air transportation services that are safe, comfortable and profitable, as well as all other air services, Oman Air has an important position as a highly qualified and trusted airline. Oman airlines currently operate direct flights from Muscat, Oman's capital city to several destination countries in the Arabian Gulf region such as Abu Dhabi, Bahrain, Doha, Dubai, Jeddah, Riyadh, Dammam, Medina and Kuwait. In the Middle East, North Africa and the Persian region, airlines also travel to Cairo, Amman, Tehran, Zanzibar, Nairobi and Mashhad. Oman Air also operates direct flights from Muscat to many ASEAN destination countries, such as Jakarta, Kuala Lumpur, Singapore, etc.
I
www.irmbrjournal.com September 2019I
nternationalR
eview ofM
anagement andB
usinessR
esearchVol. 8 Issue.3
R
M
B
R
Oman Air has been awarded the "Passenger Satisfaction" award for exceptional passenger service and excellence at the North Africa and Middle East Awards for the year 2018, which was held at the Burj Al Arab hotel in Dubai recently. Oman Air has recently crowned the airline's leading economy Class award at the 2018 World Travel Awards, and has also won the title of the airline's leading permanent passenger loyalty program "Sinbad" for the same year, which was held at the Bateo da Galle exhibition in the Portuguese city of Lisbon.
This achievement follows the victory of Oman Air with many prizes that were harvested this year, underscoring the carrier's commitment to excellence and quality among airlines, as well as the prestige it enjoys in the travel industry. It is noteworthy that 2018 was a very special year for Oman Air, besides winning many international awards and decorations, the national carrier added seven new planes to its growing fleet as well as the inauguration of three new destinations including Istanbul in Turkey, Casablanca in Morocco and Moscow in Russia.
The objectives of this study are as follows: (1) To know the Oman Air passenger’s perception level, (2) To know the most important variables of Oman Air passenger satisfaction, and (3) To identify the Oman Air passenger satisfaction level depends to the Passengers profile
Literature Review
Passenger’s Perception and Expectation
Air passenger perception is the process by which air passengers extract information on a particular flight product or service then identify about how to interpret the flight environment (Sweeney, J. 200
1
). The perception of passenger air service is the ability to see, hear or become aware of something through the senses of air passengers. In addition, perception is also a way in which something is considered an object or person or place, understood or interpreted (Dictionary of Oxford, 2013). Air passenger perceptions in psychology refer to passenger mental organization and interpretation of sensory information related to flight services. Air passenger perceptions can be influenced by various factors such as air service intensity and physical dimensions of the stimulus, passenger past experience. In addition, passenger attention factor includes readiness to respond to stimuli both stimuli from inside and outside stimuli and motivation and emotional state of passengers will also affect the perception of passengers. Thus, if a passenger has a bad perception of an air flight service with past experience, the passenger will not return to flight using the services of the same company.Jayawardhena, C. (2007, expectations are very important and well known to all the marketers. This is because most of the definitions of service quality lie between meeting and exceeding passenger’s expectations. When the service provided is exceeding the passenger’s expectations, the passengers mostly will repurchase the products again if they need it.
Refer to (1995, Yap, S.F. (2007), passenger’s satisfaction or overall service quality is seen as a function of the comparison between a passenger’s expectation and his or her perception of actual service. Carlson, J. (2010) further stated that perception is the standards of or reference points of performance against which services experiences are compared and are often formulated in terms of what a passenger believes should or will happen. According to Lee, H. S. (2013, the service quality conceptualized as the ‘degree and direction between consumers’ perceptions and expectations’ and to expectations being less relevance.
I
www.irmbrjournal.com September 2019I
nternationalR
eview ofM
anagement andB
usinessR
esearchVol. 8 Issue.3
R
M
B
R
Passengers Satisfaction
Air passenger satisfaction in this case Oman Air passenger satisfaction is closely related to the perception of flight service performance relative to passenger expectations. In addition, satisfaction with passenger flights is key for airlines to build profitable relationships with customers so that they will be loyal to airline brands. This is because satisfied passengers will return to fly by using the same flight service, having positive WOM with friend, relatives, families and etc. Furthermore, the satisfied passengers will be more loyal to brands and competing advertisements (Kotler, P. J., & Armstrong, G. M. 2010).
According to service marketing analysis mention that All Air flight passenger satisfaction encompasses of expectations and perceptions. To improve passenger’s satisfaction, the airlines company have to take into account these important variables. Only satisfied passenger will be loyal and fly using the same flight service again in the future. Olsen, S. (2002) has the same opinion as the previous researcher, Olsen, S. (2002), who stated that the basis of passenger loyalty is sustained passenger satisfaction. To increase passenger loyalty, the current airline service company increases the level of satisfaction of each passenger and maintains that level of satisfaction from time to time. The method for increasing passenger satisfaction is the need to add value to what they offer to passengers. This will make passengers feel they get more than they pay for (Olsen, S. 2002)
Ehigie, B. (2006) defines passenger satisfaction as an individual's perceptions of passengers on the performance of a product or service related to expectations. Whereas Schneider, B. (2009), shows that passenger satisfaction is an assessment that product features or flight services provide a level of fulfilment related to pleasant consumption which includes the level of fulfilment that is less or more fulfilment. According to Martin Evans, Ahmad Jamal and Gordon Foxall (2006, quoted in Hiramatsu, A. (2008) states that passenger satisfaction is an attitude like the feeling of passengers on a product or service after being used. So, it is generally described as meeting someone's hope. The concept of satisfaction is important for marketers in this highly competitive world of aviation business for success and future profits.
According to Khalifa, A. (2004), passenger flight satisfaction is the state of mind possessed by air flight passengers about an air flight service company when passenger expectations have been met or exceeded during the life span of an air flight service or product. The researcher further stated that the achievement of air passenger flight satisfaction is the key that will lead to the loyalty and repurchase of certain flight products.
In short, passenger satisfaction is a process that must be constantly focused by Oman Air airlines. This can be done by getting feedback from passengers, evaluating and analyzing and making improvements to improve or maintain passenger satisfaction. If Oman Air airlines do not care about passenger satisfaction, soon passengers will choose other airlines such as Arabian Airliner, Qatar Airlines, and other airlines which are also provided at the same price or may be cheaper but provide higher passenger satisfaction. In addition, the airline Oman Air must always add value to their services such as training employees so that they can better provide services to passengers.
Service Quality
I
www.irmbrjournal.com September 2019I
nternationalR
eview ofM
anagement andB
usinessR
esearchVol. 8 Issue.3
R
M
B
R
Chang, Y. W. (2012), the quality of air flight services can be interpreted as the ability of airlines to meet or exceed passenger expectations. The quality of air flight services can be measured in terms of the extent to which performance is felt by air passengers meeting or exceeding the expected service level. The quality of air flight services is very important in satisfying passengers and providing positive information by word of mouth (WOM), so that satisfied passengers can help promote to others about flight services. In addition, airline service passengers assess the quality of services they consume by comparing the level of service they receive according to the level of service they want and the level of service they want to receive. Conceptually, passenger satisfaction with flight services depends on the quality and perception of passengers on aircraft services (Tan, K. C. 2001). The quality of air flight services is the difference between what passengers expect air flights and what is provided by the airline service company. In their research, they also stated that the service quality (SERQUAL) model is a very important and most appropriate method for measuring service quality.
Passenger’s satisfaction Measurement
The SERVQUAL concept or service quality in this case is the quality of air flight services is a method to measure how air airline passengers perceive the quality of flight services and whether passengers are satisfied with the air flight services they receive
(
Grönroos, C., 2006). Parasuraman et al. (1988, quoted in Lee, H. S. (2013) proposes that the quality of air flight services is a multi-dimensional concept consisting of five dimensions, namely reliability, responsiveness, assurance, empathy and physical evidence. The quality of air flight services or SERVQUAL refers to methods that are empirically derived which might be used by an air flight organization to improve the quality of air flight services.Air flight passengers want to buy a flight service product or not depends on the ticket price. Ticket prices are costs that must be spent in getting air flight products or services consisting of cash, time and willingness of passengers to get them. Airline service passengers tend to compare all ticket costs to get airborne flight products or services with any constraints and they will evaluate whether they are worth buying. In addition, the opinions of others such as family members, friends and other consumers will also affect passenger satisfaction. Passenger satisfaction is not only based on individual perceptions, but also greatly influenced by the experiences, opinions, and behavior of others.
Finally, the satisfaction of air flight passengers will lead to loyalty which indicates that passengers will buy back the same flight services in the future when they are very satisfied. If they are not satisfied with air flight services from an airline, they will no longer use the same brand and will give negative words of mouth (WOM) to their friends. Thus, the reputation of the airline will be damaged.
The Relationship between Oman Air Services and Passengers Satisfaction
According to Brady and Robertson (2001), service quality in this case the quality of air flight services is an antecedent to the satisfaction of air flight customers on the grounds that because service quality is cognitive evaluation, perceptions of service quality that can positively produce satisfaction can turn profitable intensity. Service quality and passenger satisfaction are undeniably two concepts that are at the core of marketing theory and practice. In today's competitive world, shipping in high-quality services plays a very important role in increasing passenger satisfaction.
I
www.irmbrjournal.com September 2019I
nternationalR
eview ofM
anagement andB
usinessR
esearchVol. 8 Issue.3
R
M
B
R
Methodology
Data collecting
In statistics many methods can be used to collect data and information related to two types of data, namely primary and secondary data. According to Zikmund and Babin (2007), primary data is data collected by researchers while secondary data is collected by others. Primary data is original data that can be obtained through various methods including surveying people using questionnaires, by observing events or people, through focus groups or in-depth interviews. Data obtained specifically to meet specific research objectives. While secondary data is data that has been collected or produced by others in the form of publications, print or electronic. Material comes from many secondary sources and is stored somewhere and can be accessed.
Sampling Method
The population is defined as a group of entities usually people, but sometimes organizations or objects that have some common characteristics that meet the specific requirements of the research project. While a sample means taking a small portion from a larger whole. This is used to make a judgement or generalization about the whole. Therefore, a sample was like a subgroup or subset of the population that selected to represent the population and characteristic of sample are then used to make inferences about a population. In most quantitative research projects, sampling usually was one of the best options. This is due to mainly two reasons that were population size was too large and geographically widespread. So, it is very expensive if want to choose whole population to study. In this research, the population of the study was the people who have took Oman Air flight before in a particular area. The researcher had chosen a sample which is a small portion of the Oman Air passenger to carry out the research.
Sampling Technique
To collect research data, there are four types of nonprobability sampling methods, namely convenience sampling, judgmental sampling, quota sampling and snowball sampling. Convenience sampling was used in this survey in distributing questionnaires to passenger aircraft at Salalah airport, Oman. Passengers were chosen, perhaps, because they were in the right place and at the right time.
Data Analysis
Data is not meaningful without interpret and analyze. The survey data collected was analyzed by using the software Excel program and SPSS in order to know the passenger’s satisfaction towards Oman Air services. The researcher used descriptive statistic and some statistical test to analyze the result.
Descriptive Analysis
Descriptive statistics include frequency distribution and the observations. Observations such as measures of central tendency and dispersion are example of descriptive measures that used to give a general picture of the survey responses before further analysis takes place. Most of the researchers used this technique to help them have a clear picture in analyzing the data.
I
www.irmbrjournal.com September 2019I
nternationalR
eview ofM
anagement andB
usinessR
esearchVol. 8 Issue.3
R
M
B
R
Reliability and Validity Test
The questions which using Likert scale need to test for reliable and valid or not before further analysis by using the statistical test. Reliability means the extent to which measures are free from random errors. This can be interpreting from the coefficient alpha (Cronbach’s alpha) in the SPSS. When the Cronbach’s alpha is more than 0.5 which mean that the Likert scale data is reliable.
Meanwhile, the validity of a scale is defined as the extent to which differences in observed scale scores reflect true differences among objects on the characteristics being measured rather than systematic or random error. By using the SPSS, if the KMO is more than 0.5, therefore the data is valid. After finish checking the result was reliable and valid, and then the researcher can proceed to do the statistical test.
Results
Passengers Profile Analysis
In order to identify the demographic details of Passengers, some demographic questions have been asked. The demographic dimension consists of passenger’s gender, passenger’s age and passenger’s race, the passenger’s purpose of taking flight, passenger’s marital status, passenger’s income level and passenger’s frequency of flying with Oman Air in a year. All the data were collected and analyzed based on frequency and percentage.
Passengers by Gender
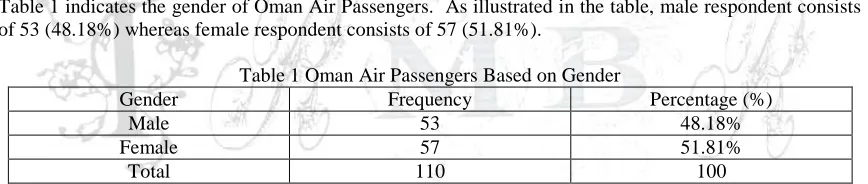
Table 1 indicates the gender of Oman Air Passengers. As illustrated in the table, male respondent consists of 53 (48.18%) whereas female respondent consists of 57 (51.81%).
Table 1 Oman Air Passengers Based on Gender
Gender Frequency Percentage (%)
Male 53 48.18%
Female 57 51.81%
Total 110 100
Oman Air Passengers by Age
Table 2, the largest portion of passengers comes from category 21 to 30 years old (37.27%), followed by group 31 to 40 years old (31.81%). The third larger group is 15 to 20 years old and 41 to 50 years’ old which consist of 28 Passengers (25.44%). The small portion groups go to 51 and above years’ old which have 6 Passengers (5.45%) and 4 Passengers (3.3%) respectively.
Table 2 Oman Air Passengers by Age
Age Frequency Percentage (%)
15-20 14 12.72%
21-30 41 37.27%
31-40 35 31.81%
41-50 14 12.72%
51 and above 6 5.45%
I
www.irmbrjournal.com September 2019I
nternationalR
eview ofM
anagement andB
usinessR
esearchVol. 8 Issue.3
R
M
B
R
Oman Air Passengers by Race
Table 3, there are 2 category of race. Non-Omani passengers have the highest frequency which is 80 Passengers (72.72%). And Omani respondent which are 30 (27.27%).
Table 3 Oman Air Passengers by Race
Race Frequency Percentage (%)
Omani 30 27.27%
Non-Omani 80 72.72%
Total 110 100
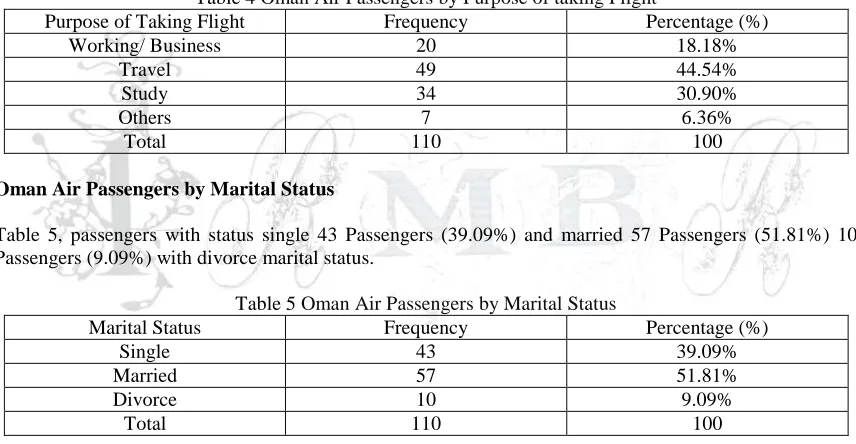
Oman Air Passengers by Purpose of taking Flight
Table 4 shows Oman Air Passengers by Purpose of taking Flight. Table illustrates that almost half of the
Passengers taking flight is because of travel which consists of 49 Passengers (44.54%). 20 Passengers (18.18%) taking flight with the purpose of working or business while 34 Passengers (30.90%) with the purpose of study. Out of 110 Passengers, there are 7 Passengers (6.36%) taking flight with other purpose.
Table 4 Oman Air Passengers by Purpose of taking Flight
Purpose of Taking Flight Frequency Percentage (%)
Working/ Business 20 18.18%
Travel 49 44.54%
Study 34 30.90%
Others 7 6.36%
Total 110 100
Oman Air Passengers by Marital Status
Table 5, passengers with status single 43 Passengers (39.09%) and married 57 Passengers (51.81%) 10 Passengers (9.09%) with divorce marital status.
Table 5 Oman Air Passengers by Marital Status
Marital Status Frequency Percentage (%)
Single 43 39.09%
Married 57 51.81%
Divorce 10 9.09%
Total 110 100
Oman Air Passengers by flight Frequency with Oman Air in a Year
Table 6. show Oman Air Passengers by Frequency of Flying with Oman Air in a Year. There are 24 Passengers (18.18%) flying with Oman Air 1 to 3 times in a year. There are 49 Passengers (44.54%) that flying with Oman Air 4 to 6 times in a year. There are 34 Passengers (30.90%) flying with Oman Air 7 to 9 times in a year. And 7 Passengers (6.36%) more than 10 times in a year.
Table 6 Oman Air Passengers by flight Frequency with Oman Air in a Year
Flying with Oman Air in a year (Times) Frequency Percentage (%)
1-3 24 18.18%
4-6 49 44.54%
7-9 34 30.90%
>10 7 6.36%
I
www.irmbrjournal.com September 2019I
nternationalR
eview ofM
anagement andB
usinessR
esearchVol. 8 Issue.3
R
M
B
R
Passengers perception of Oman Air Services
Table 7 indicated that means of Oman Air passenger’s perception of Service before flight according to five
Likert scale starting from 1= strongly disagree to 5=strongly agree. The highest mean among the items for
Passenger Service before flight was Pleasant and helpful staff with foreign language skills with mean score 4.3 and followed by Passenger guidance about security check, shopping and boarding with mean score 4.1 and the lowest mean of Passenger information in multiple locations. with score mean 2.9. The average of
the passenger’s response of Passenger Service before flight items range between 2.9–4.3, the results seem
to indicate that the passengers have positive response on Passenger Service before flight items. The average
standard deviation for Passenger Service before flight seems to be high that indicates that there was a lot of variation in the Oman Air passenger’s answer.
The rating was used to interpretation the results of Passenger Service before flight was: 1.00 – 1.49 strongly disagree, 1.50 – 2.49 disagree, 2.50 – 3.49 neutral, 3.50 -4.49 agree, and 4.50 – 5.00 strongly agree.
Table 7 Passengers response of Airport Passenger Service before flight
Items
Strongly disagree
(1)
Disagree (2)
Neutral (3)
Agree (4)
Strongly agree
(5)
Mean S.D
Quick check in. 0 0 39 30 41 4 0.9
Quick luggage deposit. 0 0 82 28 0 3.3 0.4
Passenger guidance 0 0 0 96 14 4.1 0.3
Help provided to elderly and
disabled 0 0 42 41 27
3.9 0.8
Pleasant and helpful staff 0 0 27 28 55 4.3 0.8
Comfortable boarding lounge. 0 0 55 41 14 3.6 0.7
Passenger information in multiple
locations. 0 14 96 0 0
2.9 0.3
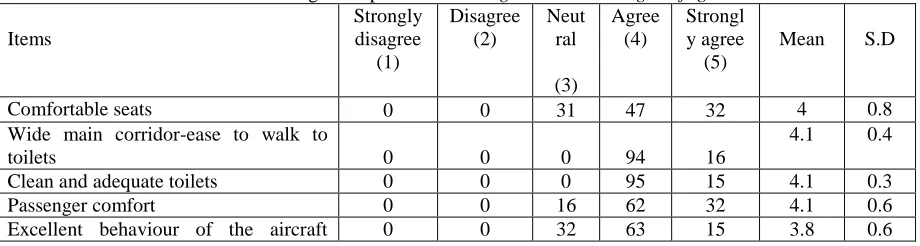
Table 8 explain the means of passenger’s perception of Passenger Service during flight according to scale
starting from 1= strongly disagree to 5=strongly agree. The highest mean of Passenger Service during flight was Quality catering-multiple menus and gift with mean score 4.3 and followed by Comfortable seats, Wide main corridor-ease to walk to toilets, Passenger comfort, Additional facilities if needed with mean score 4.1 and the lowest mean of Entertainment and Quality duty-free goods with score mean 3.6.
The average of the Oman Air passenger’s response of Passenger Service during flight items range between
3.6–4.3, the results seem to indicate that the Oman Air passengers have positive response on Service during
flight items. The average standard deviation for Oman Air Passenger Service during flight fseems to be high that indicates that there is a lot of variation in the Oman Air passenger’s answer.
Table 8 Passengers response of Passenger service during the flight
Items
Strongly disagree
(1)
Disagree (2)
Neut ral
(3)
Agree (4)
Strongl y agree
(5)
Mean S.D
Comfortable seats 0 0 31 47 32 4 0.8
Wide main corridor-ease to walk to
toilets 0 0 0 94 16
4.1 0.4
Clean and adequate toilets 0 0 0 95 15 4.1 0.3
Passenger comfort 0 0 16 62 32 4.1 0.6
I
www.irmbrjournal.com September 2019I
nternationalR
eview ofM
anagement andB
usinessR
esearchVol. 8 Issue.3
R
M
B
R
personnel
Quality catering-multiple menus 0 0 0 79 31 4.3 0.5
Entertainment 0 0 63 32 15 3.6 0.7
Additional facilities if needed 0 0 32 31 47 4.1 0.8
Care for families 0 0 0 110 0 4 0
Gifts 0 0 0 79 31 4.3 0.5
Quality duty-free goods 0 0 62 32 16 3.6 0.7
Table 9 indicated means of Oman Air passenger’s perception of Service after flight according to scale starting from 1= strongly disagree to 5=strongly agree. The highest mean of Service after flight was Arrangements if the passenger has to change destination or cancel return with mean score 4.0 and followed by Transfer from one airport to another by means of the company. Transfer to hotel if stoppage overnight and Quick and effective response in cases of lost or damaged luggage with mean score 3.9 and the lowest mean of Customs and consular facilities with score mean 3.6 The average of the passenger’s response of
Passenger Service after flight items range between 3.6–4.3, the results seem to indicate that the passengers have positive response on Passenger Service after flight items. The average standard deviation for
Passenger Service after flight found to be high that indicates that there is a lot of variation in the passenger’s answer.
Table 9 Passengers response of Passenger service after the flight
Items
Strongly disagree
(1)
Disagree (2)
Neutral
(3)
Agree (4)
Stron gly agree
(5)
Mean S.D
Transfer from one airport to
another by means of the
company
0 0 42 41 27 3.9 0.8
Quick and effective response in
cases of lost or damaged
luggage.
0 0 20 83 7 3.9 0.5
Guidance towards car-hire or taxi hub.
1 6 38 34 31 3.8 0.9
Arrangements if the passenger has to change destination or cancel return.
0 0 13 85 12 4 0.5
Customs and consular facilities. 0 6 15 46 14 3.6 0.8
Table 10 indicated Oman Air Passenger’s response of passenger’s satisfaction level towards service provided by Oman Air according to scale starting from 1= strongly disagree to 5=strongly agree. The highest mean among the items for Oman Air passenger’s satisfaction level towards service provided by Oman Air was Passenger Service during flight with mean score 3.9 and followed by Passenger Service after flight with mean score 3.8 and the lowest mean of Oman Air Passenger Service before flight with
score mean 3.7 The average of the Oman Air passenger’s response of passenger’s satisfaction level towards
service provided by Oman Air items range between 3.7-3.9, the results seem to indicate that the passengers
have positive response on Oman Air passenger’s satisfaction level towards service provided by Oman Air
items. The average standard deviation for Oman Air passenger’s satisfaction level towards service provided
I
www.irmbrjournal.com September 2019I
nternationalR
eview ofM
anagement andB
usinessR
esearchVol. 8 Issue.3
R
M
B
R
Table 10 Passengersresponse of passenger’s satisfaction level towards service provided by Oman Air
Items
Strongly disagree
(1)
Disagree (2)
Neutral
(3)
Agree (4)
Strongly agree
(5)
Mean S.D
I am satisfied with Quick check in. 0 0 39 30 41 4 0.9
I am satisfied with Quick luggage deposit. 0 0 82 28 0 3.3 0.4
I am satisfied with Passenger guidance about security check, shopping and
boarding. 0 0 0 96 14
4.1 0.3
I am satisfied with Help provided 0 0 42 41 27 3.9 0.8
I am satisfied with Pleasant and helpful
staff 0 0 27 28 55
4.3 0.8
I am satisfied with Comfortable boarding
lounge. 0 0 55 41 14
3.6 0.7
I am satisfied with Passenger information
in multiple locations. 0 14 96 0 0
2.9 0.3
3.7
I am satisfied with Comfortable seats 0 0 31 47 32 4 0.8
I am satisfied with Wide main
corridor-ease to walk to toilets 0 0 0 94 16
4.1 0.4
I am satisfied with Clean and adequate
toilets 0 0 0 95 15
4.1 0.3
I am satisfied with Passenger comfort 0 0 16 62 32 4.1 0.6
I am satisfied with Excellent behaviour of
the aircraft personnel 0 0 32 63 15
3.8 0.6
I am satisfied with Quality
catering-multiple menus 0 0 0 79 31
4.3 0.5
I am satisfied with Entertainment 0 0 63 32 15 3.6 0.7
I am satisfied with Additional facilities if
needed 0 0 32 31 47
4.1 0.8
I am satisfied with Care for families 0 0 0 110 0 4 0
I am satisfied with Gifts 0 0 0 79 31 4.3 0.5
I am satisfied with Quality duty-free goods 0 0 62 32 16 3.6 0.7
3.9
I am satisfied with Transfer from one airport to another by means of the company
0 0 42 41 27 3.9 0.8
I am satisfied with Quick and effective response
0 0 20 83 7 3.9 0.5
I am satisfied with Guidance towards car-hire or taxi hub.
1 6 38 34 31 3.8 0.9
I am satisfied with Arrangements if the passenger has to change destination or cancel return.
0 0 13 85 12 4 0.5
I am satisfied with Customs and consular facilities.
0 6 15 46 14 3.6 0.8
I
www.irmbrjournal.com September 2019I
nternationalR
eview ofM
anagement andB
usinessR
esearchVol. 8 Issue.3
R
M
B
R
Analysis of Reliability
Reliability analysis is the ability to scale to produce the same response. For Cronbach's alpha, popular consistency, a minimum value of 0.70 is considered acceptable for the existing scale for the newly developed scale (Nunnally, 1978).
When Cronbach’s α range from 0.35 to 0.70, the reliability of the measurement is medium. When it was above 0.70, the reliability of the instrument was high. If it is below 0.35, it shows low reliability and the instrument should be rejected.
Table 11. the result of completed questionnaires, Kaiser, Meyer-Olkin (KMO) measure of sampling adequacy which indicate the proportion of variance in the variables are caused by underlying factor thus allowing for the application of factor analysis. This is supported by Barlett’s Test of Sphericity value of 0.000 that is less than 0.05 thus proving that the analysis is significant. Passenger Service before flight
(0.782), Passenger Service during flight (0.724), Passenger Service after flight (0.884), passenger satisfaction (0.876)
Table 11 Kaiser-Meyer-Olkin and Barlett’s Test KMO of
Sampling
Barlett’s Test of Sphericity
Approx.Chi-Square df
sig
Passenger Service before flight 0.782 391.434 21 0.000
Passenger Service before flight 0.724 265.956 15 0.000
Passenger Service before flight 0.884 784.150 21 0.000
Passenger satisfaction 0.876 763.861 45 0.000
After completing the factor analysis on Passenger Service provided by Oman Air, the researcher concluded
three main variables from twenty-three questions. Each question’s component loading variance was higher than 0.5. There were Passenger Service before flight, Passenger Service during flight, Passenger Service after flight.
Table 12 Summary for factor analysis Passenger Service provided by Oman Air
Factors Items Factor
loading
Cronbach’s α
Passenger Service before flight
Quick check in. 0.388
0.7733
Quick luggage deposit. 0.612
Passenger guidance about security check, shopping and boarding. 0.556
Help provided to elderly and disabled by using electric vehicles. 0.572
Pleasant and helpful staff with foreign language skills. 0.711
Comfortable boarding lounge. 0.702
Passenger information in multiple locations. 0.713
Passenger Service during flight
Comfortable seats 0.693
0.7035
Wide main corridor-ease to walk to toilets 0.586
Clean and adequate toilets 0.546
Passenger comfort 0.566
Excellent behaviour of the aircraft personnel 0.753
Quality catering-multiple menus 0.662
Entertainment 0.732
Additional facilities if needed 0.741
Care for families 0.74
I
www.irmbrjournal.com September 2019I
nternationalR
eview ofM
anagement andB
usinessR
esearchVol. 8 Issue.3
R
M
B
R
Quality duty-free goods
Passenger Service after flight
Transfer from one airport to another by means of the company 0.789
0.7707
Quick and effective response in cases of lost or damaged luggage. 0.804
Guidance towards car-hire or taxi hub. 0.811
Arrangements if the passenger has to change destination or cancel return.
0.805
Customs and consular facilities. 0.805
Correlation Analysis
To run the multiple regressions, the first step that must be carry out was analysis correlation between three independent variables (Passenger Service before flight (CSBF), Passenger Service during flight (CSDF), Passenger Service after flight (CSAF) and one dependent variable (Passenger’s satisfaction) need know the significance level should be less than 0.05 to indicate the variable are inter-related with each other. If the significant level more than 0.05 the item should be dropped from the model and should re-analyze the new correlation.
Table 13 indicated correlation between the three independent variables and one dependent variable. Independent variables include Passenger Service before flight (CSBF), Passenger Service during flight (CSDF), Passenger Service after flight (CSAF) and the dependent variable was passenger’s satisfaction (PS). All the data used are the mean value that transform by using SPSS. Table 4.13 show that all the significant level between independent variables and dependent variable is smaller than 0.05, which means all the independent variables have relationship with dependent variable. Therefore, these three dimensions can be used for further analysis in multiple regressions.
Table 13 Correlation
Pearson Correlation CSBF CSDF CSAF PS
Customer Service Before Flight (CSBF)
1.000
Customer Service
During Flight (CSDF)
0.409 1.000
Customer Service After Flight (CSAF)
0.488 0.259 1.000
Passenger’s Satisfaction (PS)
0.602 0.420 0.507 1.000
Multiple Regressions
The second Objective of this study is to know the most important variables of Oman Air passenger satisfaction. To discuss it deploy multiple regression analysis. The most important variables meaning have the highest standard coefficient.
Table 14 shows how strong are the correlation between services provided by Oman air and passengers satisfaction. R was the value that indicated how strong the relationship services provided by Oman air and passengers satisfaction, while R2 (R Square) was the value that indicated how much variation could the model explained. The value of R was 0.748 which means the relationship was strong positive relationship
with magnitude of 0.748. R2 (R Square) value was 0.571 which means 57.5% of the variation of passenger
I
www.irmbrjournal.com September 2019I
nternationalR
eview ofM
anagement andB
usinessR
esearchVol. 8 Issue.3
R
M
B
R
Table 14 Model Summary
R R
Square
Adjusted R2
Stand. Error
of the
Estimate
Change Statistics
R2 Change F Change df1 df2 F Change
Significance
0.648 0.674 0.565 0.281 0.571 30.789 5 114 0.0001
Predictors: (Constant), CSBF, CSDF, CSAF
Table 15 shows the result of ANNOVA. This ANNOVA can help researcher to explain whether the model formed is a good model or not. The researcher has make two hypotheses to this model. If significance
level is less than 0.05, reject and accept .
: model=0 (model not good) : model≠0 (good model)
As illustrated in the table, significance level is 0.0001 which ˂ 0.05, therefore reject and accept . Hence, the model is good.
Table 15 ANNOVA
Model Sum of
Squares
Df Mean Square F Significance
Regression 12.140 5 2.428 30.788 0.0001
Residual 8.990 114 0.079
Total 21.131 119
Predictors: (Constant), CSBF, CSDF, CSAF Dependent Variable: PS
Table 16 indicated the final result of multiple regressions model. To Identify the influential factor by interpreting the significance level of the unstandardized coefficients to delete element that not relevant with factor influential. To identify the influential factor, two hypotheses should be proposed. If level of
significance ˂0.05, reject and accept .
: b=0 (not a factor influential). : b≠0 (factor influential).
Table 16 indicated that if increase 1 unit in Passenger service before flight, level of passenger’s satisfaction
will increase by 0.119 units. While increasing in 1 unit of Passenger service during flight, there is an increase in 0.084 units of passenger satisfaction. Finally, when increase in 1 unit of Passenger service after flight, there was an increase in 0.254 units of passenger satisfaction.
Table 16 Coefficients
Model Unstandardized Coeff. Standardized
Coeff.
T Significance
B Standard
Error
Beta
(Constant) 0.725 0.275 2.636 0.010
Passenger service
before flight
0.119 0.055 0.147 2.156 0.033
Passenger service
during flight
0.084 0.053 0.120 1.588 0.115
Passenger service after flight
0.254 0.066 0.299 3.833 0.000
I
www.irmbrjournal.com September 2019I
nternationalR
eview ofM
anagement andB
usinessR
esearchVol. 8 Issue.3
R
M
B
R
Independent T-test
Objective 3 of the research is to determine the level of passenger satisfaction on Oman Air depends to the profile Passengers. Author selected the passenger satisfaction as test variable and gender as grouping variable in order to test whether there was a difference in their passenger satisfaction. Besides, the author also uses dummy variable in define the grouping variable which is group 1 goes to male passengers and group 2 goes to female passengers. To interpret this objective, need to proposed two hypotheses. If significance level of t-test for equality of means (use equal variances assumed as significant level for F
value ˃ 0.05) is ˂ 0.05, reject and accept .
: Male and female passengers have the similar level of satisfaction. : Male and female passengers have different level of satisfaction.
The following Table 17 indicate ALL mean and standard deviation for male and female passengers. Mean score for male passengers were 3.68 and for female passenger’s mean were 3.74. Standard deviation for male passengers were 0.467 and 0.377 for female passengers.
Table 17 Descriptive Statistic between the Gender and Passenger Satisfaction
Gender of Passengers N Mean Standard Deviation
Passengers satisfaction
Male passengers
53 3.68 0.46
Female passengers
57 3.74 0.37
Table 18 below indicate the independent t-test. The Levene’s Test for Equality of Variances was 0.31 and ˃0.05, therefore use equal variances assumed for t-test value. The t-test value for equal variances assumed is 0.43 which was ˃0.05, accept . Therefore, male passengers and female passengers have the same level of satisfaction toward Oman Air services.
Table 18 Independent Sample T-test Levene’s Test for Equality of
Variances
t-test for Equality of Means
Passenger’s Satisfaction
F Significance t Df Sig. (2-tailed)
assumed Equal
variances
1.04 0.31 -0.78 118 0.43
not assumed Equal variances
-0.77 105.57 0.44
Conclusion
This part discusses the following section: (1) Passengers Perception level towards Service provided by Oman Air, (2) Most important variables of Oman Air Passenger Satisfaction, (3) Oman Air Passenger Satisfaction level depends to the Passengers Profile
Passengers Perception level towards Service provided by Oman Air
I
www.irmbrjournal.com September 2019I
nternationalR
eview ofM
anagement andB
usinessR
esearchVol. 8 Issue.3
R
M
B
R
perception to the Three dimensions. There was mean most of the Passengers are neutral perception with the item was listed in each dimension respectively so that the mean score obtained was quite medium.
Out of three dimensions stated Passenger’s response of passenger’s satisfaction level towards service provided by Oman Air based on scale of 1= strong disagree to 5=strong agree. The highest mean among the
items for passenger’s satisfaction level towards service provided by Oman Air is Passenger Service during
flight with mean score 3.9 and followed by Passenger Service after flight with mean score 3.8 and the lowest mean of Passenger Service before flight with score mean 3.7 The average of the passenger’s response of passenger’s satisfaction level towards service provided by Oman Air items range between 3.7 to 3.9, the results seem to indicate that the passengers have positive response on passenger’s satisfaction level towards service provided by Oman Air items. The average standard deviation for passenger’s satisfaction level towards service provided by Oman Air found to be high that indicates that there is a lot of variation in the passenger’s answer.
Most Important Variables of Oman Air Passenger Satisfaction
To examine the important variables of Oman Air passenger satisfaction, multiple regression has been carried out. R was a value that indicates how strong the relationship between three dimensions of services provided by Oman Air and satisfaction of passengers. R2 was a value that explain how much Oman Air
passenger’s satisfaction could be explained by three dimension (Passenger Service before flight, Passenger
Service during flight, Passenger Service after flight) provided by Oman Air. The value of R is 0.75 means that the relationship was a strong positive with a level of 0.75. R Square value was 0.575, meaning that 57.5% of the variation in satisfaction of Oman Air passengers was influenced by three dimensions of Oman Air services, namely Customer Service before flight, Customer Service during flight, Customer Service after flight.
Oman Air Passenger Satisfaction level depends to the Passengers Profile
Third research question (Are they differences in passenger satisfaction on Oman Air depending on Passenger profile?). To answer this question, an independent t-test has been used. The findings show that Oman Air Passengers both male and female passengers have the similar of satisfaction level (see Tables 17 and 18). Due to the significance level of the t-test was 0.31, so accept H0 that Oman Air Passengers both male and female passengers have the similar level of satisfaction with the three dimension services (Customer Service before flight, Customer Service during flight, Customer Service after flight) provided by Oman Air.
References
Alexandris, K., Dimitriadis, N., & Markata, D. (2002). Can perceptions of service quality predict
behavioral intentions? An exploratory study in the hotel sector in Greece. Managing Service Quality,
12(4), 224-231.
Brady, M. K., & Robertson, C. J. (2001). Searching for a consensus on the antecedent role of service
quality and satisfaction: an exploratory cross-national study. Journal of Business Research, 51(1),
53-60.
Carlson, J., & O'Cass, A. (2010). Exploring the relationships between e-service quality, satisfaction, attitudes and behaviours in content-driven e-service web sites. Journal of Services Marketing, 24(2), 112-127.
Chang, Y. W., & Polonsky, M. J. (2012). The influence of multiple types of service convenience on behavioral intentions: The mediating role of consumer satisfaction in a Taiwanese leisure setting.
International journal of hospitality management, 31(1), 107-118.
I
www.irmbrjournal.com September 2019I
nternationalR
eview ofM
anagement andB
usinessR
esearchVol. 8 Issue.3
R
M
B
R
Ehigie, B. O. (2006). Correlates of customer loyalty to their bank: a case study in Nigeria. International Journal of Bank Marketing, 24(7), 494-508.
Fodness, D. and Murray, B. (2007). Travelers' Expectations of Airport Service Quality, Journal of Services Marketing, 21(7), 492 – 506.
Graham, A. (2005). Airplane terminal Benchmarking: A Review of the Current Situation, Benchmarking: An International Journal, 12(2), 99 – 111.
Grönroos, C. (2006). Adopting a service logic for marketing. Marketing theory, 6(3), 317-333.
Hiramatsu, A., Yamasaki, T., & Nose, K. (2008). Survey of Consumers' Decision Making Process for
Online Music Service. In ICE-B (pp. 229-234).
Ibrahim, H. (2010). Evaluating Service Quality inside Airport Industry, Journal of Management Studies, 5(2), 1 – 13.
Jayawardhena, C., Souchon, A. L., Farrell, A. M., & Glanville, K. (2007). Outcomes of service
encounter quality in a business-to-business context. Industrial Marketing Management, 36(5), 575-588.
Johnston, R. (2001). Linking complaint management to profit. International Journal of Service
Industry Management, 12(1), 60-69.
Khalifa, A. S. (2004). Customer value: a review of recent literature and an integrative configuration.
Management decision, 42(5), 645-666.
Kotler, P. J., & Armstrong, G. M. (2010). Principles of marketing. Pearson Education.
Lee, H. S. (2013). Major Moderators Influencing the Relationships of Service Quality, Customer Satisfaction and Customer Loyalty. Asian Social Science, 9(2), p1.
Olsen, S. O. (2002). Comparative evaluation and the relationship between quality, satisfaction, and repurchase loyalty. Journal of the Academy of Marketing Science, 30(3), 240-249.
Sureshchandar, G. S., Rajendran, C., & Anantharaman, R. N. (2002). The relationship between service quality and customer satisfaction–a factor specific approach. Journal of services marketing, 16(4), 363-379.
Sweeney, J. C., & Soutar, G. N. (2001). Consumer perceived value: the development of a multiple item scale. Journal of retailing, 77(2), 203-220.
Tan, K. C., & Pawitra, T. A. (2001). Integrating SERVQUAL and Kano’s model into QFD for service
excellence development. Managing Service Quality, 11(6), 418-430.
Yap, S. F., & Kew, M. L. (2007). Service quality and customer satisfaction: antecedents of customer's
re-patronage intentions. Sunway Academic Journal, 4, 59-73.