COMPUTER SCIENCE & TECHNOL
COMPUTER SCIENCE & TECHNOL
COMPUTER SCIENCE & TECHNOL
COMPUTER SCIENCE & TECHNOL
COMPUTER SCIENCE & TECHNOLOG
OG
OG
OGYYYYY
OG
www.computerscijournal.org
June 2013, Vol. 6, No. (2): Pgs.61-65 An International Open Free Access, Peer Reviewed Research Journal
Published By: Oriental Scientific Publishing Co., India.Oriental Scientific Publishing Co., India.Oriental Scientific Publishing Co., India.Oriental Scientific Publishing Co., India.Oriental Scientific Publishing Co., India.
INTRODUCTION INTRODUCTION INTRODUCTION INTRODUCTION INTRODUCTION
Graphs are data structures composed of nodes and links, representing complex relationships and are typically used to model data from complex applications. The various associations between objects in a complex structure are easy to understand and represented graphically. The representation in graph structures preserves the structural information of the original application. As a result, a number of approaches have been developed which have achieved promising results in uncovering interesting patterns in biological networks, social networks1
and the World Wide Web2. Graph mining, as
opposed to transaction mining (association rules, decision trees and others) is suitable for mining structural data. Graph mining is certainly appropriate for mining on chemical compounds, proteins, DNA etc.
Many researchers have developed various algorithms on graph mining. Some of them
Graph Construction Based on Data Base of Movie Objects
Graph Construction Based on Data Base of Movie Objects
Graph Construction Based on Data Base of Movie Objects
Graph Construction Based on Data Base of Movie Objects
Graph Construction Based on Data Base of Movie Objects
ISRAA HADI
ISRAA HADI
ISRAA HADI
ISRAA HADI
ISRAA HADI and
and
and
and SAAD TALEB HASSON
and
SAAD TALEB HASSON
SAAD TALEB HASSON
SAAD TALEB HASSON
SAAD TALEB HASSON
(Received: May 20, 2013; Accepted: June 07, 2013)
ABSTRACT ABSTRACTABSTRACT ABSTRACT ABSTRACT
This paper aims to develop new techniques to construct a graph structure to represent the relation between the objects in movie film. The main approach includes a mechanism for many steps, first step is the Data Base Construction , which create a table consist record for each frame, and each record contain entities such as area, Perimeter, and other parameters. The second step is to calculate the number of features for any object in each frame depending on the parameters in the data base. While the third step constructs a graph structure that represent a base on the features of the objects.
Key words: Key words: Key words: Key words:
Key words: Graph mining, Data mining, Movie Graph mining
are discussed in this paper. In the beginning, Ullmann3 introduced an algorithm for subgraph
isomorphism. This algorithm attains efficiency by inferentially eliminating successor’s nodes in the tree search. cook and holder4 discovering a new
version of their SUBDUE substructure system based on minimum length principal. Yen and Chen5
proposed graph based algorithm DLG, to efficiently solve the problem of mining association rule. Inokuchi, Washio and Motoda6 proposed a
novel approach name AGM to efficiently mine the association rule among the frequently appearing substructure in a given graph dataset. Huan, Wang and Prince7 proposed a novel subgraph
mining algorithm FFSM, which employs a vertical search scheme.
Data Base Construction Data Base Construction Data Base Construction Data Base Construction Data Base Construction
In order to construct the data base for the movie frames, a table consist record for each frame was created. This record contains the following entities
follows.
...(1)
where O[ i , j ] represents the object pixels (binary 1). The area is thus computed as the total number of objects pixels in the object.
2 Perimeter entity which obtained by counting the number of boundary pixels that belong to an object.
3 Center entity which calculated by the following equation.
...(2) where xc and yc are the coordinates of the centroid of the object and A is the area of the object.
4 Orientation entity which calculated as follows :
The most convenient procedure for the calculation is to dd up a set of summations as listed in Equation (3).
...(3)
Once these sums have been accumulated for the feature, the net oments about the x- and y-axes and the angle of the minimum moment are calculated as shown in Equation 10.7.
Fourth step Graph Construction Fourth step Graph Construction Fourth step Graph Construction Fourth step Graph Construction Fourth step Graph Construction
This step was used to obtain the relationship between the objects in each frame, the graph which representing each frame is a Feature Adjacency Graph (FAG). In FAGs, the objects in a frame are the nodes of the graph, and an edge exists between two nodes if there exist a similarity measurements between there features.
This step is also used to calculate the number of features for any object in each frame depending on the parameters in the data base and these Features as follows:
1 Fixed motion.
2 Fixed motion with fast Rotation. 3 Fixed motion with slow Rotation. 4 Fast Horizontal with Fast Vertical motion. 5 Fast Horizontal with slow Vertical motion. 6 Fast Horizontal motion with Rotation. 7 Fast Horizontal with Fast Vertical motion with
Rotation.
8 Fast Horizontal with Slow Vertical motion with Rotation.
9 Slow Horizontal with Fast Vertical motion. 10 Slow Horizontal with Slow Vertical motion. 11 Slow Horizontal motion with Rotation. 12 Slow Horizontal with Fast Vertical motion with
Rotation.
13 Slow Horizontal with Slow Vertical motion with Rotation.
14 Fast Vertical motion with Rotation. 15 Slow Vertical motion with Rotation.
To calculate any one of the above features, we construct a table for any object which contains spatial variables like Dx, Dy and Dtheta. Where Dx represent the difference in the motion in horizontal direction of an object in the current frame and its previous, and can be calculated as follows:
Dx =| Xcenter(frame i) – Xcenter(frame i-1)| … (5)
Dy represent the difference in motion in the vertical direction of an object in the current frame and its previous, and can be calculated as follows:
Dtheta represents the difference in the orientation of an object in the current frame and its previous, and will be calculated as follows:
Dtheta= |orientation(frame i) - orientation(frame i-1)| … (7)
The following algorithm calculates the above features which used to construct the graph representation of objects in each frame, with regard that the first frame is the initial state and the algorithm dos not calculate the features for this frame. Note that the transition process which used in the algorithm compares the values of the parameters in current frame with previous if the difference greater than threshold then the transition counter is increased by 1 else is 0.
Algorithm of Feature Extraction Algorithm of Feature Extraction Algorithm of Feature Extraction Algorithm of Feature Extraction Algorithm of Feature Extraction Input : Dx vector, Dy Vector, Dtheta Vector. Output Set of the features.
Begin
For fr =2 to No._of_Frames do For ob =1 to No_of_Objects do Begin
− Calculate the spatial variables ( Dx, Dy, Dtheta ) for each object in the current frame. − Calculate the transition counter (Fix, Hor, Ver,
Rot) to indicate the direction and rotate motion for each object by comparing DX, Dy and Dtheta with thresholds to obtaine the features of the objects.
− Calculate the temporary type of feature for the object in current frame based on the value of transition counter by comparing it with thresholds.
− Calculate the features for each object in current frame by save these features in Vector of Feature named as Feature_vector [ob, k], where k feature index to be used in graph construction algorithm.
End{End For ob}
Call Algorithm of Graph_Construction . End { End For fr }
End { End Algorithm }
The following example in Table ( 1) illustrates the transition values of data vector. Fig1 Vector of data with horizontal counter
After each iteration the above algorithm was obtain Vector of feature for each object in the current frame, each vector contain the above fifteen features, and the following algorithm which called Graph Construction that matching two vectors of two objects (each object represent node in graph) by testing each features with value 1 in one vector with its correspond in another vector, if there exist number of matching then there is a link between the two object in graph.
Algorithm of Graph_Construction Algorithm of Graph_Construction Algorithm of Graph_Construction Algorithm of Graph_Construction Algorithm of Graph_Construction Begin
For ob =1 to No_of_object-1 do For j = ob+1 to No_of_object For K=1 to 15 do
If Feature_vector[ob, k]=1 and Feature_vector [j, k] =1 then count = count +1 If count > threshold_link then edge between object[ob] and object[j]
End { End Algorithm }
The following example in table(2) illustrates the objects and their features.
Table (2) Example of features values
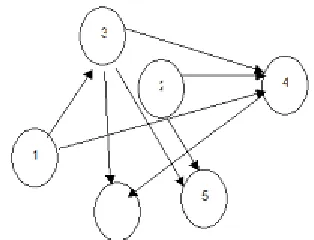
The following table illustrate the values of count between the objects with threshold_link=6 .
Table (3) Example of the relation between objects
TO apply this Algorithm of Graph_Construction one can obtain the following graph which illustrated in Fig 1.
Features Features Features Features
Features O b 1O b 1O b 1O b 1O b 1 O b 2O b 2O b 2O b 2O b 2 O b 3O b 3O b 3O b 3O b 3 O b 4O b 4O b 4O b 4O b 4 O b 5O b 5O b 5O b 5O b 5 O b 6O b 6O b 6O b 6O b 6
1 Fixed_motion 1 1 0 0 1 0
2 Fixed_Rot_fast 0 1 0 0 1 1
3 Fixed _ Rot_slow 0 1 0 0 1 1
4 Fast 0 1 0 1 0 1
5 Hor_fast _Ver_slow 1 0 1 1 0 1
6 Hor_fast_Rot 1 0 1 1 0 1
7 Hor_Ver_fast_Rot 1 0 1 1 0 1
8 Hor_fast_Ver_slow_Rot 0 1 1 1 0 1
9 Hor_slow_Ver _fast 1 1 1 1 0 0
10 Slow 1 0 1 1 0 0
11 Hor_slow_Rot 1 0 1 1 1 0
12 Hor_Ver_slow_Rot 0 0 1 1 1 1
13 Hor_slow_Ver_fast_Rot 1 1 1 1 1 0
14 Ver_fast_Rot 1 1 1 1 1 0
15 Ver_slow_Rot 0 1 1 1 1 1
Sum of feature with 1 value 9 9 10 12 8 9
TTTTTable 2 :Example of features valuesable 2 :Example of features valuesable 2 :Example of features valuesable 2 :Example of features valuesable 2 :Example of features values O b 1 O b 1O b 1
O b 1O b 1O b 2O b 2O b 2O b 2O b 2 O b 3O b 3O b 3O b 3O b 3 O b 4O b 4 O b 5O b 4O b 4O b 4 O b 5O b 5O b 5O b 5 O b 6O b 6O b 6O b 6O b 6
O b 1 O b 1O b 1
O b 1O b 1 4 8 8 4 3
O b 2 O b 2O b 2
O b 2O b 2 5 6 6 5
O b 3 O b 3O b 3
O b 3O b 3 11 7 6
O b 4 O b 4O b 4
O b 4O b 4 5 7
O b 5 O b 5O b 5
O b 5O b 5 4
TTTTTable 3: Example of the relationable 3: Example of the relationable 3: Example of the relationable 3: Example of the relationable 3: Example of the relation between objects
between objects between objects between objects between objects
Frame No. Frame No. Frame No. Frame No.
Frame No. 1 2 3 4 5 6 7 8 9 10 11 12 D
D D D
Dxxxxx 0 0 0 1 2 2 0 2 5 0 2 Horizontal
Horizontal Horizontal Horizontal
Horizontal 0 0 0 1 2 3 3 4 5 5 6 Counter
Counter Counter Counter Counter
TTTTTable 1: illustrates the transition valuesable 1: illustrates the transition valuesable 1: illustrates the transition valuesable 1: illustrates the transition valuesable 1: illustrates the transition values of data vector
of data vectorof data vector of data vector of data vector...
1. M. Mukherjee and L. B. Holder. Graph-based data mining for social network analysis. In Proceedings of the ACM KDD Workshop on Link Analysis and Group Detection, (2004).
2. A. Rakhshan, L. B. Holder, and D. J. Cook. Structural web search engine. In FLAIRS Conference, pages 319-324, (2003). 3. J. R. Ullmann, An algorithm for subgraph
isomorphism. J. ACM, 23, pp. 31-42 (1976) .
4. Holder, L. B. Holder, Cook, D. J. Cook, Djoko, S. Djoko, "Substructure Discovery in the SUBDUE system", In Proc. AAAI'94 Workshop
knowledge Discovery in Databases (KDD'94 ,(pp 169-180 (1994).
5. S.J. Yen and A.L.P. Chen. "An Efficient Approach to Discovering Knowledge from Large Databases". In Proc. Of the IEEE/ACM International Conference on Parallel and Distributed Information Systems, Pages 8-18 (1996).
6. A. Inokuchi, T. Washio, H. Motoda, "An Apriori-based Algorithm for Mining Frequent substructures from Graph Data". In proc. 2000 European Symp. Principle of Data mining and knowledge Discovery (PKDD'00), pp. 13-23 (1998).
7. J. Huan, W. Wang and J. Prins, "Efficient Mining of frequent Subgraph in the Presence of Isomorphism". In Proc. 2003 int. conf. Data mining (ICDM'03), pp. 549-552.(2003).
8. Qiang Wu, Fatima A. Merchant, Kenneth R. Castleman, " Microscope Image
Processing", Elsevier Inc, (2008).
9. Tinku Acharya, Ajoy K. Ray; "Image Processing Principles and Applications", John Wiley & Sons, (2005).