Urbanisation and Development in South-east Asia
Gavin W. Jones* National University of Singapore
Abstract:This paper deals with three issues. It begins by alerting the reader to the considerable problems of measurement that bedevil the study of urbanisation, and these problems are not confined to South-east Asia alone. Lack of awareness of these measurement issues can lead to incorrect assessments of trends in urbanisation, and in some cases inappropriate policy recommendations. It then proceeds to discuss the growth of mega-urban regions, and appropriate ways of analysing trends in such regions, recommending the use of zonal analysis to better understand the dynamics of change in these complex regions. The approach is shown to yield important findings for the largest cities in East and South-east Asia, as well as for one Indian city studied – Mumbai. Finally, the paper raises various issues regarding the uniqueness or otherwise of South-east Asian patterns of urbanisation, and the political economy of urbanisation trends in the region.
Key words: Agglomeration, conurbation, development, metropolitan, urban areas, urbanisation.
JEL classification: R110, R58, O18
1. Trends in Urbanisation in South-east Asia
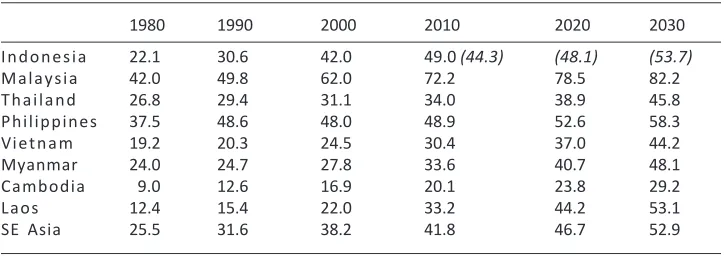
South-east Asia is one of the world’s least urbanised regions (see Table 1). Aside from Singapore, which is 100% urban, only Malaysia and recently, Indonesia, have officially passed the point where 50 per cent of their population lives in urban areas. However, these statistics are misleading, in two ways. First, the official definitions of urban areas differ considerably from country to country, and in some cases understate the proportion of population living in what most observers would consider to be urban areas. This will be discussed more in the following paragraphs. Second, the spread of urban lifestyles and influences to areas classified as rural is profound, and means that rural areas are very different from what they were a few decades ago (Jones 1997: 239-41).
2. Definitional Issues
Boundary issues bedevil all aspects of the analysis of urbanisation. This will be discussed later in the paper in relation to mega-urban regions. But the issue applies to smaller cities as well. For example, an earlier study on Thailand showed that cities such as Chiangmai and Hat Yai-Songkhla were larger than indicated by their official populations (Jones et al. 1996). In other cases, the population of small cities can be exaggerated by official boundaries. This was the case for Sihanoukville and Pailin in Cambodia, before the urban definitions were changed for the 2008 Population Census (Jones 2004: 121).
In a recent paper, my colleagues and I have conducted an exercise in which we attempted to find more comparable estimates of the level of urbanisation in the world’s countries (Alkema, Jones and Lai 2013). Our method was based on the assumption that the national definitions of urbanisation represent the “true” proportion of urban (PU), with measurement errors caused by definitional issues. To construct alternative estimates which are more comparable between countries, we regressed the proportion urban against variables expected to have a relationship to urbanisation, as well as indicators of whether the urban definition used within the country is generous, neutral or restrictive compared with other countries. The three covariates finally used, after testing a number of others as well, were GDP per capita (on log-scale), proportion of employment in agriculture, and population density.
A key basis for our exercise was that it seems inherently unlikely that countries with higher income levels and a higher proportion of the workforce engaged in non-agricultural activities would have lower levels of urbanisation than poorer countries with a larger share of employment in agriculture. Thus one might expect Thailand to have a higher level of urbanisation than Indonesia or the Philippines (on the basis of its higher income levels, though not on the basis of the percent of employment in agriculture),1 but this is
not what the official statistics show. In our study, Thailand indeed showed up as lying below the lower bound of our estimates of the real level of urbanisation. (For 2000, our alternative estimate was 44 per cent, compared with the official 31 per cent). The main reason seems to be the more restrictive definition of urban areas used in Thailand. Actually, before 1999, Thailand’s urbanisation level was even more seriously understated, because only municipalities were considered to be urban areas, while sanitary districts, some of which have populations as large as 20,000 were excluded from the urban population. In 1989, a major administrative reorganisation took place, whereby all sanitary districts were upgraded to municipal status, raising the total number of municipalities from 131 to 1,081. Although the upgrading of these sanitary districts
Table 1. Trends in urbanisation, South-east Asian countries, 1980-2030
1980 1990 2000 2010 2020 2030
Indonesia 22.1 30.6 42.0 49.0 (44.3) (48.1) (53.7)
Malaysia 42.0 49.8 62.0 72.2 78.5 82.2
Thailand 26.8 29.4 31.1 34.0 38.9 45.8
Philippines 37.5 48.6 48.0 48.9 52.6 58.3
Viet n a m 19.2 20.3 24.5 30.4 37.0 44.2
Myanmar 24.0 24.7 27.8 33.6 40.7 48.1
Cambodia 9.0 12.6 16.9 20.1 23.8 29.2
Laos 12.4 15.4 22.0 33.2 44.2 53.1
SE Asia 25.5 31.6 38.2 41.8 46.7 52.9
Source: UN Population Division (2011). The Indonesian figures for 2010, 2020 and 2030 are in brackets because they are clearly too low compared with the measured 2010 census figure of 49.0.
1 According to labour force surveys in 2008, Thailand had a slightly higher proportion of its workforce
served to raise the estimate of Thailand’s urbanisation to 31 per cent, this still tended to underestimate Thailand’s real level of urbanisation, because the tambon (sub-district) administrative areas continue to be designated rural, although some of them, especially those just outside municipalities, have distinctly urban characteristics (Jones 2004: 115-117).
A more spectacular example of a country whose official level of urbanisation is well outside expected limits, however, is Sri Lanka. Sri Lanka is not only one of the most extreme outliers in our recent study, but is a case where the recorded level of urbanisation in 2000 was actually lower than it was 40 years before. Sri Lanka’s recorded level of urbanisation rose gradually from 15.3 per cent in 1953 to 22.4 per cent in 1971. Thereafter, it fell slightly to 21.5 per cent in 1981, and more sharply to 14.6 per cent in 2001. (The UN estimate for 2000 was 15.8 per cent). Such a fall is inherently unlikely, in a country that is gradually industrialising, albeit slowly; the alternative estimate based on our model is 40.2 per cent. Further investigation reveals that there are two main reasons for the low official estimate for 2000: (1) part of the country was not included in the later estimates, because of civil war; (2) following an administrative reorganisation, the definition of urban areas was changed drastically to exclude the former town councils. The latter is almost certainly the main reason for the discrepancy (Alkema, Jones and Lai 2013: 300).
3. Trends in Distribution of Urban Population by Size Class
About half of Asia’s urban population lives in towns and cities with populations below half a million (see Table 2). If we go behind the regional figures and focus on two South-east Asian countries – Indonesia and Malaysia – some interesting facts emerge. Table 3 shows the percentage distribution of the urban population in the two countries by city size class.
What are the interesting points to emerge from this table? First, the proportion in different urban size class groups fluctuates when cities move from one size class to another (as when Jakarta moved into the 5 million plus class size in 1980). Malaysia does not yet have any city in the 5 million plus class range, at least not when the Federal Territory boundary is used to measure the population of Kuala Lumpur.
Both countries appear to be well above the Asian average in the share of small towns and cities (i.e. less than 500,000) in their overall urban population distribution. In Malaysia, this proportion has moved down over time, whereas in Indonesia, it has moved up over time; in 2010, the proportions were 70 and 74 per cent respectively, well above the proportion for Asia as a whole (round about 50 per cent). However, in both
Table 2. Percentage distribution of Asian urban population by five population size groups
<500,000 500,000 to 1 to 5 million 5 to >10 million
1 million 10 million
1975 49 13 25 8 5
2000 50 11 23 6 10
2015 48 10 23 8 11
cases, this proportion would fall sharply if the reality of mega-urban regions (MURs) were taken properly into account, as will become clearer in the next section of the paper.
3.1 The Example of Indonesia
In Indonesia, the number of urban localities increased from 12,351 in 2000 to 15,786 in 2010, thus increasing the proportion of urban localities to total localities from 17.96 per cent to 20.46 per cent (Firman 2013: 3). The million cities all grew more slowly than the national population, with the exception of Bekasi, Tangerang, Depok and Makassar. The first three of these are all located in Jakarta’s mega-urban region, and the increase for this region as a whole was certainly above the national population growth rate. Likewise, for Bandung, the growth rate of the city was only 1.1 per cent per annum over the decade, but the surrounding areas grew more rapidly – Kabupaten Bandung, 2.5 per cent; Kota Cimahi, 2.06 per cent; and Kabupaten Bandung Barat, 1.99 per cent.
Some smaller Indonesian cities have not shown any significant growth. A recent World Bank study, reported on by Firman (2013), finds that intermediate cities with populations in the range of half to one million have reaped the best agglomeration economies, while those with populations between 100 thousand and 500 thousand and smaller urban centres have performed the least well, experiencing declining productivity, in some cases negative population growth and decline in per capita GDP. It is argued that this is because they lack infrastructure and skilled labour and have poor market access to major cities and ports.
The traditional function of small cities in Java (defined as those with populations of less than half a million) is as centres for collection and distribution of goods. Overall, the small cities in Java developed rather slowly between 2000 and 2010, with populations growing more slowly than the national population growth rate. Cities such as Tegal, Magelang and Madiun have barely grown at all; Yogyakarta has lost population (though perhaps this is related to urban overspill). However, the situation may be distorted
Table 3. Percentage of urban population in four population size groups
Size group 1970 1980 1990 2000 2010 2020 2025
Malaysia
5+ million 0 0 0 0 0 0 0
1-5 million 0 0 12 9 13 18 18
500,000- 0 16 0 12 17 16 16
1 million
<500,000 100 84 88 78 70 65 66
All sizes 100 100 100 100 100 100 100
Indonesia
5+ million 0 18 15 10 9 8 8
1-5 million 33 18 16 12 12 11 11
500,000- 9 8 6 5 5 6 6 1 million
<500,000 58 56 63 73 74 75 75
All sizes 100 100 100 100 100 100 100
slightly by the lack of information on non-municipality cities, some of which have populations exceeding 100,000.
Outside Java, however, small cities grew more rapidly than in Java. The most spectacular example is Batam, a short ferry ride away from Singapore, which grew by 11.7 per cent per annum. Other examples include Sorong (9.7%), Jayapura (6.5%), Tarakan (6.4%), Pekanbaru (5.4%), Den Pasar (5.1%), Dumai (4.7%), Kendari (4.5%), Bontang (4.4%), Samarinda (4.0%) and Balikppapan (3.7%). Firman (2013: 13) argues that this suggests that small and medium cities outside Java play a more important role as centres of economic activities, most notably natural resource exploitation (mining, oil, timber, and palm oil), than in Java. Of course, in the case of Den Pasar, tourism is the main driving force in its growth.
3.2 The Example of Malaysia
The unsatisfactory state of comparative data on urban agglomerations in many countries is well illustrated by the example of Malaysia, and its primate city, Kuala Lumpur. Kuala Lumpur cannot really be discussed without reference to Singapore, which for a brief time was part of Malaysia, but for 48 years has been an independent neighbouring country. Looking back five decades, Singapore was a much larger city than Kuala Lumpur, but after the split with Malaysia in 1965, Singapore to some degree lost its Malaysian hinterland. Thus its growth has not been as rapid as that of Kuala Lumpur, though this growth has accelerated more recently as a result of considerable net immigration, both permanent and temporary. The Singapore-Kuala Lumpur comparison will be elaborated later in the paper.
Kuala Lumpur’s growth has been very rapid indeed, as it draws migrants from all over Malaysia as well as from overseas, particularly Indonesia. The mega-urban region centred on Kuala Lumpur today has a population of approximately 6.1 million, most of it residing in the adjoining state of Selangor. But the United Nations Population Division(2011) still uses Kuala Lumpur’s official boundary (i.e. the Federal Territory) to delineate its urban agglomeration. The problem with this is that Kuala Lumpur is a dramatically under-bounded city. Driving into Selangor state from Kuala Lumpur is simply a matter of moving from one part of the inner suburban area of the city into another. Indeed, the Selangor State government tried to bring greater awareness of the fact that motorists were entering its territory by building a major archway across the highway at the point of entry – the only sign of discontinuity in the urban landscape the motorist is traversing. Thus, the United Nations figure for Kuala Lumpur urban agglomeration in 2010 is 1.5 million, compared to the reality of about 6.1 million.
primary city population to the national population, at different levels of economic development. The two striking exceptions to the general pattern – whereby this percentage rises steeply, and then levels off at higher levels of GDP per capita – are Warsaw from 1850 to 2000, and Kuala Lumpur from 1900 to 2000. I do not know the explanation in the case of Warsaw, but in the case of Kuala Lumpur, the reason is solely the use in the World Bank study of the misleading official figures for Kuala Lumpur, showing Kuala Lumpur holding about 7 per cent of Malaysia’s population, whereas the actual figure – approximately 20 per cent – is much more in line with the figures for most of the countries at similar levels of economic development.
Another example of the misleading analysis that can arise when using official data on urban areas is with regard to Malaysia’s urban hierarchy. The World Bank (World Bank 2009: 51-57) makes much of Zipf’s rank-size rule as “almost a law” based on the analysis of the “portfolio of settlements of different sizes” found universally. In Malaysia, the hierarchy of urban places is frequently listed, but used in a way that misinterprets reality. For example, a list of the 10 largest cities based on population within local government areas in 2010 shows Kuala Lumpur as the largest, and six of the others lie within 30 kilometres of downtown Kuala Lumpur. They include two cases (Klang and Kajang) where pre-existing towns have become linked to Kuala Lumpur through a continuously built-up belt and four others (Petaling Jaya, Shah Alam, Subang Jaya and Selayang) where city or municipality status was awarded to areas that grew to accommodate the suburban sprawl of the growing metropolis. When these populations are added to the official Kuala Lumpur population, the 3-city primacy index for Malaysia rises from 1.03 to 2.95.2
Malaysian urban and regional planners, of course, are well aware of the real magnitude of Malaysia’s major cities. The Federal Department of Town and Country Planning in its National Physical Plan, published in 2005, has projections for the three largest conurbations reaching substantial populations in 2020: 8.46 million in the case of Kuala Lumpur, 2.42 million in the case of Penang, and 1.84 million in the case of Johor Bahru.
4. Analysis of Mega-Urban Regions – Importance of Zonal Analysis
It is very easy to misunderstand the dynamics of growth of large agglomerations by relying on analyses of growth of population within static boundaries.3 A situation foundhistorically in many cities is that at some point in time, as the city grows, a decision is made to widen its boundary considerably to encompass areas that are likely to be absorbed by the city as it expands. But in time, particularly as the expansion of the
2 This near-trebling may be exaggerated, as the population of the next two largest towns – Johor Bahru
and Ipoh – may also need to be increased somewhat to show their true metropolitan populations. More importantly, Penang would replace Ipoh as the third largest city if a true metropolitan population were used for Penang. But I believe this effect would be smaller than in the case of Kuala Lumpur.
transportation network makes commuting over longer distances practicable, even this expanded boundary is found to be too narrow to capture the ongoing growth.
Figure 1 shows in stylized form what happens when the first stage of metropolitan growth is simply the expansion of suburban developments into rural parts of the broadly bounded metropolis, thus capturing both slow inner city growth and rapid suburban growth; and in the second stage expands beyond this boundary, meaning that growth in the official metropolis understates real growth. This is precisely what happened in both of the two largest MURs in Southeast Asia - Jakarta and Manila. They both enlarged their official boundaries (for Jakarta, in 1961, to encompass the Daerah Khusus Ibukota or the special district of the capital city (DKI); for Manila, in 1975, to encompass Metro Manila); in both cases, this enlarged area encompassed what at the time included the city population and a zone available for expansion. Thus for a time, urban sprawl was captured within the official metropolitan boundary, and the recorded growth rate of the city was rapid. But after a time, the official metropolitan area was almost fully built up, and high land prices, urban unrest and expansion of transportation facilities led to a flight of industry and population to the more distant suburban areas. This action was no longer captured by population figures for the metropolitan area, which showed a sharp contraction in growth.
In the case of Kuala Lumpur, the city boundaries were not enlarged, as they were for Jakarta and Manila, so at quite an early stage, the urban sprawl was taking place entirely outside the official boundaries. Thus the “urban agglomeration” figure for Kuala Lumpur reported by the United Nations barely increased from 1.120 million in 1990 to 1.519 million in 2010, a rise of only 36 per cent in 20 years; this gave an entirely unrealistic picture of the population growth of the metropolis.
The dynamics of population and employment change over broader mega-urban regions (MURs), then, need to be studied, as was done in a study of a number of Asian MURs over the inter-censal period 1990-2000, utilising unpublished census data in all cases (Jones and Douglass 2008). Among the key findings of this study are that these mega-urban regions continued to increase their share of national populations, though in most cases not of urban populations, and that zones immediately beyond the official metropolitan boundaries are where the most dramatic changes are occurring, as shown in Table 4.
Particular interest is attached to the population growth rates in the core, which in most cases is defined to include the official metropolitan area. There is considerable variation in growth rates within this substantial core, which exceeded 600 sq. km. for four of these cities – Jakarta, Bangkok, Manila and Shanghai. In Taipei, Jakarta and Bangkok, the increase is very slow, indeed negative in the case of Taipei. Shanghai, Bangkok and Taipei have very low fertility rates (Jones and Douglass 2008: Table 2.1), and Jakarta and Taipei experienced considerable net outmigration from the core. However, the population growth rate remains quite high in Manila, HCMC and Shanghai, in each of which it is above the rate of population increase for the country as a whole. The reasons differ – in Manila, fertility rates remain quite high, and are supplemented by in-migration, whereas in Shanghai, growth would be negative but for the impact of in-migration from many parts of China.
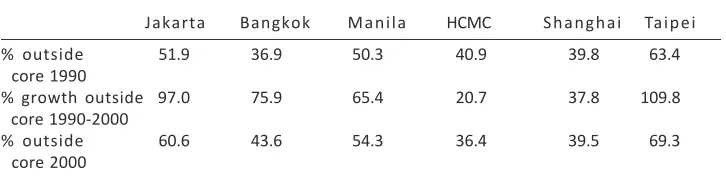
Within the cores, there was a tendency for a significant redistribution of population from the overcrowded central urban districts to the outer part of the core. Even in Manila and Shanghai, where the populations of the core grew substantially, the populations of some central districts in the core shrank: in Manila’s core, Pasay City shrank slightly and San Juan has risen and then fallen again since 1980; in Shanghai’s core, the population of the three central districts fell by 36 per cent over the 1990s.
Table 4 also indicates that in the case of four of the cities – Jakarta, Bangkok, Manila and Shanghai – the key population growth was in the inner zone, not the core. Table 5 shows that over the 1990-2000 period, essentially the entire growth of the Jakarta and Taipei MURs took place outside the core. The inner zones of these MURs gained population both from net migration from the core and net migration from other parts of the country. Net migration from the core was essentially a re-location of people (mostly families rather than individuals), industry and institutions from the core to the inner zone). Net migration from other parts of the country was more the traditional movement to the metropolis, but settling in the inner zone instead of the core. Population density in the inner zone ranged from 1,248 per sq. km. in Bangkok to 5,532 in Taipei. The high density in Taipei’s inner zone reflects the small area of its core, so that its inner zone shares some of the characteristics of the core in the other MURs. But even in Jakarta’s extensive inner zone, population density averaged 3,975 per sq. km. In all cases, inner zone densities will have increased greatly by now.
Table 4. Basic data on the Asian mega-urban regions, 1990 and 2000
Area Population Density Population
(sq. km) (per sq. km.) growth rate
(av. ann.) 1990-2000
1990 2000 1990 2000
Jakarta
Core 662 8,223 8,347 12,421 12,610 0.2
Inner zone 2,374 5,434 9,435 2,289 3,975 5.7 Outer zone 3,139 3,442 3,407 1,097 1,085 -0.1
Total 6,175 17,098 21,190 2,769 3,432 2.1
Indonesia 1.5
Bangkok
Core 876 5,445 5,876 6,215 6,709 0.8
Inner zone 1,907 1,596 2,380 837 1,248 4.1 Outer zone 4,465 1,593 2,163 348 472 3.1
Total 7,248 8,634 10,419 1,172 1,414 1.9
Thailand 1.4
Manila
Core 633 7,907 9,880 12,551 15,642 2.3
Inner zone 3,105 4,183 6,365 1,345 2,047 4.3 Outer zone 8,323 3,819 5,368 461 648 3.5
Total 12,061 15,909 21,613 1,324 1,641 3.1
Philippines 2.1
Ho Chi Minh City
Core 170 2,320 3,203 13,647 18,841 3.8
Inner zone 617 904 1,078 1,465 1,747 1.9 Outer zone 1,308 700 756 535 578 0.8
Total 2,095 3,924 5,037 1,873 2,404 2.8
Vietnam 1.7
Shanghai
Core 605 8,027 9,934 13,267 16,415 2.1
Inner zone 1,753 2,207 3,292 1,259 1,871 4.0 Outer zone 3,944 3,108 3,182 788 808 0.2
Total 6,302 13,342 16,408 2,117 2,603 2.0
China 1.1
Taipei
Core 272 2,730 2,624 10,047 9,655 -0.4
Inner zone 890 3,993 4,923 4,486 5,532 1.9 Outer zone 2,516 733 995 291 395 2.6
Total 3, 678 7,456 8,542 2,027 2,322 1.3
Taiwan 0.9
Note: Ho Chi Minh City populations are for 1989 and 1999.
Table 5. Non-core regions of the MUR: share of MUR population 1990 and 2000 and share of MUR population growth 1990-2000
Jakarta Bangkok Manila HCMC Shanghai Taipei
% outside 51.9 36.9 50.3 40.9 39.8 63.4
core 1990
% growth outside 97.0 75.9 65.4 20.7 37.8 109.8
core 1990-2000
% outside 60.6 43.6 54.3 36.4 39.5 69.3
core 2000
Source: Jones and Douglass (2008: Table 3.2).
Table 6. Share of MURs in national populations (%)
Jakarta Bangkok Manila HCMC Shanghai Taipei
1990 9.4 15.8 26.1 5.9 1.2 37.5
2000 10.0 16.6 28.6 6.4 1.3 39.1
Source: Jones and Douglass (2008: Table 3.3).
of accumulation of power, wealth and economic activity tend to show even stronger concentration in the MURs (Jones and Douglass 2009: Table 2.3), consistent with the analysis in World Bank (2009).
On the other hand, the MUR growth rate has not been as rapid as that of the urban population as a whole. This is the case whether the MUR growth is considered to be that of the core alone, or the core plus inner zone, or the core plus inner and outer zones (see Jones and Douglass 2008: Table 3.4). Further analysis is needed to ascertain which categories of urban areas in these countries are growing most rapidly.
4.1 “Urban Agglomeration”Estimates
Given the way the core, inner zone and outer zones have been defined, the sum of the core and inner zone populations is likely to give the best estimate of the urban agglomeration. This yields the following populations for 2000:
Jakarta – 17.782 million Manila – 16.245 million Shanghai – 13.226 million Bangkok - 8.256 million
These are massive populations, and if compared with other urban agglomeration figures produced by the United Nations Population Division for the same year, Jakarta and Manila would occupy 4th and 6th rank respectively in the list of the world’s urban
populations accorded them in the United Nations rankings. But the point to be made is that Jakarta and Manila in particular are much larger urban agglomerations than the United Nations figures indicate. In the case of Shanghai, our figure would place it 7th in
the world listing, not very different from the 9th ranking it received for the same year in
the UN list.
While some observers might be surprised that Bangkok MUR has only half the population of Jakarta or Manila, it is clear that Bangkok is indeed a smaller MUR. Alternative ways of adjusting its boundaries could add up to a few million to its population, but certainly not enough to reach the populations of the Jakarta or Manila MURs.
4.3 Comparison with Mumbai
It would be very desirable to extend the Jones-Douglass analysis to major metropolitan regions of China besides Shanghai, and to Indian metropolitan regions. A step in this direction has been taken in a recent study on Mumbai (Bhagat and Jones 2013). Some comparative findings are shown in Table 7.
Mumbai’s urban agglomeration estimate for 2000 (16.368 million) was slightly larger than Manila’s and slightly smaller than that of Jakarta. It has increased further to 18.414 million in 2011, compared with a figure somewhere between 17.8 million and 28.0 million in Jakarta’s urban agglomeration.4 As can be seen in Table 7, Mumbai’s Table 7. Comparison of Mumbai with some large Asian mega-urban regions: population
of core, and population density in different zones, 2000
Mega- Core Density of Density of Density of
urban inner zone outer zone entire
region MUR
Population Area Density (‘000) (sq. km.)
Mumbai* 11,970 603 19,758 8,250 1,071 4,549
Jakarta 8,347 662 12,610 3,975 1,085 3,432
Manila 9,880 633 15,642 2,047 648 1,641
Bangkok 5,876 876 6,709 1,248 472 1,414
Shanghai 9,934 605 16,415 1,871 808 2,603
* Data for 2001
Source:For Jakarta, Bangkok, Manila and Shanghai, Jones and Douglass (2008: Table 3.1). For Mumbai, Bhagat and Jones (2013: Tables 1 & 4.)
Inner zone includes: for Mumbai, the Municipal Corporation of Greater Mumbai (MCGM); for Jakarta, the DKI Jakarta; for Bangkok, most of the Bangkok Metropolitan Administration (BMA) plus part of Nonthaburi Province; for Manila, Metro Manila; for Shanghai, Districts 1-9, plus densely settled parts of surrounding districts contiguous to the nine districts.
4 The reason for the wide difference in these estimates is that the first included only the population
population density in the core was higher than that in Jakarta, Manila, Bangkok or Shanghai. However, the key contrast between Mumbai and the other MURs was in the inner zone, where population density in Mumbai was far higher than in other megacities. This indicates that the densely populated area in Mumbai spreads much further from the city centre than is the case of any of the other cities.
The density in the outer zone in Mumbai is comparable to that in Jakarta, and higher than in any other of the cities compared. Mumbai’s population density in the entire mega-urban region (the MMR) in 2011 was well over 5000 persons per sq km - one of the highest (possibly the highest) in the world (Jones and Douglass 2008: 52; Urban Age 2007: 24).
Interestingly, the case of Mumbai is consistent with the generalisations made earlier. In the 2001-2011 period, the growth of the core was well below the growth of the national population, but the growth of the Mumbai MUR as a whole was more rapid than the national population growth rate, though slower than the overall urban population growth rate.
5. The Developing Singapore-Kuala Lumpur Bi-Polar Mega-Urban
Corridor
It is worth taking an even broader perspective on the growth of what we might refer to as “mega-urban belts” or “mega-urban corridors” connecting large cities, as they relate to South-east Asia. In embryonic form, at least, a number of these can be discerned in Java. By far the largest of these is the Jakarta-Bandung belt, the development of which has been facilitated by the completion in 2005 of a major freeway that cuts the road travel time from Jakarta to Bandung to about 2½ hours (though traffic jams develop at weekends at the exit from the toll road in the Bandung outskirts, thus lengthening the total travel time to destinations in Bandung). Development of other belts can be observed between Surabaya and Malang, Semarang and Yogyakarta and Cirebon and Semarang (see Firman, Kombaitan and Pradono 2007; Firman 2011).
But here I would like to develop the idea of an emerging Singapore-Kuala Lumpur corridor, linking two great cities (and their mega-urban regions) located only 315 km. apart.
can therefore be thought of as part of an international mega-urban region. The development of the Iskandar Development Region in Johor is boosting the growth of Johor Bahru and linking it more closely with Singapore.
Turning to the Kuala Lumpur end of this linear mega-urban region, its population is already 6.2 million according to the 2010 Census. We can observe the makings of a linear urban development linking the Singapore-Johor Bahru mega-urban region through Batu Pahat, Muar, Malacca, Port Dickson and Seremban with the Kuala Lumpur mega-urban region. Until now, although the flight frequency between Singapore and KL is very high (about 50 flights a day in each direction), the lack of a high-speed train has held back the closer integration of the two cities. However, the proposed high-speed train, if it comes to fruition, will push this process along considerably.
In time, it is not unrealistic to think of a bi-polar Singapore-Kuala Lumpur mega-urban corridor with a current population of 15 million and a likely growth to 20 million – a bit like the Jakarta-Bandung one in Indonesia, though that one is already more like 30 million. For the Singapore-Kuala Lumpur corridor, the big difference compared with the situation to date would be that Singapore, though as a world city would be a key driver of the process, would contain less than one-third of the population in this mega-urban corridor.
It is also worth noting that compared with the density figures in Table 4, the cores of both Singapore and Kuala Lumpur are very low density (7,126 per sq. km. and 6,891 per sq. km. respectively, in 2010). These are comparable to Bangkok, but much lower than Jakarta, Manila, Shanghai or Mumbai (see Tables 4 and 7), reflecting very different urban ecologies.
6. Development, Divergent Interests and the Politics of Urban-Rural
Balance
In this final section of the paper, I will select a few issues out of the large number that confront researchers and planners in South-east Asia seeking to understand and to influence the growth of their country’s urban areas. The first is whether South-east Asian cities are different from those in other regions. The second is the appropriate size of the megacity or megacities. The third is the role of intermediate cities. Finally, there is the issue of the politics of urbanisation.
cases of Bangkok and Jakarta, Dick and Rimmer argue that the literature stressing the unique elements of South-east Asian urbanisation (which they rather unkindly categorise as an “inward-looking, specialist literature with its echoes of Orientalism”) is a “misleading guide to understanding the modern development of cities in South-east Asia” (Rimmer and Dick 2009: 48).
Although I greatly admire McGee’s writings, and his influence on urban studies in South-east Asia and beyond, I come down firmly on the side of Dick and Rimmer. They take Jakarta as their key case study, and show that the development of “bundled” cities on its outskirts is an element of globalisation, and that the study of cities in South-east Asia must be “informed by knowledge of urban processes, especially in the United States” (p. 50). Like Webster (1995), I would argue that in this context, Los Angeles might be a more apt model for the way South-east Asian mega-urban regions are developing than the “desa-kota’ paradigm. Incidentally, the suburbanisation of Jakarta has been fuelled partly by the Indonesian government’s long-standing, unsustainable fuel subsidy, reduced (though certainly not eliminated) in 2013, which brought the costs of commuting from far-flung “new towns” surrounding Jakarta within the reach of the middle class and lower middle class to an extent that would not have been possible had the price of fuel reflected its true cost. When the fuel price is finally raised to market rates, this is likely to work to some extent against the urban sprawl that has characterised Jabodetabek’s recent development.
The second issue is the appropriate size of megacities. It is not possible to say that any size is “too large”, particularly given the possibility of polynucleation. As Vining (1985: 30) put it, “The concentration of investment in the core region, which causes the ... (cityward) ... migrational flow, is the most efficient route to increased production”. Similar arguments are put forward by World Bank (2009).
The third issue concerns the role of small and intermediate cities in the growth process. The case for promoting the growth of such cities is well argued by Hardoy and Satterthwaite (1986), though much of the intermediate city literature suffers from imprecision about the mix of policies that would be needed to achieve significant changes in urban development patterns. In any case, in Asia, the intermediate and smaller cities, overall, are growing somewhat more rapidly than the mega-urban regions. However, it is still possible to find cases of smaller cities in decline. In the case of Indonesia, some examples were noted earlier in the paper. There can be many reasons for the failure of a small city to grow – for example, economic decline, perhaps due to the decline of particular industries on which the city depended heavily and the consequent loss of employment; or decline linked to local conflict or the city’s loss of political importance. It is also important to understand the different typologies of intermediate cities, which may have a major bearing on whether they are growing or relatively stagnant. One important element to consider is whether they lie in the extended zone of a mega-urban region.
broader political concern as well. Autocratic governments in the region have typically had to fear the big cities as the locus of the most effective challenges to their power. Students, liberals, as well as criminal elements are concentrated there. Whether it be the potential to challenge the regime’s power through demonstrations or revolution, in the case of autocratic regimes, or through the ballot box, in the case of more democratic regimes, there is reason for governments to fear their big city populations.
A few reminders of this might be in order. In the 1970s and 1980s, the populations of Bangkok, Seoul and Jakarta consistently voted against the government in power. In Bangkok, the 1976 massacre at Thammasat University was followed over the years by a series of major clashes between supporters and opponents of the government currently in power, all of them centred in Bangkok (the most notable occurring in May 1992 and in May 2010). In Manila, the “people power” revolution brought down the Marcos regime; in Jakarta, Suharto’s downfall in 1997 after more than three decades in power was played out on the streets of Jakarta.5 In Myanmar, the demonstrations and crackdown in
Rangoon in 1988 left the military in power for a further two decades, but the riots and brutal crackdown in the same city in September 2007 weakened the military regime’s position, and no doubt contributed to the eventual decision to open up politically.
In Malaysia, with a long-standing democratic system of governance, the forms of protest have never had to be quite as polarising as they were in the examples cited for Korea, Thailand, the Philippines, Indonesia and Myanmar. Nevertheless, the Barisan National power base has always been in rural areas, and the fact that it was able to hold power in the recent elections with a minority of the popular vote reflects both a constitutional favouring of the rural areas and a long-established gerrymander, in which some electorates are far larger (up to 9 times larger) than others. The electorates with small numbers of voters voted overwhelmingly in favour of the Barisan National, while the electorates with large numbers of voters voted overwhelmingly in favour of the Pakatan Rakyat (see Table 8). Table 8 does not include Sarawak and Sabah, where the average number of voters in rural electorates is even smaller.
A major exercise in redrawing and resizing parliamentary constituencies is due this year. Parliament will have to approve the review by the Electoral Commission on which constituencies should be split or merged to better reflect the changing population
Table 8. Seats won by Barisan National and Pakatan Rakyat by size of electorate in Peninsular Malaysia in 2013.
Number of voters Barisan Nasional Pakatan Rakyat Total
50,000 and below 43 1 44
50,000 to 65,000 24 14 38
65,000 to 80,000 9 25 34
More than 80,000 10 40 50
Source: Adapted from Lee (2013: Table 6).
5 Major Indonesian universities had been moved out of major inner-city locations, including in Jakarta,
distribution. If it is to better reflect the changing distribution of the population, this will need to end up with a larger number of urban-based constituencies.
7. Conclusions
Most of the world’s urban growth is taking place in urban areas with populations below half a million. This is not always evident from the media’s heavy focus on problems of growth of very large cities. Much more attention needs to be paid to the role of smaller cities and towns in urban growth in Asia. At the same time, the largest urban agglomerations in Asia play a far larger role in national economic growth than their share of national populations would suggest. A better understanding of the growth and internal dynamics of the largest urban agglomerations, their interactions with their extended hinterlands and their role in national economic growth and socio-cultural development is urgently needed. There are major issues in generating data that will facilitate such an understanding, and giving researchers access to it.
One would like to think that internationally comparative studies of MUR development could be conducted based on the 2010 round of censuses, to examine developments over the first decade of the 21st century. It is hard, though, to be optimistic about the prospects
for such studies. At present, local and national statistical systems are giving inadequate attention to the collection, let alone promoting the utilisation, of the spatially disaggregated data needed to investigate MUR development. (A similar point in relation to many aspects of urbanisation has been made in the National Research Council 2003: Chap. 10). In order to arrange for comparative data for MURs to be produced by national statistics offices, the criteria to be followed would have to be agreed on by these offices. Someone or some organisation – such as the United Nations Population Division – would have to coordinate the effort. One problem faced in the study of six MURs in Asia reported on in this paper was the change between the 1990 and 2000 censuses in the kind of data collected, particularly on employment,6 and in definitions, making comparison of
migration and employment change difficult in some cases.
Nevertheless, the objective is worth pursuing. With the increasing power of GIS systems, the linking of census population and housing data, economic data and other data in a more spatially meaningful way is technically feasible. It is really only the organisational aspects that provide the main barrier to such studies being accomplished.
References
Alkema, Leontine, Gavin W. Jones and Cynthia U.R. Lai (2013). Levels of urbanisation in the world’s countries: investigating consistency of national definitions. Journal of Population Research 30: 291-304.
6 National statistics offices often argue that as more detailed and reliable employment data are
Bhagat, Ram and Gavin W. Jones. 2013. Population change and migration in Mumbai Metropolitan Region: Implications for planning and governance. Working Paper Series No. 201, Asia Research Institute, National University of Singapore.
Dick, H.W. and P.J. Rimmer. 1998. Beyond the third world city: the new urban geography of South-East Asia. Urban Studies 35(12): 2303-2321.
Firman, T. (2011). Post-suburban elements in an Asian extended metropolitan region: the case of Jabodetabek (Jakarta Metropolitan Area). In International Perspectives on Suburbanization: a Post-Suburban World, ed.N.A. Phelps and F. Wu (pp.195-209). New York: Palgrave Macmillan.
Firman, T. 2013. Demographic patterns of Indonesia’s urbanisation, 2000-2010: continuity and change at the macro-level. Paper presented in conference 40 per cent of the World: Population Change, Human Capital and Development in China, India and Indonesia, JY Pillay Comparative Asia Research Centre, National University of Singapore. Firman, T., B. Kombaitan and P. Pradono, 2007. The dynamics of Indonesia’s urbanisation,
1980-2006. Urban Policy and Research 25(4): 433-454.
Hardoy, Jaime and David Satterthwaite (eds.). 1986. Small and Intermediate Urban Centres: Their Role in National and Regional Development in the Third World. London: Hodder and Stoughton.
Jones, Gavin W. 1997. The thoroughgoing urbanisation of East and South-east Asia. Asia Pacific Viewpoint38(3): 237-250.
Jones, Gavin W. 1998. Urbanisation trends in South-east Asia: some issues for policy. Journal of Southeast Asian StudiesX1X(1): 137-154.
Jones, Gavin W. 2004. Urbanisation trends in Asia: the conceptual and definitional challenges. In New Forms of Urbanization: Beyond the Urban-Rural Dichotomy, ed. Tony Champion and Graeme Hugo. London: Ashgate.
Jones, Gavin W. and Mike Douglass. 2008. Mega-Urban Regions in Pacific Asia: Urban Dynamics in a Global Era. Singapore: NUS Press.
Jones, Gavin W., Chet Boonpratuang and Chanpen Taesrikul. 1996. Dispelling some myths about urbanisation in Thailand. Journal of Demography (Chulalongkorn University) 12v (1): 21-36.
Lee Hock Guan. 2013. Steadily amplified rural votes decide Malaysian election. ISEAS Perspective #24, Singapore: Institute of Southeast Asian Studies.
McGee, T.G. 1967. The Southeast Asian City: A Social Geography of the Primate Cities of Southeast Asia. London: Bell.
McGee, T.G. 1991. The emergence of desa-kota regions in Asia: expanding a hypothesis. In The Extended Metropolis: Settlement Transition in Asia, ed. Norton Ginsburg, Bruce Koppel and Terence G. McGee. Honolulu: University of Hawaii Press.
National Research Council. 2003. Cities Transformed: Demographic Change and its Implications in the Developing World. Washington DC: The National Academies Press.
Rimmer, Peter J. and Howard Dick. 2009. The City in Southeast Asia: Patterns, Processes and Policy. Singapore: NUS Press.
Siti Zakiah bt. Muhamad Isa. 2007. Perbandaran dan Pertumbuhan Bandar di Malaysia. (Urbanization and Urban Growth in Malaysia), Monograph No. 4, Population Census 2000 Monograph Series, Department of Statistics, Malaysia, Putrajaya.
United Nations Population Division. 2011. World Urbanisation Prospects: The 2011 Revision. New York: UNPD.
Urban Age. 2007. Urban India: Understanding the Maximum City. Cities Program, London School of Economics and Political Science.
Vining, Daniel R. 1985. The growth of core regions in the Third World. Scientific American
Webster, Douglas. 1995. Mega-urbanisation in ASEAN: New phenomenon or transitional phase to the ‘Los Angeles World City’? In The Mega-Urban Regions of Southeast Asia, ed. T.G. McGee and Ira M. Robinson. Vancouver: UBC Press.
World Bank. 2009. World Development Report 2009: Reshaping Economic Geography. Washington, DC: World Bank.