SHIV SHAKTI
International Journal of in Multidisciplinary and
Academic Research (SSIJMAR)
Vol. 4, No. 3, June 2015 (ISSN 2278 – 5973)
Evaluating Banking Service Quality From Customer Perspective In
Pondicherry
Dr.D.Saravanan
Professor in M.B.A., Sri Manakula Vinayagar Engineering College Madagadipet, Puducherry.
Email: [email protected]
Impact Factor = 3.133 (Scientific Journal Impact Factor Value for 2012 by Inno Space Scientific Journal Impact Factor)
Global Impact Factor (2013)= 0.326 (By GIF)
Indexing:
Abstract
In recent years, banks have had to present more services with higher quality due to
an increase in competition, keeping durability, sustainability and their profitability. In
this issue paying attention to the effective factors on customers’ expectations and its
relationship with services quality is one of the important issues of analyzing the
evaluation of banking services quality by the customers. In this research aimed to
assess customers’ expectation and perception of service quality in the banking
service in Pondicherry using SERVQUAL and identifying the gap of service quality in
different dimensions. The target population of the study is customers of the selected
banks in Pondicherry. 100 customers of different banks were selected as the sample
size for the study. The expectations and perceptions of the respondents were
evaluated under tangibility, reliability, responsiveness, assurance and empathy
mentioned in SERVQUAL model. After analysis customers’ perceptions fall short of
their expectations. Demographic characteristics such as age, income, occupation
and qualification of the customers have significant influence on customers’
perception of banking service quality. Responsiveness and followed by reliability
were found to be higher service gap among the five dimensions.
Keywords: Service quality, service gap, expectation, perception
Introduction
Customer is the King in the present day banking. Customer services preference is
changing rapidly. Kotler (2006) observed that business organizations are now
striving to understand their customers so that they could build long-term profitable
demand for higher quality service. Service operations worldwide are affected by this
new wave of quality awareness and emphasis.
Statement of the problem
The service providers’ perception of service quality may be quite different from what
customers perceive as service quality. If the banks are to compute in providing
quality service to customers, it is important to understand the customer perception
and expectation of quality service. Banks introduce modern banking in the India to
improve its services retain and attract customers. Banks has been introduced
innovative measures like extended business hours, ATM network, internet banking
and other comfort for their customers. Customers’ preferences and expectations
seem not to match up with the bank’s initiatives. In Pondicherry, many customers
voice concerns about inefficiency and lack of quality excellence in the banking
sector. Therefore, assessment of service quality in relation to customer expectation
and service performance will help the banking sector to improve its service quality.
Objectives of the study:
To evaluate service quality from customer perspective.
To measure five dimensions of customers’ expectation and perception using
SERVQUAL instrument.
To determine the gap in customers perceptions and expectations of service
quality.
To analyze the effects of customer background characteristics on customers’
Review of Literature
Czepiel (1990) defined service quality as customer perception of how well a service
meets or exceeds their expectations. Parasuraman (1985) defined service quality is
the degree of discrepancy between customers’ normative expectation for service and
their perception of service performance. Kandampully (1998), stated customer’s
perception of quality of service is based on the degree of agreement between
expectations and experience. According to Parasuraman (1988) service quality is the
simple or weighted average of the gap between the expectations of customers and
customers’ perceived performance along these five dimensions. The researcher has
observed that all the five dimensions of Parasuraman (1988) are relevant to all
service firms but more particularly to the banking sector. For instance, reliability
pertains to good reputation of the bank; safety and assurance are relevant for
customers’ trust and use ATM and credit card; communication ensures that
customer complaints and banks efforts to address them is exchanged between
management and customer; and Empathy is crucial in facilitating customers access
and dealing with the bank.
Table 1 : Five Broad Dimension of Service Quality Dimension Description
Tangibles Appearance of physical facilities, equipment, personnel and written materials
Reliability Ability to perform the promised service dependably and accurately
Responsive Willingness to help customers and provide prompt service Assurance Employees’ knowledge and courtesy and their ability to inspire
trust and confidence
Research Methodology
The population of the study consists of customers of ten banks in Pondicherry. The
samples were selected from the population from different background characteristics
in terms of gender, age, level of education and occupation. This research identified
100 as a sample size for the study. The study use primary and secondary data to
gather relevant information for the study. The primary data were collected from the
selected customers of different banks. The study employed mainly questionnaire in
collecting the primary data. This study has selected State Bank of India, Indian Bank,
Canara Bank, Indian Overseas Bank, Syndicate Bank, HDFC Bank, ICICI Bank and
AXIS Bank for data collection. The secondary data were collected from existing
literature. The sources of the secondary data included books, journals, articles, etc.,
Parasuraman (1993) developed the most widely used measuring service quality.
They termed their instruments SERVQUAL. The SERVQUAL scale contained items
tapping five different components of service quality construct. The SERVQUAL
consists of 22 items for measuring customer’ expectations of service quality. There
are 22 items for measuring customers’ perception of service. The items of
SERVQUAL are ranked on a Likert scale and customers responds to the items by
choosing a number between 1 to 5 scales that reflects their expectation and
perception of a service. The customers’ responds about their expectations and
perception of the service are compared to obtain a gap score which indicates the
Data Analysis and Interpretation
Based on SERVQUAL, a questionnaire was prepared and field work was conducted
by the researcher.
Table 2: Background of the Respondents
Variable Category Frequency Percentage Cumulative Percentage
Gender Male 68 68 68
Female 32 32 100
Total 100 100
Age Below 20
years
2 2 2
20 to 29 years 35 35 37
30 to 39 years 30 30 67
10 to 49 years 31 31 98
50 and above 2 2 100
Total 100 100
Occupation Government employee
24 24 24
Student 2 2 26
Business person
28 28 54
Public enterprise employee
46 46 54
Total 100 100
Income Below Rs.5000 16 16 16
Rs.5001 to 10000
47 47 63
Rs.10001 to 15000
19 19 82
Above 15000 18 18 100
Total 100 100
Education Below Diploma 25 25 25
Diploma 30 30 55
Degree 22 22 77
P.G. 20 20 97
Phd 3 3 100
Total 100 100
Source: Field survey
From table 2, 68 % are male and 32 % are female. The majority of the respondents
respondents are PhD holders, 20% holds Masters degree, 22% holds degree, 30%
holds Diploma and rest of the 25% of the respondents studied below Diploma. Next
variable is occupation. 24% belongs to government employees, 2% belongs to
students, 28% belongs to business person and rest of the 46% are public enterprise
employees. Next variable is Income. 16% earns below Rs.5000, 47% earns between
Rs.5001 to 10000, 19% earns between 10001 to 15000 and 18% earns above
Rs.15000.
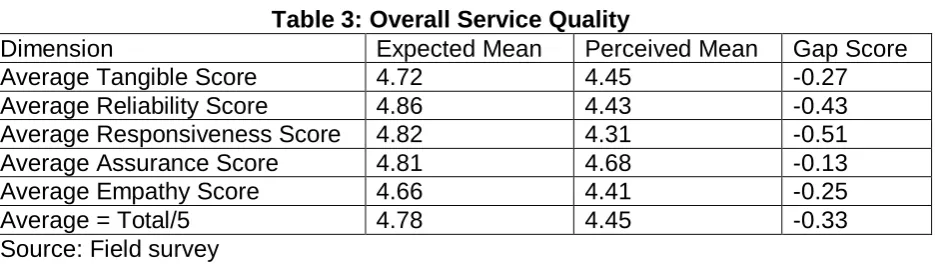
Table 3: Overall Service Quality
Dimension Expected Mean Perceived Mean Gap Score
Average Tangible Score 4.72 4.45 -0.27
Average Reliability Score 4.86 4.43 -0.43 Average Responsiveness Score 4.82 4.31 -0.51 Average Assurance Score 4.81 4.68 -0.13
Average Empathy Score 4.66 4.41 -0.25
Average = Total/5 4.78 4.45 -0.33
Source: Field survey
To find out the service delivery of both the expectations and perceptions of the
respondents is one objective of this paper. From the above table the largest service
quality gap is responsiveness with -0.51 followed by reliability gap score is -0.43.
Next tangible gap score is -0.27, empathy gap score is -0.25 and assurance gap
score is -0.13. The overall SERVQUAL cumulative gap is -0.33. This score helps us
to see the performance of the bank with respect to each factor. More negative scores
indicate that the banks are not successful in meeting customers’ expectations and
more positive score shows that the bank exceeds expectations. The above analysis
based on the five dimensions indicates that customers’ perceptions fall short of their
Table 4: Ranking order of Customers Expectations and Perception
Dimension Expected Perceived
Mean Rank Mean Rank
Tangible Score 4.72 4 4.45 2
Reliability Score 4.86 1 4.43 3
Responsiveness Score 4.82 2 4.31 5
Assurance Score 4.81 3 4.68 1
Empathy Score 4.66 5 4.41 4
Source: Field Survey
The descriptive statistics of Mean (M) of the overall service quality dimensions of
customer expectation and perception ranking are explained in this table. Reliability
expected mean ranked as 1, followed by responsiveness mean 4.82, assurance
mean 4.81, tangible mean 4.72 and empathy mean 4.66 as rank 2,3,4 and 5
respectively. Assurance perceived mean 4.68 ranked as 1, followed by tangible
mean 4.45, reliability mean 4.43, empathy mean 4.41 and responsiveness 4.31
ranked as 2,3,4 and 5 respectively. The assurance dimension which ranked the
highest in terms of perception does not rank first in terms of customers’ expectations.
This score helps us to see the performance of the bank with respect to each factor.
Findings of the study
Tangible has a gap score of -0.27. Convenience of the location of branch and ATM
has comparatively high gap score of -0.33. Reliability has a score of -0.43 which
indicates that the branches fail to meet customers’ expectation. Responsiveness
has a highest gap score of -0.51 among the five dimensions. Assurance scored the
gap score of -0.13. The last dimension empathy has average gap score of -0.25
their customers’ expectation. The customers ranking sequence is different with
customers’ expectation and perception. This study observed background
characteristics except gender made significant impact on bank’s service quality.
Banks should provide customized services to their customers to meet their
customers’ expectation.
Conclusion
It is very important to make correct transactions at first time in the banks. Then only
we can retain the customers. Bank employees training are important to provide
better services to their customers. Bank should effectively solve the customers’
problem shows their responsiveness. Better physical environment with satisfy their
customers’ expectation. Easy accessible services, neatness and help desks show
positive sign in the customers’ mind. The average scores of the respondents
customers’ expectation scores high then customers’ perception. This study shows
customers are not satisfied with the services of the banks at Pondicherry. Best
feedback system will improve service quality of banks in Pondicherry.
References:
1. Czepiel, J.A. (1990), Service encounters and service relationships:
Implications for research, Journal of Business Research, vol. 20, No.3,
pp.13-21.
2. Kandampully, J. (1998), Service quality to service loyalty: a relationship which
goes beyond customer services, Total Quality Management, Vol.9, No.6,
3. Kotler, P/ (2006), Marketing Management, Upper Saddle River, NJ, Prentice
Hall, p 56.
4. Parasuraman, A. (1998), “SERVQUAL: a multiple item scale for measuring
customer perceptions of service quality”, Journal of Retailing, Vol. 64,
pp.12-40.
5. Parasuraman, A., Zeithaml, V.A. and Berry, L.L. (1985), “A conceptual model
of service quality and its implications for future research”, Journal of
Marketing, Vol.49, pp.41-50.
6. Parasuraman, A., Leonard Berry,L. And Zeithaml V. (1993), “Research Note:
More on Improving Service Quality Measurement”, Journal of Retailing,