A P P L I E D S C I E N C E S A N D E N G I N E E R I N G
Picosecond-resolution phase-sensitive imaging
of transparent objects in a single shot
Taewoo Kim1, Jinyang Liang1*, Liren Zhu1, Lihong V. Wang1,2†
With the growing interest in the optical imaging of ultrafast phenomena in transparent objects, from shock wave to neuronal action potentials, high contrast imaging at high frame rates has become desirable. While phase sensitivity provides the contrast, the frame rates and sequence depths are highly limited by the detectors. Here, we present phase-sensitive compressed ultrafast photography (pCUP) for single-shot real-time ultrafast imaging of transparent objects by combining the contrast of dark-field imaging with the speed and the sequence depth of CUP. By imaging the optical Kerr effect and shock wave propagation, we demonstrate that pCUP can image light-speed phase signals in a single shot with up to 350 frames captured at up to 1 trillion frames per second. We expect pCUP to be broadly used for a vast range of fundamental and applied sciences.
INTRODUCTION
Since its first appearance, phase-sensitive imaging methods, such as phase contrast, differential interference contrast, and dark-field imaging, have completely changed the way we study transparent objects by rendering the phase delay caused by the object without using any exogenous contrast agents, such as fluorescence tags (1–3). The application of phase imaging covers a vast range of fields, in-cluding biological microscopy, optical metrology, and astronomy (4–10). Recent advances in phase imaging have also reached a break-through where these imaging techniques can now break the diffraction limit and achieve high-resolution unlabeled imaging of transparent objects in three dimensions (3D) (11–18). By challenging the limits of imaging, phase imaging has now become essential for new scientific discoveries, especially in biological sciences, by allowing label-free optical detection of nanoscale subcellular activities (19–24).
Following the previous advances in contrast, resolution, and 3D imaging capability, attempts have been made to improve the speed of phase imaging for the potential applications in studying a variety of ultrafast events, such as ultrashort laser pulse’s propagation, laser- induced damages, and shock wave (25–32). Moreover, with the grow-ing interest in optical detection of neuronal action potentials, the field of phase imaging has started to seek a marked improvement in speed to match the propagation speed of neuronal action potentials (33–35). Recently, several techniques have succeeded in detecting ultrafast phase signals, including the light-in-flight recording by digital holography (LIF-DH), the time-resolved holographic polar-ization microscopy (THPM), and the ultrafast framing camera (UFC) (36–40). Although these techniques achieve high–frame rate imaging, their sequence depths (i.e., the number of frames per movie) are limited by several factors, such as the number of imaging pulses (THPM), the trade-off between the sequence depth and the field of view (LIF-DH), and the number of array detectors (UFC). The typical
sequence depths reported for these techniques are 16 frames per movie at the maximum.
To overcome these limitations and to achieve ultrafast phase imaging that is capable of real-time imaging of ultrafast events, we present the phase-sensitive compressed ultrafast photography (pCUP) system, which combines the phase-sensitive dark-field imaging technique with CUP (41). CUP is based on the compressed sensing theory and the streak camera technology to achieve receive- only single-shot ultrafast imaging of up to 350 frames per event at 100 billion frames/s (Gfps). Since CUP operates as a passive detector, it can be coupled to many optical imaging systems (42–45). By com-bining CUP with dark-field microscopy, we show that pCUP can image ultrafast phase signals with a noise-equivalent sensitivity of 3 mrad and at an improved speed of 1 trillion frames/s (Tfps). We also demonstrate the ultrafast real-time phase imaging capability of pCUP by imaging three different events: phase signals from trans-parent 50-nm-diameter SiO2 beads in immersion oil, traveling phase
signals induced by the optical Kerr effect in a crystal, and propagating phase signals caused by laser-induced shock wave in water.
RESULTS
pCUP system
pCUP consists of two parts, a dark-field microscope system and an upgraded lossless-encoding CUP (LLE-CUP) detection system (Fig. 1) (43, 44). The dark-field imaging has been achieved by blocking the unscattered light at the Fourier plane using a beam block built from an anodized aluminum disc attached to a glass coverslip. The size of the beam block depends on the magnification of the system used for different experiments, and for each experiment, the block size is selected to provide the maximum signal-to-background ratio (SBR) and signal-to-noise ratio (SNR) (detailed in the Supplementary Materials). In particular, a pump pulse (represented as the red and magenta beam paths in Fig. 1) generates a transient phase dynamics
(x, y; t). Here, x and y denote the transverse Cartesian coordinates,
and t denotes time. The transient event is probed by an imaging pulse (represented as the green beam path) with an incident intensity I0(x,
y; t). The details of the pump and probe pulses will be specified in the following sections in Results. The intensity distribution of a dark-field image is represented by I(x, y, t) = I0(x, y; t)[1 − cos (x,
y; t)] (detailed in the Supplementary Materials). The dark-field image
1Caltech Optical Imaging Laboratory, Andrew and Peggy Cherng Department of
Medical Engineering, California Institute of Technology, 1200 East California Boulevard, Mail Code 138-78, Pasadena, CA 91125, USA. 2Department of Electrical Engineering, California
Institute of Technology, 1200 East California Boulevard, Mail Code 138-78, Pasadena, CA 91125, USA.
*Present address: Centre Énergie Matériaux Télécommunications, Institut National de la Recherche Scientifique, 1650 Boulevard Lionel-Boulet, Varennes, Québec J3X1S2, Canada.
†Corresponding author. Email: [email protected]
Copyright © 2020 The Authors, some rights reserved; exclusive licensee American Association for the Advancement of Science. No claim to original U.S. Government Works. Distributed under a Creative Commons Attribution NonCommercial License 4.0 (CC BY-NC).
on September 17, 2020
http://advances.sciencemag.org/
suppresses the background and the associated fluctuation, and the enhanced spatial sparsity is ideal for CUP. The signal from the dark-field microscope is separated through a 10:90 (transmission/
reflection) beam splitter to form images at the external comple-mentary metal-oxide semiconductor (CMOS) camera and at the entrance plane of the LLE-CUP system. The external CMOS camera captures a time-unsheared (i.e., time-integrated) view. The image formed at the entrance plane of the LLE-CUP system is then relayed to a digital micromirror device (DMD; DLP LightCrafter, Texas Instruments), with a ×1/3 magnification, and split into two comple-mentary views, generated by the pseudorandom binary pattern loaded onto the DMD. The two complementary views are collected by the stereoscope objective and then are passed through two dove prisms with a 90° rotation from each other. The dove prisms flip one of the views in the x direction and the other in the y direction (Fig. 1), and thus, the two views are 180° rotated from each other. Therefore, in the streak camera, the two views experience shearing in opposite directions relative to the image coordinates to provide an improved lossless encoding.
The two views are then relayed with a ×3 magnification and are projected to two separate areas on the photocathode of the streak camera (C7700, Hamamatsu). The streak camera, with a fully opened slit to capture 2D images, first converts the arriving photons to elec-trons at the photocathode, then applies time-dependent shearing to these electrons using a sweeping voltage, further converts the elec-trons back to photons using a phosphor screen, followed by ampli-fication via an image intensifier, and lastly integrates the time-sheared image on an internal CMOS camera (ORCA-Flash4.0 V2, Hamamatsu) to form two time-sheared images of pCUP in a single shot.
pCUP’s data acquisition is described as follows. The time-unsheared view captured by the external CMOS camera, E″ (m, n), is formed by E″ (m, n) = TI(x, y, t), where T is a spatiotemporal integration operator that integrates spatially over each camera pixel and temporally over the exposure time. The two time-sheared views, E(m, n) and E′ (m, n),
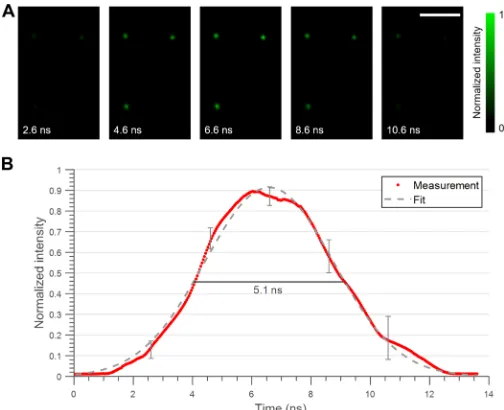
Fig. 2. pCUP imaging of 50-nm SiO2 beads in immersion oil. (A) Five represent-ative frames from a 270-frame sequence imaged with a 532-nm, 5-ns pulsed laser at a frame rate of 20 Gfps. Scale bar, 30 m. (B) Average normalized intensity over the three beads plotted over the entire imaging duration. At five representative points, the ranges from the minimum to the maximum intensities are shown using error bars. The dashed line shows a Gaussian fit of the normalized intensity, yielding an FWHM of 5.1 ns.
Fig. 1. pCUP system configuration. BB, beam block; BS, 90:10 (reflection/transmission) beam splitter; CL1, 1000-mm focal length cylindrical lens; CL2, 500-mm focal length
cylindrical lens; CMOS, external CMOS camera (Grasshopper3, FLIR); DM, 805-nm short-pass dichroic mirror; DP1 and DP2, dove prisms (PS995, Thorlabs); HWP1, 1064-nm
half-wave plate; HWP2, 800-nm half-wave plate; LC1 and LC2, 150-mm focal length lens; LF, 75-mm focal-length Fourier lens; LT, 200-mm focal-length tube lens; M1, right-angle
prism mirror; M2, knife-edge right-angle prism mirror; Mc, 12.7-mm-diameter mirror; Ob, objective lens [Olympus, Plan N 20×/0.4 NA (numerical aperture)]; P, linear polarizer;
S, sample; SO, stereoscope objective (MV PLAPO 2XC, Olympus); IP, the image plane of the dark-field microscope or the entrance plane of the LLE-CUP system. Inset: Dove prism flips the entering image along the y′-axis, thus, y″ = − y′. In the main figure, DP1 flips the image along the x axis, and DP2 flips the image along the y axis.
on September 17, 2020
http://advances.sciencemag.org/
captured by the streak camera, are formed by E(m, n) = TSFxCI(x, y, t)
and E′ (m, n) = TSFyC′ I(x, y, t), where S is the temporal shearing
operator of the streak camera, Fx and Fy are the x-directional and y-directional flipping operators from the dove prisms, and C and C′ are the complementary spatial encoding operators from the binary DMD pattern. Once they are captured, the images are fed to a com-pressed sensing algorithm to recover I(x, y, t). Note that all of the operators are linear and can precisely be determined through either calibration (for the operator C) or derivation (for the operators T, S,
Fx, and Fy). Therefore, the compressed sensing algorithm has all the
inputs required to recover I(x, y, t) (detailed in Materials and Methods). The implementation of a pair of dove prisms is especially helpful in the presence of y- directional motions in the scene with a speed com-parable to that of the temporal shearing. In this case, the signals with +y-directional motions result in severely overlapping in the raw images compared to those with −y-directional motions (see fig. S2). This discrepancy often leads to a higher quality in reconstruction to the signals with −y-directional motions. The implementation of a pair of dove prisms provides a solution to this problem because one time-sheared view is rotated 180° with respect to the other. By incorpo-rating both time-sheared views (as well as the time-unsheared view), the reconstruction algorithm will find a unique solution with a min-imum overall error, which improves the reconstructed image quality. Validation with a static phase object
Using the setup shown in Fig. 1, we first imaged a static phase ob-ject to validate the capability of pCUP. We used 50-nm-diameter SiO2 beads (SISN50-25 N, nanoComposix Inc.) in immersion oil
(IMMOIL-F30CC, Olympus) as the phase object. According to the refractive index of SiO2 (1.46) and that of the oil (1.52), the maximum
phase delay induced by each bead was only 35 mrad, corresponding to a 3-nm optical path length difference at the 532-nm wavelength. In this experiment, we operated the pCUP system at a frame rate of 20 Gfps with a 20× objective lens [Plan N 20×/ 0.4 NA (numerical
aperture), Olympus] in the dark-field microscope. Moreover, a 532-nm, 5-ns pulsed laser (VGEN-G-10, Spectra- Physics) was used to image the event. Figure 2A shows five representative frames from the re-constructed image sequence of 270 frames (movie S1). Since there is no time-dependent phase change on the beads, the intensity change of the images depends only on the temporal change of the intensity of the imaging pulse. The average temporal intensity distribution measured from the beads is shown in Fig. 2B. When fitted with a Gaussian curve, the average temporal intensity distribution shows a 5.1-ns full width at half maximum (FWHM), agreeing with the imaging pulse width of 5 ns. This result shows that pCUP had cap-tured ultrafast signal changes from phase objects with a 34-mrad phase delay at an SNR of 13.4. Given the 10% size variations of the beads reported by the manufacturer, we determine that the noise-equivalent phase sensitivity is 3 mrad. Moreover, coupled with a 20× imaging system, the point spread function had a 2.6-m FWHM, which defines the spatial resolution of the imaging system. Compared to the diffraction limit of the imaging system, the spatial resolution is reduced because of the encoding and reconstruction process, where the binning of the DMD determines the spatial sampling and the spatial resolution. While quantified for a 0.4-NA objective lens and 3 × 3 DMD binning, the spatial resolution of the imaging sys-tem can be scaled with these parameters. As the NA of the objective increases or as the DMD binning size decreases, the spatial resolu-tion improves.
Imaging of optical Kerr effect at 1 Tfps
We have further increased the speed of the pCUP system to 1 Tfps. Using the greater imaging speed, we imaged the ultrafast phase change induced by the optical Kerr effect in a Bi4Ge3O12 (BGO)
crystal slab with the size of 10 mm by 10 mm by 0.5 mm. The Kerr effect was induced by focusing an 800-nm, 50-fs laser pulse (Libra-HE, Coherent) onto the thin side of the crystal slab, while the imaging was performed through the large face of the slab, as shown in Fig. 1.
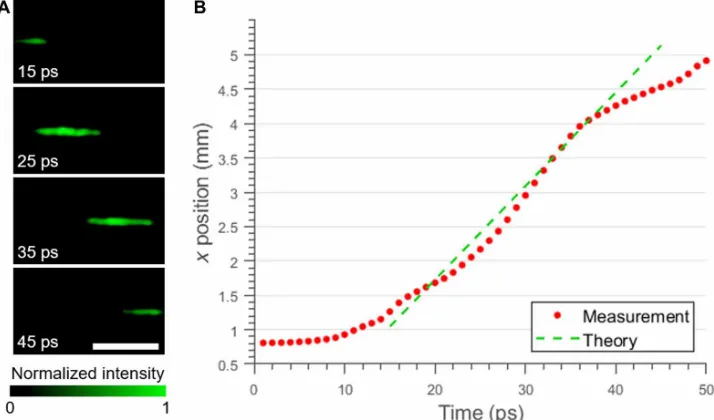
Fig. 3. pCUP imaging of optical Kerr effect inside a BGO crystal at 1 Tfps. (A) Four representative frames from the 50-frame reconstructed sequence captured over 50 ps at 1 Tfps. The traveling pump pulse induces local refractive index changes in the BGO crystal and, thus, creates a phase delay on the imaging pulse. Scale bar, 2 mm. (B) The x position of the centroid of the phase signal for each frame is plotted. The dashed line shows the x-t relation for the speed of light in the BGO crystal, which agrees well with the measurement plot for the frames in the middle of the sequence, where the entire pump laser pulse is captured in the field of view.
on September 17, 2020
http://advances.sciencemag.org/
Using a combination of 1000- and 500-mm focal-length cylindrical lenses (CL1 and CL2), the pump pulse was focused into the crystal,
in which the beam travels perpendicularly to the imaging pulse. To increase the field of view to capture the traveling pulse over a 6-mm distance, we have changed the magnification of the dark-field imaging system to ×1. The size of the imaging pulse was adjusted accordingly to allow for a uniform intensity distribution over the large field of view.
For a better synchronization between the pump pulse and the imaging pulse, the imaging pulse was also derived from the same laser source as the pump pulse, converted to 400-nm wavelength through a second harmonic generator (Harmonics Generation System, Coherent), and then temporally stretched to 50 ps using a pulse stretcher, to provide a sufficiently long imaging duration. Figure 3A shows four representative frames from the reconstructed video (movie S2). The dark-field images (Fig. 3A) show that, as the pump pulse travels through the crystal, it induces refractive index changes in the crystal
and causes the light to experience phase delay along the pump light path. Compared with the theoretical prediction, we calculated the centroid along the x axis for each frame and plotted it in Fig. 3B, along with a line indicating the speed of light in the crystal. Notice that the curve does not appear linear although the speed of light does not change inside the crystal, because only a portion of the full phase change is captured toward the beginning and the end of the time series, due to the limited field of view. Because the field of view limits the full 1.1-mm FWHM of the signal from being imaged toward the beginning and the end of the video, the centroid is over-estimated in the earlier frames and underover-estimated in the later frames. However, the travel speed of the pulse is well matched to the theo-retical prediction where the full signal length was displayed in the video, proving that the pCUP system successfully captured the phase signals from the Kerr effect caused by a 50-fs pulse traveling through a BGO crystal. Moreover, the temporal resolution of the system can be estimated from the length of the signal in the middle frames. The signal has the FWHM of 1.1 mm inside the BGO crystal (with a re-fractive index of 2.07), which shows that the temporal resolution is 7.6 ps at an imaging speed of 1 Tfps.
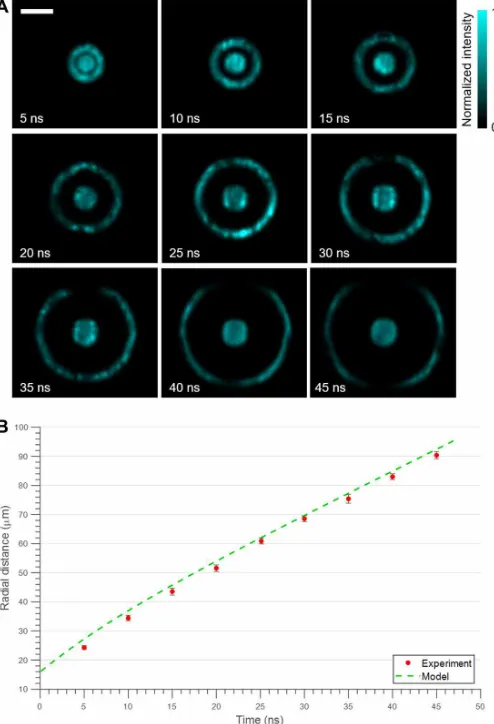
2D time-resolved imaging of laser-induced shock wave To demonstrate the imaging of a more complex phase object, we introduced a laser-induced shock wave propagating in water on the sample plane. By focusing a 10-ps, 1064-nm laser pulse (magenta light path in Fig. 1) in a water cuvette placed on the sample plane, a spherically outward propagating shock wave was generated at the focal spot. We used a 532-nm, 10-ns pulsed laser (Olive-1064-1BW, HuaRay) to image this event along with a frame rate at 10 Gfps set by the streak camera to match the relatively low propagation speed of the shock wave. Therefore, each single shot raw image can be re-constructed into a 100-frame time sequence captured at 10 Gfps.
Using this setup, we captured four 100-frame sequences, each starting at 0, 10, 25, and 37 ns from the shock wave generation to capture the evolution of the shock wave and the cavitation bubble over a total of 47-ns period. Figure 4A shows nine representative frames selected from the four pCUP-reconstructed sequences. Each of the representative frames is separated by 5 ns in time to show a complete picture of the propagation.
In Fig. 4B, the radial distance of the shock wave propagation is plotted. Each point was plotted by averaging over 16 radial profiles from the center of the shock wave (movie S3). The green dashed line represents a modeled shock wave propagation based on previous publications that estimate picosecond laser-induced shock wave prop-agation as a function of the pulse width and power (46–48). It shows that the measured distance of the shock wave front from the center agrees with the expectation. The decrease in the shock wave propa-gation speed can also be observed from the decreasing slope of the curve as the time increases. The propagation speed measured from the slope converges to 1470 m/s.
DISCUSSION
By combining the recently developed CUP with the mature dark-field microscopy, we have developed a new ultrafast phase imaging technique—pCUP—that is capable of capturing 350 phase images at a frame rate of up to 1 Tfps in a single shot with a 3-mrad noise- equivalent phase sensitivity. The combination of the frame rate and the sequence depth breaks the limits presented by previously
Fig. 4. pCUP imaging of laser-induced shock wave propagation in water. (A) Nine representative frames captured from four 10-ns sequences. The four sequences span from 0 to 10 ns, 10 to 20 ns, 25 to 35 ns, and 37 to 47 ns. The images show both the expanding shock wave front and the cavitation bubble in the middle. The time on each image represents the time passed from the initial shock wave generation. Scale bar, 50 m. (B) Plot of the radial distance of the shock wave front from the center of the shock wave. The distance was measured by averaging 16 radial profiles for each frame. The dashed line represents the radial distance of the shock wave pre-dicted by a model that agrees well with the measurement (47, 48).
on September 17, 2020
http://advances.sciencemag.org/
discussed methods, such as THPM, LIF-DH, and UFC, and brings a new opportunity for real-time single-shot imaging of ultrafast phase signals. We have demonstrated several of its applications in this article, including imaging the phase changes induced by the optical Kerr effect in a crystal and the detection of laser-induced shock wave propagation in water. By capturing these events in a single shot with a large sequence depth, pCUP brings a new opportunity to view ultrafast, unrepeatable events that have no contrast for intensity-based ultrafast imaging. Moreover, by adjusting the streaking speed and the input optics, pCUP can easily be scaled in both space and time and can span over a large range, from micrometers to meters and from picoseconds to milliseconds.
As the interest in using phase imaging lies in a multitude of fields, we anticipate pCUP to be broadly used in various areas of funda-mental and applied sciences, where the observations have been limited by the imaging speed of conventional methods. By presenting the images of the optical Kerr effect and the shock wave propagation, we have shown that pCUP can be used for studying nonlinear and ultra-fast optics, fluids, and shock-matter interactions. Moreover, pCUP holds a great potential to be used for more complex applications in-cluding, but not limited to, detecting the shock wave propagation in inertial confinement fusion (31, 32), monitoring of the shock wave- assisted drug delivery (49), and imaging and modeling of the cellular action potential propagation (33, 34).
MATERIALS AND METHODS
Imaging system and speed
The design of the pCUP system consists of optimizing four variables in the system, namely, the imaging speed, the SBR, the SNR, and the spatial resolution. The imaging speed was determined mainly by the sweeping speed of the streak camera, which is represented by the Time Range in the software. To capture the transient event in a single shot, the Time Range was selected to match the total time of the event within the field of view. That is, the Time Range was determined by the field of view divided by the propagation speed of the object, to capture the entire event within the field of view in a single shot. The width of imaging pulse was also determined to best match the Time Range, because the effective exposure time for each reconstructed frame, which is as short as 1 ps in imaging at 1 Tfps, requires the imaging beam to come from a high-power ultrafast laser to achieve sufficient SNR for successful reconstruction of the time sequence. The imaging speed in this study, limited by the streak camera’s sweeping rate, can be improved using a faster streak camera (45). Moreover, the size of the beam block in the dark-field microscope was selected to maximize the SNR and the SBR (see the Supplementary Materials). With the CUP system enclosed to block any light from entering the system except for the imaging light, the main source of noise in the system was the photon shot noise and the background leaked from the beam block. To ensure complete blockage of the unscattered light, the optimal size of the block was determined experimentally by maximizing the SNR and the SBR of the dark-field image captured by the external CMOS camera. By completely blocking the unscattered light, the beam block also min-imizes the background fluctuation associated with the unscattered light and provides optimized signals for CUP imaging. After com-pletely blocking the unscattered light, the maximum energy of the imaging pulse, given by the lasers, was used to achieve the highest SNR. Last, the spatial resolution is mainly determined by the NA of
the objective lens used and the binning size of the pseudorandom DMD pattern (50). We used 3 × 3 binning in the experiments, which was the smallest bin size that allowed for robust image reconstruction. Sample preparation
SiO2 beads were supplied in water (SISN50-25 N, nanoComposix
Inc.). A droplet of the SiO2 solution was applied and spread on a
glass coverslip (48393-048, VWR International) and dried until the water was completely evaporated. A droplet of the immersion oil (IMMOIL-F30CC, Olympus) was then applied on the coverslip and covered with another coverslip to spread the oil and to ensure uni-form thickness over the field of view.
The BGO crystal (BGO12b101005S2, MTI Corp.) of size 10 mm × 10 mm × 0.5 mm had two opposing faces polished. The four thin sides were further polished in house using a series of fiber polishing papers. The order of grit sizes used was 30 m (LF30D, Thorlabs), 6 m (LF6D, Thorlabs), 3 m (LF3D, Thorlabs), 1 m (LF1D, Thorlabs),
and 0.02 m (LFCF, Thorlabs). The polishing was performed to maximize the transmission efficiency of the Kerr pump pulse at the interface of air and the BGO crystal. The crystal was fixed on a filter holder (54996, Edmund Optics) to ensure a clear aperture along the imaging light path and a clear aperture along the pump light path. The fluorescence light from the BGO crystal with a peak at 480 nm was filtered out from the imaging beam path using a 450-nm short-pass filter (47286, Edmund Optics).
For the shock wave experiment, a glass cuvette (1G10P, FireflySci Inc.) was filled with type 1 ultrapure water obtained from a UV water purification system (Millipore Simplicity UV) to remove impurities. It was placed on a sample holder located at the sample plane of the dark-field imaging system, and then the shock wave was generated by coupling a 10-ps, 1064-nm pulsed laser through the objective lens using a short-pass dichroic mirror (DMSP805R, Thorlabs).
Image reconstruction
The reconstruction method follows the method introduced in previous papers, which uses the two-step iterative shrinkage/thresholding algorithm to recover the time-resolved images obtained from the LLE-CUP setup with space and intensity constraints (43, 44). Thus, the inputs of the reconstruction include the raw CUP image [i.e., E(x, y; t) and E′ (x, y; t)], the pattern image, the time-unsheared image captured on the external CMOS camera, the mask image derived from the time-unsheared image, and the transformation matrices between the two time-sheared views and the time-unsheared view. The reconstruction algorithm was written in C++ and MATLAB and was run on our lab’s server equipped with Intel Xeon E5-2670 v3 CPU (48 cores at 2.3 GHz) and 256-gigabyte random-access mem-ory. On this system, the reconstruction of a single data cube with a size of 72 pixels × 512 pixels × 350 pixels took about 15 min for 50 iterations. Last, the 180° rotation between the two time-sheared views was also implemented in the forward and the backward op-erators of the reconstruction code to compensate for the change in the optical setup (see the Supplementary Materials).
SUPPLEMENTARY MATERIALS
Supplementary material for this article is available at http://advances.sciencemag.org/cgi/ content/full/6/3/eaay6200/DC1
Section S1. Dark-field intensity as a function of the phase Section S2. SBR and SNR analysis for various beam block sizes Section S3. Improved lossless encoding by the dove prisms
on September 17, 2020
http://advances.sciencemag.org/
Fig. S1. Dark-field images of a 50-m-diameter polystyrene bead in water with various beam block diameters.
Fig. S2. Illustration of the raw image formation with 180° rotated complementary views. Table S1. SBR and SNR for various beam block diameters with a 20× objective.
Movie S1. Twenty billion frames per second imaging of 50-nm SiO2 beads in immersion oil illuminated with a 5-ns pulse.
Movie S2. One trillion frames per second imaging of optical Kerr effect inside a BGO crystal. Movie S3. Laser-induced shock wave propagation in water.
View/request a protocol for this paper from Bio-protocol.
REFERENCES AND NOTES
1. F. Zernike, How I discovered phase contrast. Science 121, 345–349 (1955).
2. G. Nomarski, A. R. Weill, Application à la métallographie des méthodes interférentielles à deux ondes polarisées. Rev. Met. Paris 52, 121–134 (1955).
3. S. H. Gage, Modern dark-field microscopy and the history of its development. Trans. Am.
Microsc. Soc. 39, 95–141 (1920).
4. A. Momose, T. Takeda, Y. Itai, K. Hirano, Phase-contrast x-ray computed tomography for observing biological soft tissues. Nat. Med. 2, 473–475 (1996).
5. T. J. Davis, D. Gao, T. E. Gureyev, A. W. Stevenson, S. W. Wilkins, Phase-contrast imaging of weakly absorbing materials using hard x-rays. Nature 373, 595–598 (1995). 6. F. Pfeiffer, M. Bech, O. Bunk, P. Kraft, E. F. Eikenberry, C. Brönnimann, C. Grünzweig,
C. David, Hard-x-ray dark-field imaging using a grating interferometer. Nat. Mater. 7, 134–137 (2008).
7. E. Serabyn, D. Mawet, R. Burruss, An image of an exoplanet separated by two diffraction beamwidths from a star. Nature 464, 1018–1020 (2010).
8. M.-C. Zdora, P. Thibault, T. Zhou, F. J. Koch, J. Romell, S. Sala, A. Last, C. Rau, I. Zanette, X-ray phase-contrast imaging and metrology through unified modulated pattern analysis. Phys. Rev. Lett. 118, 203903 (2017).
9. R. Zhou, C. Edwards, A. Arbabi, G. Popescu, L. L. Goddard, Detecting 20 nm wide defects in large area nanopatterns using optical interferometric microscopy. Nano Lett. 13, 3716–3721 (2013).
10. D. Rouan, P. Riaud, A. Boccaletti, Y. Clénet, A. Labeyrie, The four-quadrant phase-mask coronagraph. I. Principle. Publ. Astron. Soc. Pac. 112, 1479 (2000).
11. P. Marquet, B. Rappaz, P. J. Magistretti, E. Cuche, Y. Emery, T. Colomb, C. Depeursinge, Digital holographic microscopy: A noninvasive contrast imaging technique allowing quantitative visualization of living cells with subwavelength axial accuracy. Opt. Lett. 30, 468–470 (2005).
12. W. Choi, C. Fang-Yen, K. Badizadegan, S. Oh, N. Lue, R. R. Dasari, M. S. Feld, Tomographic phase microscopy. Nat. Methods 4, 717–719 (2007).
13. H. Jiang, C. Song, C.-C. Chen, R. Xu, K. S. Raines, B. P. Fahimian, C.-H. Lu, T.-K. Lee, A. Nakashima, J. Urano, T. Ishikawa, F. Tamanoi, J. Miao, Quantitative 3D imaging of whole, unstained cells by using x-ray diffraction microscopy. Proc. Natl. Acad. Sci. U.S.A.
107, 11234–11239 (2010).
14. Y. Cotte, F. Toy, P. Jourdain, N. Pavillon, D. Boss, P. Magistretti, P. Marquet, C. Depeursinge, Marker-free phase nanoscopy. Nat. Photonics 7, 113–117 (2013). 15. T. Kim, R. Zhou, M. Mir, S. D. Babacan, P. S. Carney, L. L. Goddard, G. Popescu, White-light
diffraction tomography of unlabelled live cells. Nat. Photonics 8, 256–263 (2014). 16. T. H. Nguyen, M. E. Kandel, M. Rubessa, M. B. Wheeler, G. Popescu, Gradient light
interference microscopy for 3D imaging of unlabeled specimens. Nat. Commun. 8, 210 (2017).
17. R. Horstmeyer, J. Chung, X. Ou, G. Zheng, C. Yang, Diffraction tomography with Fourier ptychography. Optica 3, 827–835 (2016).
18. S. Shin, D. Kim, K. Kim, Y. Park, Super-resolution three-dimensional fluorescence and optical diffraction tomography of live cells using structured illumination generated by a digital micromirror device. Sci. Rep. 8, 9183 (2018).
19. M. Chen, L. Tian, L. Waller, 3D differential phase contrast microscopy. Biomed. Opt. Express
7, 3940–3950 (2016).
20. N. C. Pégard, A. R. Mardinly, I. A. Oldenburg, S. Sridharan, L. Waller, H. Adesnik, Three-dimensional scanless holographic optogenetics with temporal focusing (3D-SHOT). Nat. Commun. 8, 1228 (2017).
21. M. E. Kandel, D. Fernandes, A. M. Taylor, H. Shakir, C. Best-Popescu, G. Popescu, Three-dimensional intracellular transport in neuron bodies and neurites investigated by label-free dispersion-relation phase spectroscopy. Cytometry A 91, 519–526 (2017). 22. G. Kim, M. Lee, S. Y. Youn, E. T. Lee, D. Kwon, J. Shin, S. Y. Lee, Y. S. Lee, Y. K. Park,
Measurements of three-dimensional refractive index tomography and membrane deformability of live erythrocytes from Pelophylax nigromaculatus. Sci. Rep. 8, 9192 (2018).
23. J. Jung, S.-J. Hong, H.-B. Kim, G. Kim, M. Lee, S. Shin, S. Y. Lee, D.-J. Kim, C.-G. Lee, Y. K. Park, Label-free non-invasive quantitative measurement of lipid contents in individual microalgal cells using refractive index tomography. Sci. Rep. 8, 6524 (2018).
24. K. Kim, Y. Park, Tomographic active optical trapping of arbitrarily shaped objects by exploiting 3D refractive index maps. Nat. Commun. 8, 15340 (2017).
25. Z. Li, H. E. Tsai, X. Zhang, C. H. Pai, Y. Y. Chang, R. Zgadzaj, X. Wang, V. Khudik, G. Shvets, M. C. Downer, Single-shot visualization of evolving laser wakefields using an all-optical streak camera. Phys. Rev. Lett. 113, 085001 (2014).
26. B. Medhi, G. M. Hegde, K. J. Reddy, D. Roy, R. M. Vasu, Shock-wave imaging by density recovery from intensity measurements. Appl. Opt. 57, 4297–4308 (2018).
27. N. Šiaulys, L. Gallais, A. Melninkaitis, Direct holographic imaging of ultrafast laser damage process in thin films. Opt. Lett. 39, 2164–2167 (2014).
28. P. Gabolde, R. Trebino, Single-shot measurement of the full spatio-temporal field of ultrashort pulses with multi-spectral digital holography. Opt. Express 14, 11460–11467 (2006).
29. P. Gabolde, R. Trebino, Single-frame measurement of the complete spatiotemporal intensity and phase of ultrashort laser pulses using wavelength-multiplexed digital holography. J. Opt. Soc. Am. B 25, A25–A33 (2008).
30. S. P. Le Blanc, E. W. Gaul, N. H. Matlis, A. Rundquist, M. C. Downer, Single-shot measurement of temporal phase shifts by frequency-domain holography. Opt. Lett. 25, 764–766 (2000).
31. D. K. Bradley, P. M. Bell, J. D. Kilkenny, R. Hanks, O. Landen, P. A. Jaanimagi, P. W. McKenty, C. P. Verdon, High-speed gated x-ray imaging for ICF target experiments (invited).
Rev. Sci. Instrum. 63, 4813–4817 (1992).
32. R. Kodama, P. A. Norreys, K. Mima, A. E. Dangor, R. G. Evans, H. Fujita, Y. Kitagawa, K. Krushelnick, T. Miyakoshi, N. Miyanaga, T. Norimatsu, S. J. Rose, T. Shozaki, K. Shigemori, A. Sunahara, M. Tampo, K. A. Tanaka, Y. Toyama, T. Yamanaka, M. Zepf, Fast heating of ultrahigh-density plasma as a step towards laser fusion ignition. Nature
412, 798–802 (2001).
33. P. Marquet, C. Depeursinge, P. J. Magistretti, Review of quantitative phase-digital holographic microscopy: Promising novel imaging technique to resolve neuronal network activity and identify cellular biomarkers of psychiatric disorders. Neurophotonics
1, 020901 (2014).
34. S. Batabyal, S. Satpathy, L. Bui, Y.-T. Kim, S. Mohanty, R. Bachoo, D. P. Davé, Label-free optical detection of action potential in mammalian neurons. Biomed. Opt. Express 8, 3700–3713 (2017).
35. S. Oh, C. Fang-Yen, W. Choi, Z. Yaqoob, D. Fu, Y. K. Park, R. R. Dassari, M. S. Feld, Label-free imaging of membrane potential using membrane electromotility. Biophys. J. 103, 11–18 (2012).
36. T. Kakue, K. Tosa, J. Yuasa, T. Tahara, Y. Awatsuji, K. Nishio, S. Ura, T. Kubota, Digital light-in-flight recording by holography by use of a femtosecond pulsed laser. IEEE J. Sel.
Top. Quantum Electron. 18, 479–485 (2012).
37. A. Komatsu, Y. Awatsuji, T. Kubota, Dependence of reconstructed image characteristics on the observation condition in light-in-flight recording by holography. J. Opt. Soc. Am. A
22, 1678–1682 (2005).
38. Q.-Y. Yue, Z.-J. Cheng, L. Han, Y. Yang, C.-S. Guo, One-shot time-resolved holographic polarization microscopy for imaging laser-induced ultrafast phenomena. Opt. Express 25, 14182–14191 (2017).
39. D. Veysset, A. A. Мaznev, T. Pezeril, S. Kooi, K. A. Nelson, Interferometric analysis of laser-driven cylindrically focusing shock waves in a thin liquid layer. Sci. Rep. 6, 24 (2016).
40. D. Veysset, U. Gutiérrez-Hernández, L. Dresselhaus-Cooper, F. De Colle, S. Kooi, K. A. Nelson, P. A. Quinto-Su, T. Pezeril, Single-bubble and multibubble cavitation in water triggered by laser-driven focusing shock waves. Phys. Rev. E 97, 053112 (2018). 41. L. Gao, J. Liang, C. Li, L. V. Wang, Single-shot compressed ultrafast photography at one
hundred billion frames per second. Nature 516, 74–77 (2014).
42. J. Liang, L. Gao, P. Hai, C. Li, L. V. Wang, Encrypted three-dimensional dynamic imaging using snapshot time-of-flight compressed ultrafast photography. Sci. Rep. 5, 15504 (2015).
43. L. Zhu, Y. Chen, J. Liang, Q. Xu, L. Gao, C. Ma, L. V. Wang, Space- and intensity-constrained reconstruction for compressed ultrafast photography. Optica 3, 694–697 (2016). 44. J. Liang, C. Ma, L. Zhu, Y. Chen, L. Gao, L. V. Wang, Single-shot real-time video recording
of a photonic Mach cone induced by a scattered light pulse. Sci. Adv. 3, e1601814 (2017).
45. J. Liang, L. Zhu, L. V. Wang, Single-shot real-time femtosecond imaging of temporal focusing. Light Sci. Appl. 7, 42 (2018).
46. C. E. Brennen, Cavitation and Bubble Dynamics (Cambridge Univ. Press, 2014). 47. A. Vogel, S. Busch, U. Parlitz, Shock wave emission and cavitation bubble generation by
picosecond and nanosecond optical breakdown in water. J. Acoust. Soc. Am. 100, 148–165 (1996).
48. K.-T. Byun, H.-Y. Kwak, A model of laser-induced cavitation. Jpn. J. Appl. Phys. 43, 621–630 (2004).
49. G. Jagadeesh, G. D. Prakash, S. G. Rakesh, U. S. Allam, M. G. Krishna, S. M. Eswarappa, D. Chakravortty, Needleless vaccine delivery using micro-shock waves. Clin. Vaccine
Immunol. 18, 539–545 (2011).
on September 17, 2020
http://advances.sciencemag.org/
50. X. Liu, S. Zhang, A. Yurtsever, J. Liang, Single-shot real-time sub-nanosecond electron imaging aided by compressed sensing: Analytical modeling and simulation. Micron 117, 47–54 (2019).
Acknowledgments: We thank P. Wang, J. Jing, and A. Kumar for discussion. We also acknowledge Texas Instruments for providing the DLP device. Funding: This work was supported, in part, by NIH grants DP1 EB016986 (NIH Director’s Pioneer Award), U01 NS090579 (BRAIN Initiative), and U01 NS099717 (BRAIN Initiative). Author contributions: T.K. built the system, performed the experiments, analyzed the data, and prepared the manuscript. J.L. and L.Z. built the reconstruction algorithm. L.V.W. contributed to the conceptual system, experimental design, and manuscript preparation. Competing interests: The authors disclose the following patent applications: WO2016085571 A3 (L.V.W. and J.L.), U.S. Provisional 62/298,552 (L.V.W., J.L.,
and L.Z.), and U.S. Provisional 62/812,411 (L.V.W., T.K., J.L., and L.Z.). The authors declare that they have no other competing interests. Data and materials availability: All data needed to evaluate the conclusions in the paper are present in the paper and/or the Supplementary Materials. Additional data related to this paper may be requested from the authors.
Submitted 4 July 2019 Accepted 18 November 2019 Published 17 January 2020 10.1126/sciadv.aay6200
Citation: T. Kim, J. Liang, L. Zhu, L. V. Wang, Picosecond-resolution phase-sensitive imaging of transparent objects in a single shot. Sci. Adv. 6, eaay6200 (2020).
on September 17, 2020
http://advances.sciencemag.org/
DOI: 10.1126/sciadv.aay6200 (3), eaay6200. 6
Sci Adv
ARTICLE TOOLS http://advances.sciencemag.org/content/6/3/eaay6200
MATERIALS
SUPPLEMENTARY http://advances.sciencemag.org/content/suppl/2020/01/13/6.3.eaay6200.DC1
REFERENCES
http://advances.sciencemag.org/content/6/3/eaay6200#BIBL
This article cites 49 articles, 4 of which you can access for free
PERMISSIONS http://www.sciencemag.org/help/reprints-and-permissions
Terms of Service
Use of this article is subject to the
is a registered trademark of AAAS.
Science Advances
York Avenue NW, Washington, DC 20005. The title
(ISSN 2375-2548) is published by the American Association for the Advancement of Science, 1200 New
Science Advances
License 4.0 (CC BY-NC).
Science. No claim to original U.S. Government Works. Distributed under a Creative Commons Attribution NonCommercial Copyright © 2020 The Authors, some rights reserved; exclusive licensee American Association for the Advancement of
on September 17, 2020
http://advances.sciencemag.org/