Email: [email protected]
JEHANZEB
HoD, Management Sciences City University of Science and information Technology Email: [email protected]
Abstract
Employees in any organization are primarily motivated when their efforts are appreciated in shape of reward. The research was focused to study the impact of reward on motivation of employees. Rewards whether financial or non-financial have played and are still playing a very important role in motivating the employees. With motivated employees the increase in productivity of organization has been greatly expected. The population for the study was all the employees of the Palace Continental Hotel Peshawar (PCHP). The sample size was 75 as these questionnaires were distributed among respondents.75 questionnaire were returned which represented 100% response rate. The findings of the study stated that rewards had significant effect on motivation. The factors of reward i.e. financial reward had insignificant effect on the employees’ motivation while non-financial reward had significant effect on the employees’ motivation. The second Hypothesis of the study was rejected while first and third hypothesis were accepted.
Keywords: Motivation, Rewards, Financial Rewards, Non-financial Rewards, Productivity.
Introduction
Motivation is a general term, which describes the drives, needs, desires and other similar factors. It is the incentive that makes an individual act in a specific manner. The employees were motivated when organization gave them different rewards in shape of financial reward and non-financial reward. If the human resources are well motivated and willing to work, this increase the ability of the organization productivity. People are motivated to perform behavior in order to satisfy their personal needs. Rewards will only motivate behavior if the rewards are valued, if they are closely linked to successful performance, and if employees believe that they can perform successfully. This study has tried to focus on the reward and its factors which results in Motivating employees in an Organization. This work tried to analyze all the rewarding strategies of PCHP and check the payback plan of PCHP, which in most of the cases is less than work. This leads to demotivation of employee. Thus, in the longer run, harms the organization immensely as it can lose its best employees if they get a better offer from anywhere else. This work helps to identify new ideas and find those critical motivation factors that results in Employee Motivation.
Objectives of the study
The objective of the study was to find out the effect of rewards on motivation. The focus organization was the employees of Palace Continental Hotel Peshawar. Rewards were further measured as financial and non-financial rewards. Following are the objectives of the study,
To study the impact of rewards on motivation of employees in Palace Continental Hotel Peshawar.
To determine the impact of non-financial rewards on motivation in Palace Continental Hotel Peshawar.
Significance of Study
The study will be of greater importance for the management of PCHP as it will help them to focus more on having motivated workforce. At the same, the study will benefit the individual employees as well for their self development. In connection to these, the finding of the study also has equal importance for the practitioners of training. The training consultancy firm can utilize this study in the specific perspective of training for the services industry.
Literature Review
Motivation is a Latin word meaning „to move‟. Motivation presents that unsatisfied needs which creates a state of tension or disequilibrium, causing the individual to move in a goal-directed pattern towards restoring a state of equilibrium by satisfying the need. Motivation implies any emotion or desire, which so conditions ones will that the individual is properly lead into action. Performance results from the interaction of physical, financial, human resources. The first two are inanimate; they are translated into “productivity” only when the human element is introduced. However, the human element interjects a variable over which a management has a limited control. Motivating employees involves more than simply offering rewards to submitter if their suggestion is put to use. According to expectancy theory, rewards will only motivate behavior if the rewards are valued, if they are closely linked to successful performance, and if employees believe that they can perform successfully (Vroom, 1964). We use the term employee motivation; we intend the label to apply to both employees and non-employees who are agents of public action (Bucklin & Dickinson, 2001).
In this new governance era, managers must be attentive to the motivation of both employees and, in some circumstances non-employees who are involved in implementation networks or other structural arrangements (Sundstrom, 1998). Goal setting techniques have been used widely in government and the early conceptual and practical development of some techniques, like MBO, owe a great deal towards governmental experience (Sherwood, 1976).
Locke‟s goal-setting model Locke and Latham (1984) in particular, predicted that both performance and motivation will be increased when individuals have clear goals. Employee motivation is thought to be an essential ingredient of learning organizations. Senge (1990) being experts agreed that a learning organization whose employees have a clear vision of the importance of service quality and are motivated to provide that quality will achieve superior service quality. Hostage (1975) who stated that “Service quality begins with people”. Companies can only get result if people are motivated enough for that. Hackman and Oldham (1980) believed that a job‟s motivating potential can be enhanced by increasing the level of feedback from job and/or knowledge of results.
Wirtz (1998) who asserted that the negative feedback employees obtain from service failure, may have a demotivating effect, rather than a motivating effect. The ability to learn efficiently from both employees and customers is thought, by some experts, to be necessary for organizational success and survival. Control theory (Carver & Scheier, 1981) goal-setting theory (Locke & Latham, 1990) and social cognitive theory (Bandura, 1986) all agree that feedback regulates action by stimulating a reaction to a feedback-standard discrepancy. Survey was carried out to evaluate the relationship between motivation at work and gender.
Rewards
The research concluded that there was no statistically significant difference in total motivation and demotivation levels between male and female employees (Walker, 2001). Fairbank and David (2001) carried out a research and found that Employee suggestion system is the most effective system that results
moderate the pay-for-performance relationship. Compressed Pay promotes team effort and cooperation by creating a more egalitarian workplace, which tends to reduce turnover (Beaumont & Harris, 2003). Accordance to Tournament theory- the winners stay with the company in order to compete in further tournaments, but losers are implicitly expected to leave or to face truncated careers (Bloom & Michel, 2002). Doeringer et al. (1998) Found that focusing on „social and organizational learning‟ can help the Company to provide its workforce with offers like Career employment and High wages.
Based on the above discussion following hypothesis have been formulated for the study. H1: Rewards has significant impact on motivation of employees
H2: Financial rewards has significant impact on motivation of employees H3: Non-financial rewards has significant impact on motivation of employees
Methodology
Primary data was collected through structured questionnaire. Primary research has been found to be the best method because it helps the researcher to get accurate and up to date information. Primary research is used to get the original information and it is used because it gives a control over how the information is collected. The focus was on the employees of the Palace Continental Hotel Peshawar regarding Reward and Motivation.
Population
The population of this study was the employees of the Palace Continental Hotel Peshawar, since these employees belongs to different areas of the Peshawar so they are good representatives of the Peshawar city.
Sampling Design
All the employees of the Palace Continental Hotel Peshawar were the sampling design for the study. The research was conducted using 75 questionnaires filled by the employees of the Palace Continental Hotel Peshawar.
Sample Size
Seventy five questionnaires were distributed among the selected sample size. All of these seventy five questionnaires were filled and returned back. The response rate was 100%.the analysis is based on 75 responses.
Research Instrument
Results of the Study
Table 1: Gender
Frequency Percent Valid Percent
Cumulative Percent
Valid Male 70 93.3 93.3 93.3
Female 5 6.7 6.7 100.0
Total 75 100.0 100.0
Form the above table 1 it is evident that out of 75 respondents there were 70 male respondents and 5 female respondents. The percentage of female respondents was 6.7% while the percentage of male respondents was 93.3%.
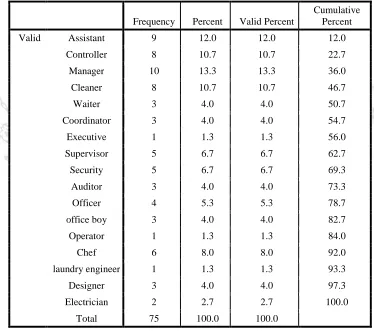
Table 2: Designation
Frequency Percent Valid Percent
Cumulative Percent
Valid Assistant 9 12.0 12.0 12.0
Controller 8 10.7 10.7 22.7
Manager 10 13.3 13.3 36.0
Cleaner 8 10.7 10.7 46.7
Waiter 3 4.0 4.0 50.7
Coordinator 3 4.0 4.0 54.7
Executive 1 1.3 1.3 56.0
Supervisor 5 6.7 6.7 62.7
Security 5 6.7 6.7 69.3
Auditor 3 4.0 4.0 73.3
Officer 4 5.3 5.3 78.7
office boy 3 4.0 4.0 82.7
Operator 1 1.3 1.3 84.0
Chef 6 8.0 8.0 92.0
laundry engineer 1 1.3 1.3 93.3
Designer 3 4.0 4.0 97.3
Electrician 2 2.7 2.7 100.0
Total 75 100.0 100.0
In the above table 2 of designation, there were 9 assistant having a percentage rate of 12.00 %while the frequency of controller was 8 having a percentage rate of 10.70 %. The frequency of Manager was 10 having a percentage of 13.3 %. The frequency of Cleaner was 8 having a percentage rate of 10.70 &. Waiter has a frequency of 3 having a percentage of 4.00 %. Coordinator has a frequency of 3 and a percentage of 4.00 %. Executive has a frequency of 1 having a percentage of 1.3 %.Supervisor has a frequency of 5 and percentage of 6.7 %. Security has a frequency of 5 & a percentage of 6.7 %. Auditor has a frequency of 3 and a percentage of 4.00 %. Officer has a frequency of 3 and a percentage of 4.00 %.
N Minimum Maximum Mean Std. Deviation
AGE 75 20.00 52.00 32.7600 7.85311
Experience in this
organization 75 1.00 23.00 6.3733 4.89007
Total work Experience 75 1.00 27.00 9.0000 5.45498
Valid N (listwise) 75
The above table show that average values of the respondents. The mean value of age of the respondents is 32.765 with standard deviation of 7.85. The mean value of the experience I this organization was 6.37 and standard deviation value was 4.89. While the mean value of the total work experience was 9 and standard deviation was 5.45.
Table 4: Reliability Statistics For the factor Financial Reward
S.N0 Cronbach's Alpha N of Items
Financial Rewards .533 7
Non-financial
Rewards .547 7
Motivation .522 6
By the above table of reliability statistics shows that there was 7 items for measuring the factor financial reward. The value of Cronbach's Alpha is 0.533 which reflects that the items were moderately reliable and were actually measuring the factor the financial rewards. The reliability statistics shows that there was 7 items for measuring the factor Non-financial reward. The value of Cronbach's Alpha was 0.547 which reflects that the items were also moderately reliable and were actually measuring the factor the Non-financial rewards. There was 6 items for measuring the factor Motivation. The value of Cronbach's Alpha was 0.522 which reflects that the items were also moderately reliable and were actually measuring the factor the Motivation
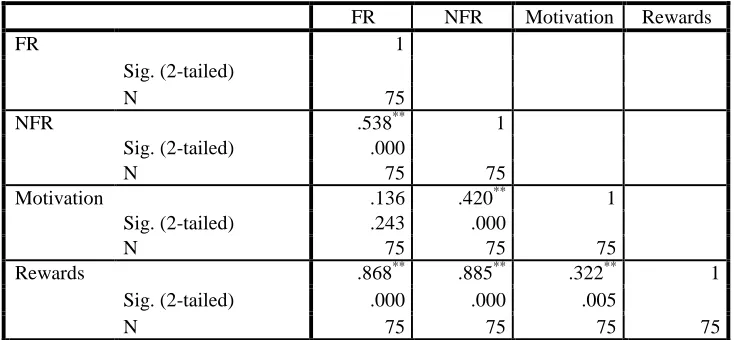
Table 7: Correlations
FR NFR Motivation Rewards
FR 1
Sig. (2-tailed)
N 75
NFR .538** 1
Sig. (2-tailed) .000
N 75 75
Motivation .136 .420** 1
Sig. (2-tailed) .243 .000
N 75 75 75
Rewards .868** .885** .322** 1
Sig. (2-tailed) .000 .000 .005
N 75 75 75 75
The above table 7 shows the relationship between the variables of the study. The value of Pearson correlation between Financial Rewards and Non-Financial Rewards is 0.538 which represents 53.8% positive relation between two variables. This Pearson correlation value is significant even at 99% confidence interval. The value of Pearson correlation between Financial Rewards and Motivation is 0.136 which represents only 13.6% positive relation between two variables. However this Pearson correlation value is insignificant statically. Moreover the value of Pearson correlation between Non-Financial Rewards and Motivation is 0.42 which represents only 42% positive relation between above mentioned two variables. This Pearson correlation value is significant even at 99% confidence interval. Rewards factor which is combination of Financial Rewards and Non-Financial Rewards is 86% and 88% statistically significant correlated to Financial Rewards and Non-Financial Rewards respectively. However Rewards factor is only 32% correlated with motivation with 95% confidence interval.
Table 8: Model Summarya
Mod
el R
R Square
Adjusted R Square
Std. Error of the Estimate
Change Statistics R Square
Change F Change
Sig. F Change
1 .322a .104 .092 .45903 .104 8.463 .005
a. Predictors: (Constant), Rewards
In the above R i.e. 0.322 tell us about the correlation which represent that Rewards factor (the combination of Financial rewards and Non-financial rewards factors) is 32.2% correlated with employees Motivation positive relationship among the two factors as compare Financial and Non-financial rewards separately, discussed later in this section. R square tells about the variance explain by the independent variables in dependent variable of the study. The results show that only 10.4 % variation in dependent variable is explained by the variation in the independent variable of the study i.e. Rewards. This reflects that there are many other variables as well that explains the variation in dependent variable i.e. Motivation which were not considered in this study. When the R square value is adjusted for degree of freedom, the adjusted R square equals to only 9.2%. F changes tells us about the statistically significance of the model, the value here is 8.463 with the significance level of 99%. The P value is less than 0.005 which represents the model is highly significant.
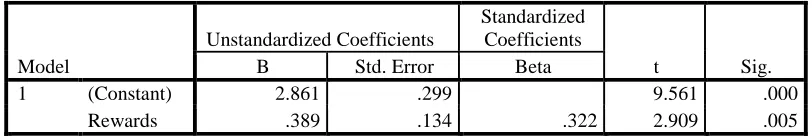
Table 3: Coefficients
Model
Unstandardized Coefficients
Standardized Coefficients
t Sig.
B Std. Error Beta
1 (Constant) 2.861 .299 9.561 .000
Rewards .389 .134 .322 2.909 .005
a. Dependent Variable: Motivation
In the above table 10 β represents change in the dependent variable because of change in the independent variable i.e. Rewards factor. The beta or coefficient value of rewards factor is 0.389 which shows that when the independent variable value changes by one unit, the dependent variable in response to this change in independent variables changes by 0.389 units. This estimate is also statistically significant at 99% level‟s value shows the acceptance or rejection of the hypothesis. The intercept term equals to 2.861 units which shows that when independent variables equals to zero, still the value of dependent variable would be 2.861 with significance at even 99%. The t value at 5 % significance level is 2.909 with significance value of 0.005.
.000
2 .433b .187 .165 .44018 .169 14.942
a. Predictors: (Constant), FR b. Predictors: (Constant), FR, NFR
In the above table financial reward and Non-financial rewards are taken as two separate independent variables in the model. In the above table, R tell us about the correlation i.e. 0.136 which represent that financial rewards is 13.6% correlated with employees Motivation depicting week relationship among the two factors. R square tells about the variance explained by the independent variables in dependent variable of the study. The results show that only 18.7 % variation in dependent variables is explained by the two independent variable of the study i.e. Financial Rewards and Non-Financial Rewards.
This reflects that there are other variables as well that explains the changes in dependent variable i.e. Motivation which were not taken to be part of the study. When the R square value is adjusted for degree of freedom, the adjusted R square equals to only 16.5%.F changes tells us about the statistically significance of the model, the value here is 14.942 with the significance level 0.000. The P value is less than 0.05 which represents the model is highly significant.
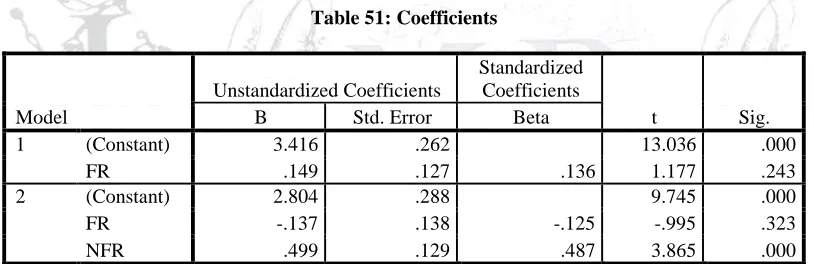
Table 51: Coefficients
Model
Unstandardized Coefficients
Standardized Coefficients
t Sig.
B Std. Error Beta
1 (Constant) 3.416 .262 13.036 .000
FR .149 .127 .136 1.177 .243
2 (Constant) 2.804 .288 9.745 .000
FR -.137 .138 -.125 -.995 .323
NFR .499 .129 .487 3.865 .000
a. Dependent Variable: Motivation
In the above table Beta represents change in the dependent variable (i.e. Motivation) because of changes in the two independent variables (that are financial rewards and Non-financial rewards). The beta or coefficient value of financial rewards factor is -0.137 which shows that when the independent variable value increases by one unit, the dependent variable, in response to this change in independent variables, decreases by 0.137 units which altogether in contrast to expected relation between the two factors. As expected, this estimate is statistically insignificant even at 90% level with T value equals to -0.995.
Conclusion
In modern age every organization despite of success, is most likely to face some problem. These problems could come into play due to lack of professional attitude of top management, lack of proper utilization of resources such as human resources, financial resources. Palace Continental Hotel Peshawar is an esteemed and prestigious organization, having its own reputation in Pakistan but there exists some non-motivating factors which caused frustration in employees and they could become nonproductive to the organization, which should be rectified in a proper way.
From the research it has shown that financial rewards did not have significant effect on motivation while non-financial rewards had significant effect on motivating employees. The reward was also found to have significant effect on motivation. Moreover it is found that employees are not solely motivated by either financial reward or non-financial reward i.e. a mix of both financial and non financial rewards should be there to motivate employees. The motivated would give maximum output and organization productivity is expected to increase.
References
Adams, J. S. (1965). Inequity in Social Exchange. In L. Berkowitz (ed). Advances in Experimental Social Psychology. New York: Academic Press.
Bucklin, B. R., & Dickinson, A. M. (2001). Individual monetary incentives: A review of different types of arrangements between performance and pay. Journal of Organizational Behavior Management, 21 (3), 45-137.
Carver, C. S., & Scheier, M. F. (1981). Attention and self-regulation: A control theory approach to human behavior. New York: Springer-Verlag.
Doeringer, P., Evans-Klock, C. & Terkla, D. (1998). Hybrids or Hodgepodges? Workplace Practices of Japanese and Domestic Startups in the United States. Industrial and Labor Relations Review, 51(2), 171-186.
Herzberg, F., Mausner, B., and & Snyderman, B. B. (1959).The motivation to work. New York: John Wiley and Sons.
Koontz, H., &Weihrich, H. (1999). Management: A Global Perspective. Tenth edition. McGraw Hill, p. 462
Kreitner, R. (1995). Management. Sixth edition: Bostan: Houghton Mifflin Company.
Locke, E. A., & Latham, G. P. (1990). A theory of goal setting and task performance. Englewood Cliffs, NJ: Prentice-Hall.
Maslow, A. H. (1943). A Theory of Human Motivation. Psychological Review, July 1943. pp. 370-396.
Milkovich, G. & Wigdor, A. (1991). Pay for performance: Evaluating performance appraisal and merit pay. Washington, DC: National Academy Press.
Senge (1990). The Fifth Discipline: The art and practice of the learning organization. New York: Doubleday.
Skinner, B.F. (1953). Science and Human Behavior. New York: Free Press
Vroom, V. H. (1964). Work and motivation. New York: Wiley.