ISSN: 2306-9007 Cheng & Wang (2014) 1889
I
www.irmbrjournal.com December 2014I
nternationalR
eview ofM
anagement andB
usinessR
esearchVol. 3 Issue.4
R
M
B
R
A Study of Value Investing: Profit, Dividend, and Free Cash
Flow
MING YUAN CHENG
Department of Business Administration, National Chung Cheng University, Taiwan Author Email: (Times New Roman 10 Font, Un-Bold, centered aligned)
Email: simoncheng0809@yahoo.com.tw Tel: +88652720411#34312
MING-CHANG WANG
Department of Business Administration, National Chung Cheng University, Taiwan Author Email:(Times New Roman 10 Font, Un-bold, centered aligned)
Email:mcwang@ccu.edu.tw Tel: +88652720411#34312
Abstract
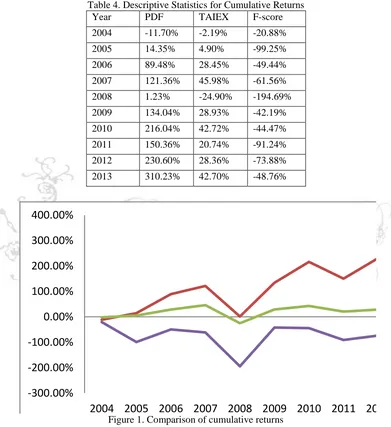
In this study, an investment decision-making model called the profit, dividend, and free cash flow (PDF) model was established based on companies’ profitability, dividend yield, and free cash flow. This study analyzed the stocks purchased and retained for a long period of time, and compared the PDF model with the Taiwan Capitalization Weighted Stock Index (TAIEX) and the F-score model modified by Lai, Doong, Yang, and Miao (2011). The empirical results indicated that the average cumulative return on TAIEX in 2004 was higher than that on the PDF and F-score portfolios. However, from 2005 to 2007, the cumulative return on the PDF portfolio increased from 14.35% to 121.36%. Although the cumulative return dropped to 1.23% in 2008 because of the financial crisis, the figure rose to 134.04% in 2009 and to 310.23% in 2013. The performance of TAIEX and the F-score portfolio was substantially lower than that of the PDF portfolio, but the performance of TAIEX was superior to that of the F-score portfolio. Although TAIEX and the F-score portfolio exhibited a similar trend, the cumulative return on the F-score portfolio was consistently negative. The F-score portfolio demonstrated the lowest performance among the 3 models. In addition, the annual cumulative or excess return on the PDF portfolio was higher than that on the F-score portfolio.
Key Words: Value Investing, Profit, Dividend, Free Cash Flow.
Introduction
Investment and financial management have received increased attention in recent years, and stocks have been considered to be a simple effective investment instrument. However, the number of investors who experience losses in the stock market exceeds the number of those who gained profits. Events such as the financial crisis in 2008 and the recent Eurozone crisis have negatively influenced the stock market, causing investors’ assets to decline considerably, and engendering uncertainty and unease among investors in the capital market. Therefore, this study intends to explore how investors should invest in stocks to earn profits and whether a simple investment strategy for conducting safe and efficient investment is available.
ISSN: 2306-9007 Cheng & Wang (2014) 1890
I
www.irmbrjournal.com December 2014I
nternationalR
eview ofM
anagement andB
usinessR
esearchVol. 3 Issue.4
R
M
B
R
stock market by observing the P–E ratio, P–B ratio, price–cash-flow (P–CF) ratio, and average-sales growth rate (GS) over 5 years. O'Shaughnessy (1996) analyzed the P–E, P–B, P–S, and P–CF ratios and considered capital stocks to investigate the U.S. stock market. In addition to using similar indicators, Bauman, Conover, and Miller (1998) employed the dividend rate and the expected-earnings growth rate to distinguish growth and value stocks. Chen (2004) examined the interactions among various conditions, months, scales, and monetary environments in the stock market in Taiwan to investigate whether the Taiwanese stock market contained value investing. Yu (2011) examined the stock market in Taiwan by examining the P–E ratio, bargaining counters of a juristic person, returns on equity, dividend yields, gross profit margins, and revenue growth. Domestic and foreign studies have revealed that the return on value investing portfolios was superior to the performance of the Taiwan Capitalization Weighted Stock Index (TAIEX) in the same period. However, value investing may be overly complex for general investors who do not possess a relevant academic background, compared with investing in growth stocks or TAIEX. Therefore, the objective of this study was to determine a simple method for value investing.
The use of the P–E ratio in the aforementioned studies may be problematic. A company, the profit of which is declining, may exhibit a low P–E ratio because of the previous high profit and the decrease in stock prices. Therefore, the stocks of this company may be mistaken for value stocks. This is a frequent problem encountered when using the P–E ratio and, thus, this study did not use the P–E ratio as a variable.
The P–B ratio, which has been frequently employed in previous studies, is also an indicator that may produce distorted result. In the Taiwanese stock market, a company that acquires substantial profits typically exhibits a high P–B ratio; by contrast, the stock prices of a company with low gains is lower than the book value of the stocks. Currently, although the value of TAIEX is above 9000, the P–B ratio of more than 30 firms is lower than 1, including firms with losses or low profits such as Genius and Altek. Typically, firms that have consistently gained high profits rarely exhibit stock prices lower than the book value of the stocks. Therefore, this study did not use the P–B ratio as a variable.
Buffett's philosophy of value investing emphasizes purchasing stocks of stable companies and retaining the stocks for a long period; the quality of a company is evaluated based on whether it can earn cash. Additionally, the company should be able to gain profits under any conditions. Based on these principles, this study established the profit, dividend, and free cash flow (PDF) model, which can be used to select companies based on the following three criteria:
(a) Profitability: A company’s net profit after tax over the 10 consecutive years in the research period is positive.
(b) Dividends: A company paid dividends (cash and stock dividends) for 5 consecutive years, and has an average dividend yield of more than 8% over those 5 years
(c) Free cash flow: The sum of free cash flows over the past 5 years is positive.
ISSN: 2306-9007 Cheng & Wang (2014) 1891
I
www.irmbrjournal.com December 2014I
nternationalR
eview ofM
anagement andB
usinessR
esearchVol. 3 Issue.4
R
M
B
R
In this paper, Chapter 2 presents a literature review explaining the relationship between stock prices and indicators used in previous value-investing studies and in this study. Chapter 3 describes the research design, including the indicators used in this study and those used for comparison. Chapter 4 presents the empirical results of an analysis conducted on the returns of the portfolios established using the stock selection criteria. The research conclusion and recommendations are stated in the final chapter.
Literature Review
Value Investing
Numerous studies have investigated the difference between value- and growth-investing strategies by using factors such as P–E, P–B, and P–S ratios. In addition, value investing has been demonstrated to be superior to growth investing. .
Lakonishock et al. (1994) examined P–E, P–B, and P–CF ratios and the average GS over 5 years to divide U.S. stocks into 10 groups by using one-factor classification. The groups that exhibited low ratios were defined as value stocks, and those with high ratios were defined as growth stocks. Subsequently, Lakonishock et al. analyzed stocks within the period of April 1963 to April 1990 and investigated the returns on the value and growth stocks. The empirical results revealed that the average return on value stocks was higher than that on growth stocks. However, the earnings of individual stocks may temporarily decline because of other factors, causing the stocks to be mistaken for growth stocks. Therefore, Lakonishock et al. further paired P–E, P–B, and P–CF ratios and GS, and divided the stocks into three groups by using two-factor classification. The groups were defined as value and growth stocks based on the same rule. The result was the same as that obtained using one-factor classification. Consequently, in the long term (3–5 years), the return performance of value stocks was superior to that of growth stocks.
Bauman et al. (1998) employed P–E ratio, dividend rate, and expected-earnings growth rate to distinguish the growth and value stocks. The average returns on these two types of stocks in Australia, Europe, and East Asia were analyzed. The results indicated that the return on value stocks was higher than that on growth stocks in all three regions.
Chan and Lakonishok (2004) extended the approach developed by Fama and French (1992), using P–E and P–B ratios to divide U.S stocks into value and growth stocks. They observed that the average return on stocks with low P–E ratios was higher than that on stocks with high P–E ratios, and the difference in systemic risk between the two types of stocks was nonsignificant. Furthermore, Chan and Lakonishok (2004) employed the sample used by Fama (1998) and added the P/CF ratio and dividend–price (DP) ratio. The results demonstrated that the return on value stocks was higher than that on growth stocks in almost all countries and that the differences in the standard deviation of return and the return volatility of the two types of stock investments were nonsignificant.
Yu (2011) used the historical data of listed companies in Taiwan to investigate whether a value stock selection strategy based on the bargaining counter of a juristic person can achieve optimal portfolio return. The data were recorded between June 2006 and September 2010. P–B and P–E ratios, return on equity, dividend yield, gross profit margin, and revenue growth were examined, and the bargaining counter of a juristic person was subsequently incorporated into the model. The results revealed that the return on the value of investment portfolios was superior to the performance of TAIEX within the same period.
ISSN: 2306-9007 Cheng & Wang (2014) 1892
I
www.irmbrjournal.com December 2014I
nternationalR
eview ofM
anagement andB
usinessR
esearchVol. 3 Issue.4
R
M
B
R
performance of high-value stocks were superior to those of the market and low-value stocks. In summary, the studies reviewed in this section indicated that the return performance of value stocks is significantly superior to that of TAIEX, demonstrating the value of value investing.
Earnings and Stock Price
Ball and Brown (1968) and Beaver, Clarke, and Wright (1979) asserted that a company’s earnings report can change investors’ expectations toward future stock returns. Because of these findings, empirical studies on the usefulness of accounting information became the focus of capital market research, and numerous domestic and foreign studies have subsequently explored the relationship between earnings and stock prices; these studies are reviewed in this section.
Ball and Brown (1968) investigated the relationship between accounting earnings changes and stock returns by examining a sample of 260 companies listed in the New York Stock Exchange between 1949 and 1965. Three earnings expectation models were used: index of changes in annual net profit after tax, index of changes in annual earnings-per-share after tax, and the random walk model. The research verified a significant correlation between the magnitude of unexpected earning changes and the abnormal performance index.
Beaver et al. (1979) further demonstrated the usefulness of accounting information by examining the correlation between the magnitude of changes in unexpected earnings and stock returns. The sample comprised 276 companies listed between 1965 and 1974. A market model was used to estimate the monthly stock excess returns for a company, which was totaled for 12 months to obtain the cumulative excess returns. Unexpected earnings were estimated by employing the random walk model and the market index model, and changes in unexpected earnings were estimated using standardized prediction errors and prediction error percentage. Based on the magnitude of changes in unexpected earnings, 25 investment portfolios were obtained. Spearman’s rank correlation was performed to test the correlation between the mean of unexpected earnings and the cumulative average abnormal return for each portfolio. The results showed that the magnitude of unexpected earning change and the cumulative average abnormal return were significantly correlated.
Freeman (1987) examined the monthly data of companies listed in the New York Stock Exchange between 1966 and 1982 to investigate the association between company size and earnings information, as well as stock prices. The result revealed that the correlation between earnings information and stock prices was significantly influenced by company size. Specifically, the stock price reaction to earnings in large companies occurred earlier than did that in small companies; the cumulative abnormal return in small companies was higher than was that in large companies.
Easton and Harris (1991) adopted the yearly information of listed companies from 1969 to 1986 as a research sample. In addition, they employed the random walk model to estimate expected earnings and investigate the correlation between stock returns and three variables (the levels of earnings in the previous and current periods and the change in earnings in the current period). The results indicated that the three earnings variables could be ranked in descending order based on their explanatory power for stock returns as follows: level of earnings in the current period, change in earnings in the current period, and level of earnings in the previous period.
ISSN: 2306-9007 Cheng & Wang (2014) 1893
I
www.irmbrjournal.com December 2014I
nternationalR
eview ofM
anagement andB
usinessR
esearchVol. 3 Issue.4
R
M
B
R
correlated. However, the relationship between the extraordinary items and stock returns was nonsignificant, indicating that the level of influence earnings components exert on stock returns varied based on persistence.
Huang (1995) determined whether earnings components (i.e., gross profit of sales, income tax, marketing and administrative expenses, and nonoperating profit and loss) were related to incremental information content. The research targeted 27 companied listed between 1971 and 1993 and adopted a first-order vector autoregression model for analysis. The empirical results indicated that the aforementioned earnings components exhibited strong explanatory power for returns, suggesting that all of these components were related to incremental information content.
Dividend Policy and Stock Price
The signaling hypothesis argues that the dividend announcement involves crucial information for the prediction of future company earnings and thus can influence stock price. According to Modigliani and Miller (1961), investors believed that an unexpected increase in dividends indicates an increase in a company’s future earnings. By contrast, a decrease in dividends indicates a decrease in company’s future earnings. Therefore, dividend announcements contain vital information. Akhigbe and Madura (1996) and Hand and Landsman (1999) agreed that dividend announcements are a channel for authorities to transmit information to investors and verified the positive correlation between dividend and stock price.
Chueh (1996) stated that the stock market in Taiwan exhibited a significant positive price reaction to dividend announcement; Taiwanese investors believed that dividends can be used to determine a company’s future profit performance. In stock market practices, when a company’s dividend is higher than expected, the company’s stock price increases accordingly. Lin (1999) demonstrated that when a higher amount of cash dividends than that of stock dividends is issued, a company’s value is positively affected. In addition, Chou (2005) proved the positive correlation between dividends and stock prices.
Regarding the relationship between dividend payout and company growth, Crutchley and Hansen (1989) and Chang and Rhee (1990) observed that a company with favorable growth opportunities required a large amount of capital for future expansion, and therefore did not possess excess cash to pay out cash dividends to investors. Tang (1994) and Lee (2001) also supported this finding.
Companies that possess favorable growth opportunities pay less cash dividends. Such companies may choose to pay stock dividends instead of cash dividends. For example, Wang (1997) and Lee (2001) both indicated that a company’s growth opportunities exhibited a positive influence on stock dividends. Elgers and Murray (1985) and Lakonishok and Lev (1987) both supported the hypothesis that stock dividends can be used by companies as financial signals to convey a positive expectation for future profits.
Lee (2001) determined the positive correlation between the earnings of companies listed in the TWSE and the stock dividends paid during the same period. Therefore, domestic studies have shown that companies’ profitability exhibited a positive effect on cash and stock dividends, enabling researchers to easily understand the influence of a company’s profitability on the payout of cash dividends. In other words, a company with high profitability is highly capable of paying cash dividends to its shareholders. The studies reviewed in this section all supported this result.
Free Cash Flow Hypothesis
ISSN: 2306-9007 Cheng & Wang (2014) 1894
I
www.irmbrjournal.com December 2014I
nternationalR
eview ofM
anagement andB
usinessR
esearchVol. 3 Issue.4
R
M
B
R
company managers tend to focus on personal interests and neglect shareholders’ interests; thus, managers may invest cash in company expansion to acquire numerous benefits. However, this may result in overinvestment, which generates agency costs. Particularly, inappropriate use of free cash flow and overinvestment can reduce the marginal efficiency of investment. Companies that desire to maximize company value can use earnings distribution or share repurchasing to pay funds to shareholders, rather than retaining the funds within the company. According to Devereux and Schiantarelli (1989), because the equity ownership in large companies is dispersed, large companies are substantially influenced by agency costs. Therefore, large companies’ cash flow exhibited a strong influence on investment.
Gul and Tsui (1998) examined the relationship between audit fees and free cash flow. Managers of companies that were not provided growth opportunities but possessed a large amount of free cash flow tended to engage in the manipulation of accounting data and other activities (including general expenses and investments) that were not related to maximizing company value. Their result revealed that companies with high free cash flow but low growth opportunities tended to charge relatively high audit fees. Grullon and Michaely (2004) examined the free cash flow hypothesis by focusing on the various features of companies at the growth and maturity stages. They reported that a company may possess numerous favorable investment projects, high capital expenditure, low free cash flow, and high earnings growth at the growth stage, and that asset growth opportunity caused companies’ systemic risk to increase, increasing capital costs. However, a company’s investment opportunities and capital expenditure decreased at the maturity stage; without measures for cash expenditure, the company may experience agency problems. Therefore, Grullon and Michaely (2004) determined whether companies that repurchased shares feature the characteristics of mature companies. If companies are categorized as mature companies, the goal of share repurchasing is to consume free cash. By contrast, if the companies are categorized as growing companies, the goal of share repurchasing is to convey positive news of future gains, indicating that operational performance may improve after repurchase is announced. The empirical results revealed that companies’ operational performance did not improve during the 3 years after repurchase was announced; several companies even exhibited poorer performance than did other nonrepurchasing companies. Therefore, the signaling hypothesis cannot explain motivation for share repurchasing. However, the free cash flow hypothesis was supported, because the repurchasing companies featured the characteristics of mature companies. Subsequently, Pawlina and Renneboog (2005) used British public companies as the research sample to investigate whether sensitivity to cash flow of investments was caused by agency costs or by information asymmetry. They reported that investments exhibited a strong influence on cash flow sensitivity, primarily because of the agency costs of free cash flow. They also identified the nonlinear relationship between insider ownership and the agency costs of free cash flow. Peng (2005) adopted the agency theory and pecking-order theory to verify the relationship between cash flow and investment behavior of companies listed in the TWSE, reporting that the capital investment behavior of these companies could be explained by the free cash flow hypothesis of the agency theory.
ISSN: 2306-9007 Cheng & Wang (2014) 1895
I
www.irmbrjournal.com December 2014I
nternationalR
eview ofM
anagement andB
usinessR
esearchVol. 3 Issue.4
R
M
B
R
Previous studies have demonstrated that value investing is superior to investment in TAIEX, suggesting the effectiveness of value investing. However, the approaches used by previous scholars were complex and difficult to understand for investors without relevant financial background. Moreover, past studies have predominantly used indicators such as P–E or P–B ratios (e.g., stocks with low P–E or P–B ratios were defined as value stocks), but this approach is problematic in practice. For example, the earnings-per-share of HTC in 2011 was NT$73.3, and the stock price of HTC at the end of 2011 was NT$497, yielding a P–E ratio of only 6.78. Compared with TAIEX, for which the P–E ratio was 15-fold to 20-fold, HTC stocks appeared to be much cheaper and thus should be suitable for value investing. However, if a person purchased and retained HTC stock until the end of July 2014, when the closing price was NT$132, the degree of loss is 73%; the HTC stock exhibited a low P–E ratio but realized high losses. This is because the gain of HTC stock substantially changed at that time, but P–E ratio was calculated using previous gains, thus distorting the calculated P–E ratio. Similarly, the P–B ratio, an indicator used by numerous scholars, is also problematic. A company that has consistently acquired stable profits may exhibit a relatively high P–B ratio; for example, in August 2014, when TAIEX was above 9000 points, the stock prices of more than 300 companies were lower than the net value, and most of these companies, such as Genius (3406) and CMC Magnetics (2323), had consistently experienced losses or low profits. By comparison, MediaTek (2454) and Hotai Motor (2207), which featured long-term high profitability and superior performance, exhibited P–B ratios higher than 3 and 7, respectively. However, despite their excellent profitability, they were not regarded as value stocks by previous scholars. This is an oversight of previous studies.
Therefore, unlike previous studies, this study did not use the conventional indicators. Instead, a self-developed PDF model that simultaneously considered profits, dividends, and free cash flow was used to understand whether this PDF method could outperform TAIEX and the F-score method frequently used by recent scholars for value investing analysis.
Research Design
Development of Investment Portfolios
Profit, Dividend, and Free Cash Flow Portfolio
The PDF portfolio was developed using three indicators: profitability, dividends, and free cash flow. The stock selection strategy involved selecting companies that met the following three criteria and analyzing their profit performance.
Profitability: A company’s annual net profit after tax over the 10-year research period is positive. In this study, the research period was between 2004 and 2013. Therefore, companies that possessed positive net profit after tax during these 10 years fulfilled the criterion of profitability.
Dividends: A company paid dividends for 5 consecutive years, and the average dividend yield over those 5 years was higher than 8%. The dividends involved cash and stock dividends. In this study, companies that paid dividends each year from 2009 to 2013 fulfilled this criterion. The dividend yield = (cash dividends for common stocks + stock dividends for common stocks) / end-of-year market value × 100%.
Free cash flow: The sum of free cash flows over the previous 5 years is positive. Free cash flow = net profit after tax + depreciation + amortization – fixed assets (acquisition) – [(current assets – current liabilities) at the end of a period – (current assets – current liabilities) at the beginning of a year].
F-Score Portfolio
ISSN: 2306-9007 Cheng & Wang (2014) 1896
I
www.irmbrjournal.com December 2014I
nternationalR
eview ofM
anagement andB
usinessR
esearchVol. 3 Issue.4
R
M
B
R
Stage 1: Identifying Excellent Companies
Company stocks were assessed and scored using the F-score method modified by Lai et al. (2010). A total of nine financial variables were considered; the stocks that met the criterion obtained 1 point. The F-score ranged from 0 to 9 points; stocks that obtained 8–9 points were in the high-score group. The criteria were as follows:
Return on assets (ROA): If the ROA in the current year is positive, the stock scores 1 point; if not, the stock scores 0 points. ROA = net profit after tax / average total assets. Average total assets = (beginning-of-year total assets + end-of-year total assets) / 2.
Change in total return on assets (∆ROA): This was calculated by subtracting the previous-year ROA from the current ROA. When ∆ROA is 0 or higher, the stock scores 1 point; if not, the stock scores 0 points.
Ratio of operating cash flow to average total assets (CFO): When CFO is positive, the stock scores 1 point; if not, the stock scores 0 points. CFO = operating cash flow / average total assets.
Accrual: Accrual was calculated by subtracting CFO from ROA. When accrual is negative, the stock scores 1 point; if not, the stock scores 0 points.
Change in debt ratio (∆LEVER): When the debt ratio in the current period is lower than that in previous period (i.e., when ∆LEVER is negative), the stock scores 1 point; if not, the stock scores 0 points. Debt ratio = total liabilities / total assets.
Change in current ratio (∆LIQUID):∆LIQUID was calculated by subtracting the previous current ratio from the current ratio in the current period. When ∆LIQUID is positive, the stock scores 1 point; if not, the stock scores 0 points. Current ratio = current asset / current liabilities.
Cash capital increase: One point was assigned for a cash capital increase in the current year; no points were assigned if cash capital did not increase.
Change in gross profit margin (∆MARGIN): This variable was calculated by subtracting the gross profit margin in the previous period from that in the current period. When ∆MARGIN is positive, the stock scores 1 point; if not, the stock scores 0 points. Gross profit margin = (net revenue – operating costs) / net revenue.
Change in total asset turnover (∆TURN): If total asset turnover in the current period is higher than that in the previous period (i.e., a positive value), the stock scores 1 point; if not, the stock scores 0 points. Total asset turnover = net revenue / average total assets.
Stage 2: Identifying Favorable Prices
The scores of the nine criteria were totaled for each stock; stocks that obtained 8 or 9 points were categorized into the high-score group. At the second stage, stocks in the high-score group were ranked based on BM ratio (book value per share / stock market value), and the stocks ranked in the top were placed in the high-BM (HBM) group. Thus, the HBM group comprised individual stocks selected using the F-score investment criteria.
Measurement of Stock Selection Performance
ISSN: 2306-9007 Cheng & Wang (2014) 1897
I
www.irmbrjournal.com December 2014I
nternationalR
eview ofM
anagement andB
usinessR
esearchVol. 3 Issue.4
R
M
B
R
purchase price (the closing price of the first month in the first year) and the selling price (the closing price at the end of each year) were used to calculate the cumulative return for each year. The excess return was calculated by subtracting the cumulative return on TAIEX from the cumulative return on individual stocks.
Data Period and Data Source
In this study, the data of stock prices and financial ratios were collected from the database of the Taiwan Economic Journal. The ex-right and ex-dividend prices were used as the stock prices. The data period was between January 2004 and December 2013, over a span of 10 years. The research sample consisted of listed and over-the-counter companies in Taiwan in 2013, which were selected based on the PDF and F-score portfolios. The finance and insurance industries were excluded from the analysis because of the unique characteristics of these industries.
Empirical Results
Descriptive Statistics
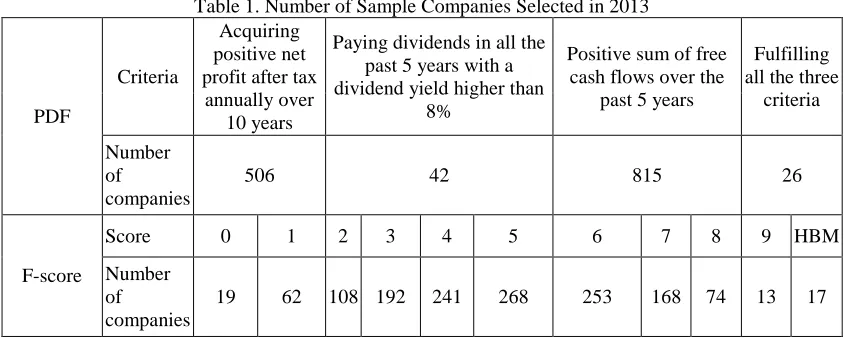
Table 1 displays the sample companies that were selected using the PDF and F-score criteria in 2013. Regarding the PDF criteria, 506 companies acquired positive net profits for 10 consecutive years; 42 companies paid dividends in all the past 5 years and possessed dividend yield higher than 8%; 815 companies possessed a positive sum of free cash flows over the past 5 years. A total of 26 companies fulfilled all the three criteria.
At the first stage of F-score assessment, the number of companies that acquired 0–2 points, 3–5 points, 6–7 points, and 8–9 points (high-score group) was 189, 701, 421, and 87 companies, respectively. At the second stage, the top 20 companies of the high-score group ranked in a descending order based on the BM ratio, were classified as the HBM group, which comprised 17 companies.
Number of companies and scores
The data involved the number of companies with various F-scores (1–9 points) and number of companies selected using the PDF criteria developed in this study.
Table 1. Number of Sample Companies Selected in 2013
Criteria
Acquiring positive net profit after tax
annually over 10 years
Paying dividends in all the past 5 years with a dividend yield higher than
8%
Positive sum of free cash flows over the
past 5 years
Fulfilling all the three
criteria
Number of
companies
506 42 815 26
F-score
Score 0 1 2 3 4 5 6 7 8 9 HBM
Number of
companies
19 62 108 192 241 268 253 168 74 13 17
ISSN: 2306-9007 Cheng & Wang (2014) 1898
I
www.irmbrjournal.com December 2014I
nternationalR
eview ofM
anagement andB
usinessR
esearchVol. 3 Issue.4
R
M
B
R
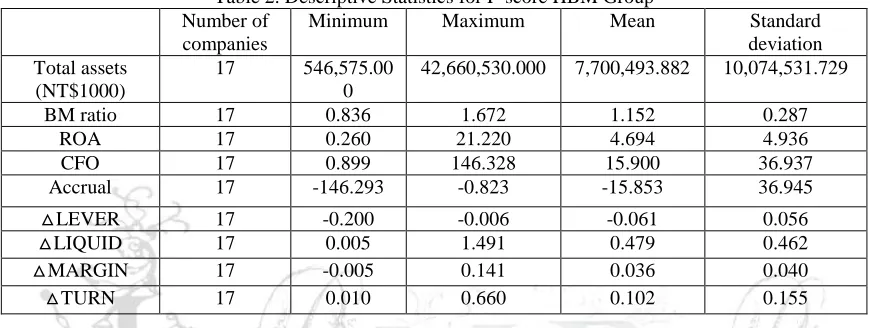
Descriptive statistics for F-score and PDF portfolios
Table 2 shows the descriptive statistics for the HBM group generated using the F-score method. The standard deviation of total assets was 10,074,531.729, signifying that the total assets of the sample companies differed considerably. The mean values for the analyzed data were as follows: BM ratio (1.152), ROA (4.494%), CFO (15.9), accrual (-15.853), △LEVER (-0.061), △LIQUID (0.479), △MARGIN (0.036), and △TURN (0.036). In addition, △TURN was 0.102. Because companies in the HBM group were selected based on the ranking of F-scores and BM ratios, they exhibited satisfactory performance in each indicator. Particularly, indicators of changes in debt ratio, current ratio, gross profit margin, and total asset turnover all increased between 2012 and 2013.
Table 2. Descriptive Statistics for F-score HBM Group Number of
companies
Minimum Maximum Mean Standard
deviation Total assets
(NT$1000)
17 546,575.00 0
42,660,530.000 7,700,493.882 10,074,531.729
BM ratio 17 0.836 1.672 1.152 0.287
ROA 17 0.260 21.220 4.694 4.936
CFO 17 0.899 146.328 15.900 36.937
Accrual 17 -146.293 -0.823 -15.853 36.945
△LEVER 17 -0.200 -0.006 -0.061 0.056
△LIQUID 17 0.005 1.491 0.479 0.462
△MARGIN 17 -0.005 0.141 0.036 0.040
△TURN 17 0.010 0.660 0.102 0.155
The individual stocks selected using the PDF method were companies that acquired net profits annually over 10 years. Therefore, company’s net profit after tax was also examined over a 10-year period. The minimal net profit after tax was 20,560, and the maximal value was 7,157,524, which were both positive. The mean value was 856,482.6, and the standard deviation was 1,383,811.285, indicating a substantial difference in net profit after tax among the various individual stocks. Companies that paid dividends for 5 consecutive years were selected; therefore, the dividend yield was observed on a 5-year basis. The mean dividend yield was 8.73% with a maximum and minimum of 20.75% and 4.35%, respectively. This study also observed the sum of free cash flow over the past 5 years, the mean value of which was 541,363.73.
Table 3. Descriptive Statistics for PDF Portfolio
Number
of companies
Min Max Mean Standard
deviation
Net profit after tax (NT$1000)
231 20560 7157524 856482.60 1383811.285
Dividend yield (%) 123 4.35 20.75 8.73 2.69951
Free cash flow (NT$1000)
123 -1090251 5509358 541363.73 901437.741
ISSN: 2306-9007 Cheng & Wang (2014) 1899
I
www.irmbrjournal.com December 2014I
nternationalR
eview ofM
anagement andB
usinessR
esearchVol. 3 Issue.4
R
M
B
R
in 2008 because of the financial crisis, it rose to 134.04% in 2009 and again to 301.23% in 2013. The performance of TAIEX and the F-score portfolio was inferior to that of the PDF portfolio, but the performance of TAIEX was superior to that of the F-score portfolio. Although TAIEX and the F-score portfolio exhibited a similar trend, the cumulative returns on the F-score portfolio were all negative and the F-score portfolio exhibited the lowest performance among the three.
Table 4. Descriptive Statistics for Cumulative Returns
Year PDF TAIEX F-score
2004 -11.70% -2.19% -20.88%
2005 14.35% 4.90% -99.25%
2006 89.48% 28.45% -49.44%
2007 121.36% 45.98% -61.56%
2008 1.23% -24.90% -194.69%
2009 134.04% 28.93% -42.19%
2010 216.04% 42.72% -44.47%
2011 150.36% 20.74% -91.24%
2012 230.60% 28.36% -73.88%
2013 310.23% 42.70% -48.76%
-300.00%
-200.00%
-100.00%
0.00%
100.00%
200.00%
300.00%
400.00%
2004 2005 2006 2007 2008 2009 2010 2011 2012 2013
TAIEX
F score
Figure 1. Comparison of cumulative returns
ISSN: 2306-9007 Cheng & Wang (2014) 1900
I
www.irmbrjournal.com December 2014I
nternationalR
eview ofM
anagement andB
usinessR
esearchVol. 3 Issue.4
R
M
B
R
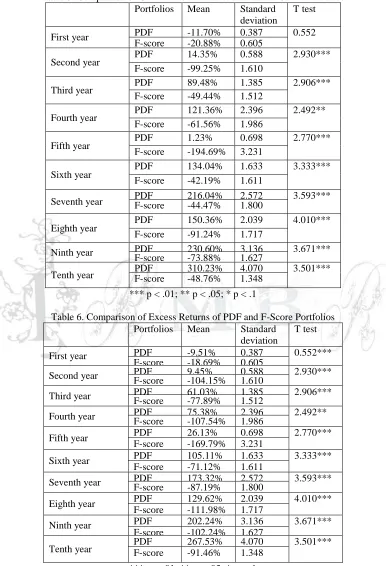
Table 5. Comparison of Cumulative Returns of PDF and F-Score Portfolios Portfolios Mean Standard
deviation
T test
First year PDF -11.70% 0.387 0.552 F-score -20.88% 0.605
Second year PDF 14.35% 0.588 2.930*** F-score -99.25% 1.610
Third year PDF 89.48% 1.385 2.906***
F-score -49.44% 1.512
Fourth year PDF 121.36% 2.396 2.492** F-score -61.56% 1.986
Fifth year PDF 1.23% 0.698 2.770***
F-score -194.69% 3.231
Sixth year PDF 134.04% 1.633 3.333*** F-score -42.19% 1.611
Seventh year PDF F-score 216.04% -44.47% 2.572 1.800 3.593***
Eighth year PDF 150.36% 2.039 4.010*** F-score -91.24% 1.717
Ninth year PDF 230.60% 3.136 3.671*** F-score -73.88% 1.627
Tenth year PDF F-score 310.23% -48.76% 4.070 1.348 3.501***
*** p < .01; ** p < .05; * p < .1
Table 6. Comparison of Excess Returns of PDF and F-Score Portfolios
Portfolios Mean Standard
deviation
T test
First year PDF -9.51% 0.387 0.552***
F-score -18.69% 0.605
Second year PDF F-score 9.45% -104.15% 0.588 1.610 2.930***
Third year PDF F-score 61.03% -77.89% 1.385 1.512 2.906***
Fourth year PDF F-score 75.38% -107.54% 2.396 1.986 2.492**
Fifth year PDF 26.13% 0.698 2.770***
F-score -169.79% 3.231
Sixth year PDF 105.11% 1.633 3.333*** F-score -71.12% 1.611
Seventh year PDF F-score 173.32% -87.19% 2.572 1.800 3.593***
Eighth year PDF 129.62% 2.039 4.010*** F-score -111.98% 1.717
Ninth year PDF 202.24% 3.136 3.671*** F-score -102.24% 1.627
Tenth year PDF F-score 267.53% -91.46% 4.070 1.348 3.501***
ISSN: 2306-9007 Cheng & Wang (2014) 1901
I
www.irmbrjournal.com December 2014I
nternationalR
eview ofM
anagement andB
usinessR
esearchVol. 3 Issue.4
R
M
B
R
Financial Dimensions
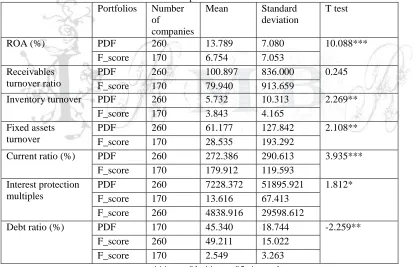
This study used financial indicators to analyze the profitability, operational capacity, financial structure, and solvency of the companies selected by using the PDF and F-score methods. T tests were then conducted to examine the differences between the PDF and F-score portfolios. Because the returns were observed over a period of 10 years, the financial indicators were analyzed over 10 years. Table 7 presents the comparison of financial dimensions between the PDF and F-score portfolios. Profitability was determined using ROA. In this study, the average ROA of companies in the PDF portfolio was significantly higher than that of companies in the F-score portfolio at a 1% significance level. The operational capacity was determined based on the receivables turnover ratio, inventory turnover, and fixed assets turnover, all of which were higher for the PDF portfolio compared with those of the F-score portfolio. In addition, only the difference in receivables turnover ratios was nonsignificant. Regarding he financial structure, the debt ratio for the PDF portfolio was significantly lower than that for the F-score portfolio at a 5% significance level. Solvency was measured using the current ratio and interest protection multiples (Table 7), which were significantly higher for the PDF portfolio than those for the F-score portfolio at a 1% and 10% significance level, respectively. Consequently, the comparison described in this section indicated that the profitability, operational capacity, financial structure, and solvency of the PDF-selected companies all surpassed those of the HBM group companies selected using the F-score method.
Table 7. The comparison of financial dimensions Portfolios Number
of
companies
Mean Standard deviation
T test
ROA (%) PDF 260 13.789 7.080 10.088***
F_score 170 6.754 7.053
Receivables turnover ratio
PDF 260 100.897 836.000 0.245
F_score 170 79.940 913.659
Inventory turnover PDF 260 5.732 10.313 2.269** F_score 170 3.843 4.165
Fixed assets turnover
PDF 260 61.177 127.842 2.108**
F_score 170 28.535 193.292
Current ratio (%) PDF 260 272.386 290.613 3.935*** F_score 170 179.912 119.593
Interest protection multiples
PDF 260 7228.372 51895.921 1.812* F_score 170 13.616 67.413
F_score 260 4838.916 29598.612
Debt ratio (%) PDF 170 45.340 18.744 -2.259**
F_score 260 49.211 15.022 F_score 170 2.549 3.263
*** p < .01; ** p < .05; * p < .1
ROA = [net income from continuing operations + interest expense × (1%–17%)] / average total assets × 100
Receivables turnover ratio = year revenue / average receivables Inventory turnover = year revenue / average inventory
Fixed assets turnover = year revenue / average fixed assets Current ratio = current assets / current liabilities × 100
ISSN: 2306-9007 Cheng & Wang (2014) 1902
I
www.irmbrjournal.com December 2014I
nternationalR
eview ofM
anagement andB
usinessR
esearchVol. 3 Issue.4
R
M
B
R
Conclusion
In previous studies, stocks were selected using a combination of indicators, and returns were examined over a period of 1 or 2 years (Lai et al. 2010). This study selected stocks based on profit, dividend, and free cash flow and observed the long-term returns on the selected stocks. The results revealed that the 10-year cumulative returns on the stocks selected using the PDF method were significantly higher than those for the stocks selected using the F-score method. Moreover, the financial ratios (including ROA, receivables turnover ratio, inventory turnover, fixed assets turnover, current ratio, interest protection multiples, and debt ratio) of the PDF portfolio and the F-score portfolio were compared. The comparison results showed that companies selected using the PDF method possessed superior profitability, operational capacity, financial structure, and solvency, compared with companies selected using the F-score method.
Research Contributions and Implications
The PDF model developed in this study contained only three indicators: positive net profit after tax for 10 consecutive years, dividends paid over the past 5 years with a dividend yield higher than 8%, and a positive sum of free cash flows over the past 5 years. The returns on the PDF portfolio were superior to those on the F-score portfolio. Moreover, the PDF stock-selection method is simple and convenient. Therefore, investors can employ the PDF method proposed in this study to select and invest stocks that can generate long-term stable returns.
In the academic field, value stocks should be used for long-term investment to avoid an increase in transaction costs and a reduction in profits. However, previous studies have focused on the 1- or 2-year return on investment, overlooking the long-term return on value investing. In this study, the returns on value investing over a period of 10 years were analyzed. Future studies can compare various investment strategies based on the findings of this study to propose an optimal investment strategy.
Future Research and Limitations
This study examined only companies’ previous profit performance without considering the future development of various industries. Hence, future studies can analyze the development of individual industries to propose appropriate investment strategies. Moreover, this study only focused on the stock market in Taiwan, which is an emerging market in East Asia; therefore, the findings of this study may be inapplicable to other countries. The indicators adopted in this study should be adjusted based on the specific characteristics of individual countries.
References
Akhigbe, A., & Madura, J. (1996). Dividend Policy and Corporate Performance. Journal of Business
Finance and Accounting, 23(9&10), 1267-1287.
Al-Mashari, M., & Zairi, M. (1999). BPR implementation process: an analysis of key success and failure factors. Business Process Management Journal, 5(1), 87-112.
Ball, R., & Brown, P. (1968). An empirical evaluation of accounting income numbers. Journal of accounting research, 159-178. 18. W. S. Bauman, C. M. Conover and R. E. Miller, “Growth versus Value and Large-Cap versus Small-Cap Stocks in International Markets,” Financial Analysts Journal,
75-89,March/ April, 1998.
Beaver, W. H., Clarke, R., & Wright, W. F. (1979). The association between unsystematic security returns and the magnitude of earnings forecast errors. Journal of accounting research, 316-340.
Belmiro, T. R., Gardiner, P. D., Simmons, J. E., & Rentes, A. F. (2000). Are BPR practitioners really addressing business processes? International journal of Operations and production management,
ISSN: 2306-9007 Cheng & Wang (2014) 1903
I
www.irmbrjournal.com December 2014I
nternationalR
eview ofM
anagement andB
usinessR
esearchVol. 3 Issue.4
R
M
B
R
Cao, G., Clarke, S., & Lehaney, B. (2001). A Critique of BPR from a holistic perspective. Business Process
Management Journal, 7(4), 332-339.
Chan, L. K., & Lakonishok, J. (2004). Value and growth investing: Review and update. Financial Analysts Journal, 71-86.
Chang, R. P., & Rhee, S. G. (1990). The impact of personal taxes on corporate dividend policy and capital structure decisions. Financial Management, 19, 21-31.
Chen, C. L. (2004). A Study of Value Investing Style in the Stock Market in Taiwan (Unpublished master's thesis). National Chengchi University, Taipei.
Chen, Y. H. (2012). The Study of Relationship between Free Cash Flow and Performance: The Mediation Effects of Short-term and Long-term Investments (Unpublished master's thesis). National Chiao Tung University, Hsinchu.
Chou, Y. S. (2005). Dividend and Stock Price Connection Research (Unpublished dissertation). Tamkang University, Taipei.
Chueh, H. S. (1996). A Study of Dividend Signaling and Announcement Effect (Unpublished dissertation). National Chengchi University, Taipei.
Crutchley, C. E., & Hansen, R. S. (1989). A test of the agency theory of managerial ownership, corporate leverage, and corporate dividends. Financial Management, 18, 36-46.
Davenport, T. (1993). Process Innovation: Reengineering Work through Information Technology. Boston: MA: Harvard Business School Press.
Devereux, M., & Schiantarelli, F. (1990). Investment, financial factors, and cash flow: Evidence from UK panel data. In Asymmetric information, corporate finance, and investment (pp. 279-306). University of Chicago Press, 1990.
Easton, P. D., & Harris, T. S. (1991). Earnings as an explanatory variable for returns. Journal of accounting research, 19-36.
Elgers, P. T., & Murray, D. (1985). Financial Characteristics Related To Managements'stock Split And Stock Dividend Decisions. Journal of Business Finance & Accounting, 12(4), 543-551.
Freeman, R. N. (1987). The association between accounting earnings and security returns for large and small firms. Journal of Accounting and Economics, 9(2), 195-228.
Graham, Benjamin (2002). The Intelligent Investor: A Book of Practical Counsel (C. C. Yu, Trans.). Taipei: IPC International Publishing.
Grey, C., & Mitev, N. (1995). Re-engineering organizations: a critical appraisal. Personnel Review, 24(1), 6-18.
Grullon, G., & Michaely, R. (2004). The information content of share repurchase programs. The Journal of Finance, 59(2), 651-680.
Gul, F. A., & L Tsui, J. S. (1997). A test of the free cash flow and debt monitoring hypotheses: Evidence from audit pricing. Journal of Accounting and Economics, 24(2), 219-237.
Hand, J. R., & Landsman, W. R. (1999). The pricing of dividends in equity valuation. Available at SSRN 169300.
Huang, H. C. (1995). The Incremental Information Content of Earnings Components (Unpublished dissertation). National Chung Hsing University, Taichung.
Jensen, M. C. (1986). Agency costs of free cash flow, corporate finance, and takeovers. The American
economic review, 323-329.
Lai, J. Y., Doong, S. C., Yang, S. Y., & Miao, C. H. (2011). Value Investing: An Application of Financial Statement and Public Announcement Information. Review of Securities and Futures Markets, 22(4), 123-182.
Lakonishok, J., & Lev, B. (1987). Stock splits and stock dividends: Why, who, and when. The Journal of Finance, 42(4), 913-932.
Lakonishok, J., Shleifer, A., & Vishny, R. W. (1994). Contrarian investment, extrapolation, and risk. The journal of finance, 49(5), 1541-1578.
ISSN: 2306-9007 Cheng & Wang (2014) 1904
I
www.irmbrjournal.com December 2014I
nternationalR
eview ofM
anagement andB
usinessR
esearchVol. 3 Issue.4
R
M
B
R
Lin, F. L. (2010). Do Free Cash Flow and Sale Growth Affect Firm Performance in Taiwan? Application of Panel Threshold Model. Journal of Accounting and Corporate Governance, 7(1), 1-30
Lin, M. Y. (1999). The Correlation between Dividend Policy of Taiwanese Companies and Stock Price (Unpublished master's thesis). National Chung Cheng University, Chiayi.
Luo, W., & Tung, A. Y. (1999). A framework for selecting business process modeling methods. Industrial Management & Data Systems, 99(7), 312-319.
Miller, M. H., & Modigliani, F. (1961). Dividend policy, growth, and the valuation of shares. The Journal of Business, 34(4), 411-433.
O’Shaughnessy, J. (1996) What Works on Wall Street: A Guide to the Best- Performing Investment Strategies of All Time. McGraw-Hill: New York.
Pawlina, G., & Renneboog, L. (2005). Is Investment‐Cash Flow Sensitivity Caused by Agency Costs or Asymmetric Information? Evidence from the UK. European Financial Management, 11(4), 483-513. Peng, Y. H. (2005). The Cash Flow and Investment Relationship from Taiwan Listed Firms. Hsuan Chuang
Journal of Management, 2(2), 119-133.
Strong, N., & Walker, M. (1993). The explanatory power of earnings for stock returns. Accounting Review,
385-399.
Tang, M. L. (1994). An Empirical Study on Management Motivations for the Dividend Policy in Taiwanese Listed Companies (Unpublished master's thesis). National Cheng Kung University, Tainan. Yu, P. H. (2013). Analysis of the Fundamental Value of Taiwan Listed Stocks (Unpublished master's
thesis). National Cheng Kung University, Tainan.