Published online February 20, 2013 (http://www.sciencepublishinggroup.com/j/optics) doi: 10.11648/j. optics.20130201.11
Modeling of vibration sensing with variable fabry-perot
system
Fadhali Mohamed
Physics Dept., Faculty of Science, Ibb University, Ibb, Yemen
Email address:
[email protected] (F. Mohamed)
To cite this article:
Fadhali Mohamed. Modeling of Vibration Sensing with Variable Fabry-Perot System, Optics. Vol. 2, No. 1, 2013, pp. 1-6. doi: 10.11648/j.optics.20130201.11
Abstract:
The application of Fabry-Perot (FP) system for vibration sensing is theoretically analyzed and successfullydemonstrated by simulation. The separation between the reflecting mirrors of the FP is varying in accordance with the sensed vibration that is in contact with the freely movable mirror. The variable separation is modeled as a small uniform sinusoidal perturbation that satisfies the constructive multiple beam interference inside the cavity. The variation of the separation be-tween the two mirrors of the FP induces a phase variation to the reflected laser beam employed in the system. The constructed signals by signals processing and transformation reveal the effectiveness of the method for vibration sensing and hence the applicability for gravitational and seismic waves monitoring.
Keywords:
Fabry Perot, Vibration- Interference, Signal, FFT- Perturbation1. Introduction
Vibration plays a major role in various fields and the study of its influences can widely be found in the aeronau-tics and aerospace industry, in civil engineering, manufac-turing, precision mechanics and mechatronics applications, as well as in the ever-evolving microelectronics sector [1,2,13,16]. Vibration analysis not only allows the perfor-mance limits of an engineering component to be deter-mined but can also be employed for damage detection in important objects so that preventive maintenance can be carried out before the occurrence of critical failure. Me-chanical vibration measurement allows one to characterize and study the performance of a mechanical system such as a machine operated not only under normal conditions but also at various levels of its operating cycle to meet increasing demands of higher productivity and economical design which, in turn, can lead to higher operating speeds and effi-ciency [1,2]. Besides vibrations, there are many physical and chemical [3,4,6,8] parameters that have been under inves-tigation through various sensing mechanism and effects. Acoustic waves sensing applications have been widely re-quired for many industrial applications [2,4,5]. Therefore, the choice of a particular sensor type for a given sensing application depends upon the parameters being measured and the physical properties of the sensor. The parameter being measured can be vibration, strain, temperature,
pres-sure, gas contents, chemicals or biochemicals or force on the structure [3,4,6,12,15,16, 21, 27].
A vibration sensor can be thought of as a very highly sensitive accelerometer with no direct current (dc) output requirement. Applications for these devices include geo-physical sensing, machinery vibration and failure predic-tion, tracking and identification of vehicles or personnel, and underwater pressure gradient sensing [15, 17, 22, 23]. Most vibration sensors (displacement sensors or accelero-meters) are based on a suspended proof mass which is connected to the case using springs. Vibration sensors use the displacement of the base as the excitation mechanism for the proof mass. The relative displacement of the proof mass with respect to the case is a function of the base vi-bration amplitude and frequency. When the ratio of work-ing frequency over the sensor’s natural frequency becomes very small, the relative displacement of the suspended mass becomes proportional to the acceleration.
In this case the sensor can be used as an accelerometer. However, if the sensor’s natural frequency is small com-pared to the working frequency; the relative displacement approaches the displacement of the case. This type of sen-sor can be used as a displacement sensen-sor [5, 16,17,19].
Optical sensors utilizing a Fabry-Perot cavity have been demonstrated to be attractive for the measurement of tem-perature, strain, pressure and displacement, due to their high sensitivity.
Fabry-Perot cavity based pressure sensors have been re-ported in a variety of configurations, such as those using modulation of the air gap of a Fabry-Perot interferometer by deflection of a diaphragm and interferometric detection of the stress-dependent resonant frequency of an optically excited vibrating beam [9,10,11,14,16,17]. A simple Fa-bry-Perot cavity-based pressure sensor consists of a diaph-ragm, which deflects in response to a change in pressure. The diaphragm deflection changes the depth of the cavity and thus the conditions for optical interference when light is reflected from successive reflections of the initial beam. As the diaphragm moves in response to pressure, the Fa-bry-Perot reflectance changes accordingly. There are dif-ferent designed structures for those Fabry-Perot cavi-ty-based pressure sensors. Surface micro-machined Fa-bry-Perot cavity based pressure sensor has been reported [22,26,27] where dielectric film stacks consisting of layers of silicon dioxide and silicon nitride were used as mirrors.
A fiber-optic pressure micro-sensor suitable for medical instruments such as catheters and endoscopes has also been developed. The sensing element consists of a diaphragm structure, glass plate and alignment structure. Pressure measurements of the sensor with sufficient sensitivity (0.19 µW MPa-1 on the average) and accuracy have been ob-tained [23,24,25]. Microelectro-mechanical systems (MEMS) techniques made Fabry-Perot sensors more attrac-tive by reducing the size and the cost of the sensing ele-ment [26]. Miniaturization of sensors (< 1mm) will lead to realization of dense sensor arrays that will change the state-of-the-art of pressure mapping. Fabry-Perot cavi-ty-based sensors for pressure sensing are currently the most promising market. Some of the common applications
in-clude biomedical blood pressure sensing, industrial process monitoring and automotive engine control. Fabry-Perot sensors illuminated with LEDs, an interrogation method employing optical spectrum modulation was demonstrated on biomedical pressure and temperature sensors. The sen-sor signal is the ratio of measured input and output, which is used to detect the spectral shift.
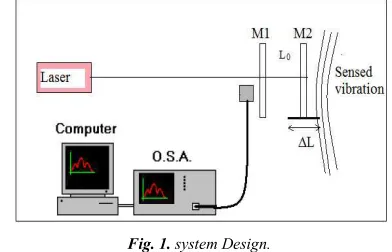
This paper introduces a sensing technique employing a Fabry Perot system with one movable mirror. A schematic diagram of a fully-integrated version of an optical dis-placement sensor is shown in fig.1. The movable mirror is the sensor part that is in contact with the sensed vibration. This mechanism relies on the modulation of the reflected signal according to the sensed vibration. The system design ensures that the mirror position is always perpendicular to the optical axis.
Fig. 1. system Design.
2. Theoretical Model
The reflected amplitude is calculated by summing all re-flected waves. Different waves differ in phase due to the optical path difference (2mLn) and in amplitude due to reflection and transmission by ( ′ ′2m−1
r t
t ). Let the ampli-tude of the incident wave be Ei and the ampliampli-tude of the reflected wave be Er with the phase difference (δ) taken into account as a factor and adding the amplitudes of the re-flected rays
) exp( 1
) exp( ) exp( 1
) exp( 1
1 ) exp(
)) exp( ( ) exp(
) 2 exp( )
2 exp(
0 0
2
δ δ δ
δ δ
δ δ
i R
i T i R r E
i R r T i E r E
i R r T i E r E
mknL i r r t t knL i E r E E
i i i
m m
i i
m m i
i r
− − −
=
− −
= − =
′ ′ ′ +
=
∑
∑
∞= ∞
=
(1)
Where, k=2πn/L is the wave number and L is the FP
cavity length.
r
r′=− is the reflection coefficient and t=t′is the trans-mission coefficient.
The reflectivity and transmissivity are given by
R t t T r r
R= ′2= 2 ; = ′=1−
(2)
The intensity is given by *
. r
r
r E E
) 2 / ( sin 1 ) 2 / ( sin 4 ) 1 ( ) 2 / ( sin 4 cos 2 1 )) cos( 1 ( 2 2 2 2 2 2 δ δ δ δ δ F F R R R R R R I I i r + = + − = + − − = (3)
In a similar manner the ratio between the transmitted and incident intensity is given by as
) 2 / ( sin 1 1 ) 2 / ( sin 4 ) 1 ( ) 1 ( cos 2 1 ) 1 ( 2 2 2 2 2 2 δ δ δ F R R R R R R I I i t + = + − − = + − − = (4)
Where, (1 sin2(δ /2) (θ)
A
F =
+ ) is Airy function and
2
) 1 /(
4R R
F = − is the cavity finesse. The phase differ-ence in terms of the modeled variable FP cavity length is given as 0 / ) cos 2 (
2π θ λ
δ= nL (5)
For normal incidence, δ = 4πnL /λ0 .
L represents the variable FP cavity length. It is modeled as follows ) sin( ) 4 / ( 0 0
0+∆ = + λ +ϕ
=L L L n wt
L s (6)
Lo is the original cavity length and ∆L represents the variation in the cavity length induced by the sensed vibration. ws is the frequency of the sensed vibration or transducer,
ϕ
is the possible pre-existing phase, λ0 is the laser beam wa-velength and n is the cavity refractive index. The quality factor of the FP system is given in terms of the finesse coefficient ζ as:) 1 ( / 2 /
2 nL nL R R
Q= π ζ = π λo − (7)
3. Results and Analysis
The results of this work are based on the developed model and mechanism. The experimental design will fol-low the above mentioned arrangement in which the sensing part is attached to the movable mirror either directly or through a suitable transducer as depicted in fig.1. In this model which is originally based on the multiple beam in-terference the cavity length variation is modeled by consi-dering the variation as a sinusoidal small perturbation to the cavity length with an amplitude of (λ/4) which due to ref-lection is doubled to become (λ/2) satisfying the construc-tive interference at the limiting values of the term
) sin(wst+ϕ .
As shown in fig.2 the variation of the reflected intensity with time clearly demonstrates the sensing capability for different frequency values that principally represents vibra-tions or mechanical frequencies. This real time intensity variation can be processed using different signal processing mechanisms to get the desired information and hence relate each intensity value to its corresponding frequency.
Fig. 2. The reflected intensity distribution with time for different vibration frequencies in long time interval range.
This method is effective for different range of frequen-cies and also for different laser beam probes. It is expected that this system can experimentally developed based on the above model to monitor seismic and gravitational waves activities and hence forecasting earth quakes Tsunamis and volcanoes.
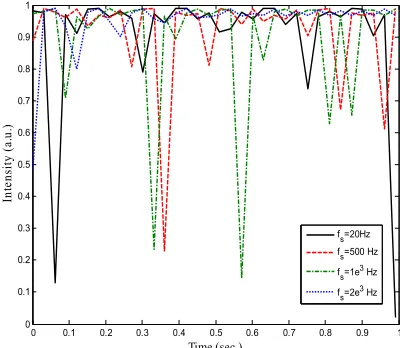
When repeating the analysis for small time range, the result shown in fig.3 is obtained for different vibration fre-quencies. It is obvious that the detection of higher vibration frequencies was better demonstrated in the case of small detection time range analysis and the lower frequencies showed higher peaks at larger detection time range. The high peaks in all cases appeared at certain times that at which the resonance is occurring between the detected vi-bration frequencies with that ensued from the cavity length variation.
Fig. 3. The reflected intensity distribution with time for different vibration frequencies in short time interval range.
The Fast Fourier Transform analysis has been performed for the result obtained by fixing the sensed vibration at 2
0 100 200 300 400 500 600 700 800 900 1000
0 0.1 0.2 0.3 0.4 0.5 0.6 0.7 0.8 0.9 1 Time (sec) R e le c te d I n te n si ty ( a .u .) f s=20Hz fs=500Hz fs=1e3Hz fs=2e3Hz
0 0.1 0.2 0.3 0.4 0.5 0.6 0.7 0.8 0.9 1
0 0.1 0.2 0.3 0.4 0.5 0.6 0.7 0.8 0.9 1 Time (sec.) In te n si ty ( a .u .)
fs=20Hz
fs=500 Hz
fs=1e3 Hz
f s=2e
kHz at small detection time range, fig.4.
Fig. 4. The reflected intensity distribution with time for one specific vibra-tion frequency in short time interval range.
The FFT analysis that is extensively described elsewhere in various literatures was performed here to process the obtained signals and convert from time domain to frequen-cy domain basis. Fig.5 depicts the constructed signal from the result in fig.3. The constructed signal in frequency do-main shows the reflected intensity distribution versus the frequency. The signal obtained signals can be recorded at various time intervals and compared with some signals obtained for normal vibration situations.
Fig. 5. The FFT constructed signal as a function of frequency.
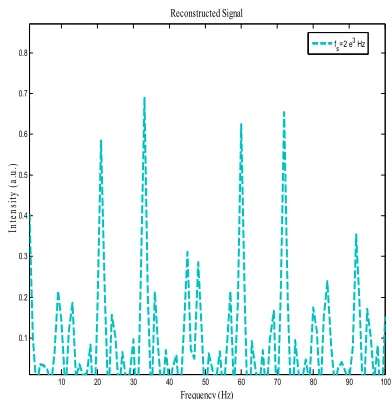
The signals can be reconstructed for a spatial frequency 40 cycles across the signal to obtain the results shown in fig.6. A better trend was obviously generated and hence intensity peaks were nearly symmetrically repeated across the detected signal.
Fig. 6. The FFT re-constructed signal as a function of frequency for 40 cycles.
As the detected signal has some noise or peaks that can-not be analyzed to interpret the detected signal, the proce-dures of signal processing techniques require some sort of filtering to get interpretable signal that carry useful infor-mation about the measurand with minimized noise. Fig. 7 shows the simulated high pass mask. It represents a Gaus-sian distribution to the intensity with frequency. Filters can be applied by multiplying the transform by a set of weights and then transforming back. This is equivalent to convolv-ing the original profile with a mask that is the transform of the set of weights. The weighted Fourier transform (WFT) is a variation on the Fourier transform over arbitrary fields involving weighting the input before transforming it. Multiply the FFT by the mask gives the result shown in fig. 8. Transforming back by using inverse fast Fourier trans-form (IFFT), the high-pass filtered signal is obtained as depicted in fig. 9 which is the finally desired intensity dis-tribution with frequency. This result gives a variation of the reflected signal with multiple peak fluctuations. It is easily interpreted and related to the sensed vibration signals.
Fig. 7. The simulated high pass Gaussian mask.
0 0.1 0.2 0.3 0.4 0.5 0.6 0.7 0.8 0.9 1
0.1 0.2 0.3 0.4 0.5 0.6 0.7 0.8 0.9 1
Time (Sec.)
R
e
fl
e
c
te
d
I
n
te
n
si
ty
D
is
tr
ib
u
ti
o
n
(
a
.u
.)
f
s=2 e 3 Hz
0 10 20 30 40 50 60 70 80 90 100
0 1 2 3 4 5 6 7 8
9 Intensity as a function of frequency (constructed Signal)
Frequency (Hz)
In
te
n
si
ty
D
is
tr
ib
u
ti
o
n
(
a
.u
.)
10 20 30 40 50 60 70 80 90 100
0.1 0.2 0.3 0.4 0.5 0.6 0.7 0.8
Reconstructed Signal
Frequency (Hz)
In
te
n
si
ty
(
a
.u
.)
fs=2 e3 Hz
0 10 20 30 40 50 60 70 80 90 100
0 0.1 0.2 0.3 0.4 0.5 0.6 0.7 0.8 0.9 1
High-pass mask
Frequency (Hz)
In
te
n
si
ty
D
is
tr
ib
u
ti
o
n
(
a
.u
Fig. 8. The resulted signal from the weighted FFT transform with confined oscillation peaks constrained by the high pass mask.
Fig. 9. The resulted high pass filtered signal with IFFT transform.
The induced variation of the FP cavity length which is described by Eq.(6) is found to cause a periodic variation of the phase difference to the multi-reflected beams inside the FP cavity. This variation is depicted in Figure (10). It is worth to mention here that if the detected vibration was not symmetrically periodic which is the expected actual case, the phase change may also flow the same perturbation as the modeled cavity length variation that represents a trans-lation to the induced effect by the sensed vibration either directly or through a suitable transducer.
Fig. 10. The phase variation of the multiply reflected beams with time.
The simulated variation of FP cavity length with time is depicted in fig. 11. It shows a periodic variation of the cav-ity length with time for a period of 10 Seconds. It is also expected to get the same trend for larger time intervals be-cause the modeled length variation assumes a uniform and symmetrical vibration at the sensed location. It is empha-sized here that the above mentioned modeling could also be applied with a non-uniform perturbation that is fluctuates with time which is also one of the major concerns of this research.
Fig. 11. The simulated variation of FP cavity length with time.
The phase variation incurred by cavity length variation shows a linear trend with direct proportionality as it is theoretically expected from Eqs.(5&6). The simulated li-near relationship between the phase change and FP cavity length is depicted in fig. 12.
Fig. 12. The simulated linear relationship between the phase change and FP cavity length.
4.
Conclusion
This paper discussed a theoretical model and simulation analysis of an adopted vibration sensing system employing a variable Fabry Perot cavity. The detected signal by reflec-tion as a funcreflec-tion of sensing time is used as a mean of real time monitoring mechanism. The employed model relayed mainly on the multiple beam interference analysis and the variation of the FP cavity length is considered as a uniform perturbation with sinusoidal trend. The amplitude of the perturbation is (λ/4) which by reflection becomes (λ/2) sa-tisfying the constructive interference condition. Detected
0 10 20 30 40 50 60 70 80 90 100
0 0.5 1 1.5 2 2.5 3 3.5
Weighted transform
Frequency (Hz)
In
te
n
si
ty
D
is
tr
ib
u
ti
o
n
(
a
.u
.)
0 10 20 30 40 50 60 70 80 90 100
-0.2 -0.15 -0.1 -0.05 0 0.05 0.1 0.15 0.2 0.25
0.3 High-pass Filtered Signal
Frequency (Hz)
In
te
n
si
ty
D
is
tr
ib
u
ti
o
n
(
a
.u
.)
0 1 2 3 4 5 6 7 8 9 10
4.9998 4.9998 4.9999 4.9999 5 5 5.0001 5.0001 5.0002 5.0002x 10
-3
Time (Sec.)
F
P
C
a
v
it
y
L
e
n
g
th
(
m
)
signals are processed with FFT, IFFT transformation to get informative signals in the frequency domains. The obtained results ensured the feasibility of experimentally implement the system and resulted peaks represents the positions at which the resonance is occurring between the detected fre-quency and that of the vibrated cavity. A comparison me-thod can be developed to get information about the sensed vibration and its strength and hence forecasting reports are issued according to that. The analysis showed that any range of mechanical frequencies can be detected and processed and hence real time monitoring of gravitational waves, earth quakes and volcanoes is feasible.
References
[1] W. Demtröder, “Laser Spectroscopy Vol. 1: – Basic Prin-ciples”, Springer-Verlag, Berlin/Heidelberg, 4th edition, 144-156 (2008).
[2] G.Chung, D.Phan.” Finite element modeling of surface acoustic waves in piezoelectric thin films”. J. Korean Phys. Soc., 57, 446-450(2010).
[3] T. W. Du Bosq, A. V. Muravjov, R. E. Peale, and C. J. Fre-dricksen, “Multi-layer silicon cavity mirrors for the far-infrared p-Ge laser,” Appl. Optics 44, 7191-7195, 2005.
[4] Lee J.Y; and J. W. Hahn, H-W. Lee, “Spatiospectral transmission of a plane mirror Fabry- Perot interferometer with nonuniform finite-size diffraction beam illumination”, J.Opt.Soc.Am.A 19 #5, (2002).
[5] Johan M. Muller, “Multimirror Fabry-Perot Interferometers,” Journal of Optical Society of America. A, Vol. 2, No. 8, 1985.
[6] Marinelli, W; C. Gittins, A. Gelb, and B. Green, “A Tunable Fabry-Perot Etalon-Based Long-Wavelength Infrared Imag-ing spectroradiometer”, Applied Optics 38(16), 2594-2604 (2000).
[7] K. F. Hale, "An Optical-fiber Fatigue Crack-detection and Monitoring System", Smart Materials and Structures, 2, 156-161 (1992).
[8] Eric Udd, Fiber Optic Sensors, 1st ed. (John Wiley & Sons, Inc, New York, NY, 139-153, 325-347, 375-379(1991).
[9] K. A. Murphy, M. F. Gunther, A. M. Vengsarkar, and R.O. Claus, "Quadrature Phase-Shifted, Extrinsic Fabry-Perot Optical Fiber Sensors", Optics Letters 16(4), 273-275 (1991).
[10] K. Liu and R. M. Measures, " Signal Processing Techniques for Interferometric Fiber-Optic Strain Sensor", Journal of Intelligent Material Systems and Structure, 3, 423-461 (1992).
[11] T. Valis, D Hogg, and R. M. Measures,"Fiber-Optic Fa-bry-Perot Strain Rosettes", Smart Materials and Structures, 1, 227-232 (1992).
[12] L. Kozielski, M. Adamczyk, J. Erhart, K. Rusek, “PLZT-based light controlled piezoelectric transformer”. Ferroelectrics, 417, 161–169(2011).
[13] X. Ni, P. Rizzo, J. Yang, D. Katri, , C. Daraio, “Monitoring the hydration of cement using highly nonlinear solitary waves”. NDT E Int, 52, 76–85(. 2012).
[14] F. Akhavan, S. E. Watkins and K. Chandrashekhara, "Mea-surement and Analysis of Impact-Induced Strain using Ex-trinsic Fabry-Perot Optic Sensors", Smart Materials and Structures, 7(6), 745-751, (1998).
[15] S.E. Watkins, G. W. Sanders, F. Akhavan, and K. Chandra-shekhara, "Modal Analysis using Fiber Optic Sensors and Neural Networks for Prediction of Composite Beam Dela-mination," Smart Materials and Structures, 11(4), 489-495, (2002).
[16] H. Tsai, D. Wu, T. Chiang, H. Chen “Robust design of saw gas sensors by taguchi dynamic method”. Sensors, 9, 1394–1408(2009).
[17] R. Kshetrimayum, R.Yadava, R. Tandon.” Mass sensitivity analysis and designing of surface acoustic wave resonators for chemical sensors”. Meas. Sci. Technol. 2009, 20, doi:10.1088/0957-0233/20/5/055201.
[18] T. W. Du Bosq, A. V. Muravjov, and R. E. Peale, “High reflectivity intracavity Bragg mirrors for the far-infrared p-Ge laser,” Terahertz for Military and Security Applica-tionsII, ed.by R. J. Hwu, D. L. Woolard, Proc. SPIE 5411, 167-173,(2004).
[19] D. Hogg, D. Janzen, T. valis, and R.M. Measures, "Devel-opment of a Fiber Fabry-Perot Strain Gauge", Smart Struc-tures and Skins, 1991, Proc. SPIE, 1588, 300-307 (1991).
[20] Z. Xiao, O. Engstrom and N. Vidovic, “Diaphragm Deflec-tion of Silicon Interferometer Structures used as Pressure Sensors,” Sensors and Actuators, Vol. 58, pp. 99-107, 1997.
[21] Glenn Beheim, “Fiber-Optic Temperature Sensor Using a Thin-Film Fabry-Perot Interferometer” NASA Technical Memorandum 107459, Lewis Research Center, 1997.
[22] Youngmin Kim and D. P. Neikirk, "Micromachined Fa-bry-Perot Cavity Pressure Transducer," IEEE Photonics Technology Letters 7, Dec., pp. 1471-1473 (1995).
[23] M. Jiang and E. Gerhard, “A Simple strain Sensor Using a Thin Film as a Low-finesse Fiber-Optic Fabry-Perot Inter-ferometer”, Sensors and Actuators A, Vol. 88, pp.41-46, 2001.
[24] O. Tohyama, M. Kohasi, M. Sugihara, H. Itoh, “A fi-ber-optic pressure microsensor for biomedical applications”, Sensors and Actuators, A 66, 150 – 154, 1998.
[25] O. Tohyama, S. Maeda, and H. Itoh, “Fiber-optic tactile microsensorfor detecting the position of the tip of a fibers-cope,” IEEE J. Select.Topics Quantum Electron., vol. 5, pp. 115–118, Jan.–Feb. 1999.
[26] Roger Wolthuis et. al., “Development of Medical Pressure and Temperature Sensors Employing Optical Spectrum Modulation”. IEEE Transaction on Biomedical Engineering, vol. 38, no.10, October 1991.