AN EMPIRICAL STUDY ON THE EFFECT OF AGE, QUALIFICATION AND
UPBRINGING UPON THE PERSONALITY OF MANAGERS IN TERMS OF
PERFORMANCE INDICATOR USING MBTI–DICHOTOMY IN BPO SECTOR
AT DELHI, INDIA
Ashish Kumar Singh
Shri Jagdishprasad Jhabarmal Tibrewala University, Jhunjhunu-
Rajasthan
profaksingh@yahoo.com.au
ABSTRACT
All managers are not effective and similarly efficient but even though it is a general opinion which is rational also that a good qualification and upbringing makes a good personality. But even though the performance of managers is never good and managers suffers in their performance show off which are hampered by many reasons and so than the question arises- is it a age factor or something else. The paper hence tries to identify the relations amongst these detrimental yet important factors of association for any successful personality into analyzing what matters in the performance of managers in shaping the whole of theirs dimensions of success.
Key words: Personality, Performance, Managers, Temperament
1. Introduction
Personality is a wide term and its meanings are interpreted differently among people who study it. The term personality has been derived from the Latin
term “persona” that means to speak through. There
are many definitions on the subjects as there are authors on it but however two definitions are quite prominent where one is given by Gordon Allport [1]
and the second one by Fred Luthans[2] . According to Gordon Allport [1] personality is a dynamic organisation within the individual of those
psychological systems that determine his unique
adjustment to his environment. [2]Personality means how a person affects others and how he understands
and views himself as well as the pattern of inner and
outer measurable traits and the person situation
personality are concerned its basically of four types Biological factors, Family and Social factors, Situational factors and Other factors. Biological factors state three dimensions the heredity, brain and physical features into explaining personality. Heredity simply means transmission of the qualities from ancestors to decedents through a mechanism lying primarily in the chromosomes of the germ cells. However the importance of heredity varies from one personality to another. For example heredity is generally more important in determining a person’s temperament than his values and ideals.in case of brain there is no conclusive proof available so far that it shapes personality however the notion beauty with brains is seldom observed. Physical features are important as it is tangible and attracts others and may have a tremendous effect of ones personality and good physical features are always rated higher in defining ones personality such factors like height,
weight, colour, facial features etc. The other family
and social factors are basically the socialization process and identification process the socialization process starts when there is a first initial contact between the mother and hers new born infant and later on reinforced by the friends and social groups as such. The identification process takes the model the child likes in the family to behave like in three
aspects. Firstly the similarity in behaviour between the child and the model secondly the motives and desires to be like of the model as perceived by child as intention of his and lastly how the child takes on the attributes of the model. Socialization is the process by which an infant acquires, from the
enormously wide range of behavioral potentialities
that are open to him at birth, those behaviour
patterns that are customary and acceptable to the
family and social groups[3].The identification process occurs when a person tries to identify himself
like job rotation and special training programme. We must know that successful persons in the same occupation have, to a large extent, the same interests. Character simply means honesty which is a resistance to stealing and cheating others. Schema represents a belief, perception, frame of reference and attitude which the individual possess towards the job, management, pay, incentive systems, working conditions, fringe benefits and development programmes in the organisation. Motives being the last represent the inner drives of the individual that states behavior of an individual to accomplish the goal varies because of his inner drives.
2. Myers – Briggs Type Indicator and
MBTI – Dichotomies
The MBTI was developed by Isabel Briggs Myers and Katherine C. Briggs over a period of 20 years which tries to represent Jungs (1923) theory of psychological types which contains 126 – item questions of forced – choice questionnaire concerned with individual differences in theirs preferred manner of gathering information and taking decisions. These are classed under the following types called dichotomies which are opposites to each poles of reference and holds good in each of its class making it neither inferior nor superior as such.
The four dichotomies of the MBTI are the following
1.
Extraversion – Introversion Dichotomy (E-I)2.
Sensing – Intuition Dichotomy (S-N)3.
Thinking –Feeling Dichotomy (T-F)4.
Judging – Perceiving Dichotomy(J-P)E-I represents obtaining energies from outer world with people and things for Extroverts (E) while those of Introverts (I) tends to gain energy from concentration on the inner world of concepts and ideas.
S-N represents gathering information through observance for Sensing (S) while Intuitive (I) gather the same but through using sixth sense or hunch.
T-F represents taking decisions on logical facts and solid observations for Thinkers (T) while Feelers (F) tends to take decisions based on subjective observations.
J-P represents people preferring to live in an orderly, structured and planned fashion for Judging (J) while individuals living in flexible and spontaneous as Perceiving (P).
Purpose And Objective
Performance Indicator using MBTI–Dichotomy. So the specific objectives for study are the following:
1. To find out whether age, educational
qualification, type of upbringing has any
relationship on the performance of the
mangers.
In order to validate this objective the following hypothesis were drawn -
H1- There is a significant relationship between Qualification and Performance level of Managers
H2- There is a significant relationship between Qualification and Performance level of Senior Managers
H3- There is a significant relationship between Qualification and Performance level of Middle Managers
H4- There is a significant relationship between Qualification and Performance level of Junior Managers
H5- There is a significant relationship between Age and Performance level of Managers
H6- There is a significant relationship between Age and Performance level of Senior Managers
H7- There is a significant relationship between Age and Performance level of Middle Managers
H8- There is a significant relationship between Age and performance level of Junior Managers
H9- There is a significant relationship between Type of Upbringing and Performance level of Managers
So in order to study this objective tables are drawn for the following references to test the hypothesis.
-Table 01 Qualification and Performance level of Managers
- Table 02 Qualification and Performance level of Senior Managers
- Table 03 Qualification and Performance level of Middle Managers
-Table 04 Qualification and Performance level of Junior Managers
- Table 05 Age and Performance level of Managers
- Table 06 Age and Performance level of Senior Managers
- Table 07 Age and Performance level of Middle Managers
- Table 09 Type of Upbringing and Performance level of Managers
3. Procedure
A total of 594 mangers were studied taking three organizations all together maintaining the strict confidentiality of the data, information pertaining to the performance of managers and hence the names of organizations were kept secret. The three organizations are represented by A, B and C. out of 594 managers were 87 senior managers, 203 were middle managers and 304 were junior mangers. For the collection of data the questionnaires were used 1) MBTI personality type indicator 2) assertiveness inventory 3) socio- demographic variables- age, education and upbringing.
Scoring of MBTI Type Indicator
A special inventory was used for the study where many statements were made based on 16 personality types which was again segregated for senior, middle and junior level managers where again each managerial level was classified into high medium and low performers. The data was analyzed using SPSS.
Scoring of Assertiveness Inventory
It contained 15 statements which were to be rated on three point scale- always, sometimes never. And the rigor level assigned to them are like three pints to “always”, two to “sometimes” and one for “never”.
A scoring level was determined with the following ranges 0-19 being at low level of assertiveness , 20-34 being at medium level of assertiveness and 35-45 as high level of assertiveness.
Socio- Demographic Data
This is collected against age, education and upbringing. Received data pertaining to this were segregated accordingly into high, medium and low performers and further analyzed into if any association exists between managerial performance and selected- demographic variables- age, education and upbringing. In order to calculate the chi – squares value an interactive calculation tool for chi-square tests of goodness of fit and independence was used available online at http://quantpsy.org.
Table 00-Profile of Managers in Organizations A, B, C
Managerial Levels
Organisation A
Organisation B
Organisation C Total
Senior 39 26 22 87
Middle 125 42 36 203
Junior 116 99 89 304
Total 280 167 147 594
Table 01 Qualification and Performance Level of Managers
Qualification
Performance Levels Total
Non Graduates
Percentages 9 45 7 61
Graduate
Percentages 40 42 34 116
Post Graduate
Percentages 49 63 22 134
Professional Degree
Percentages 61 54 43 158
Diploma
Percentages 30 51 44 125
Total 189 255 150 594
Table-01A-Qualification and Performance Level of Managersbetween Non Graduates and Graduates
Qualification
Performance Levels Total
High Medium Low
Non Graduates
Percentages 9 45 7 61
Graduate
Percentages 40 42 34 116
Table-01B-Qualification and Performance Level of Managers between Post Graduates and Professional
Degree holders
Qualification
Performance Levels Total
High Medium Low
Post Graduate
Percentages 49 63 22 134
Professional Degree
Percentages 61 54 43 158
Table-01C-Qualification and Performance Level of Managerbetween Diplomas and Non Graduates
Qualification
Performance Levels Total
High Medium Low
Non Graduates
Percentages 9 45 7 61
Diploma
Percentages 30 51 44 125
TABLE 02-Qualification and Performance Level of Senior Managers
Qualification
Performance Levels
Total
High Medium Low
Non Graduates
Percentages 0 0 0 0
Graduate
Percentages 0 3 0 3
Post Graduate
Percentages 12 3 6 21
Professional Degree
Percentages 13 18 0 31
Diploma
Percentages 15 8 9 32
Total 40 32 15 87
TABLE 02A-Qualification and Performance Level of Senior Managers between Non Graduates and Graduate
Qualification
Performance Levels
Total
High Medium Low
Non Graduates
Percentages 0 0 0 0
Graduate
Percentages 0 3 0 3
TABLE 02B-Qualification and Performance Level of Senior Managers of Post Graduates and Professional
Degree holders
Qualification
Performance Levels
Total
High Medium Low
Post Graduate
Percentages 12 3 6 21
Professional Degree
Percentages 13 18 0 31
TABLE 02C-Qualification and Performance Level of Senior Managers of Non -Graduates and Diploma holders
Qualification
Performance Levels
Total
High Medium Low
Non Graduates
Percentages 0 0 0 0
Diploma
Percentages 15 8 9 32
Qualification
Performance Levels
Total
High Medium Low
Non Graduates
Percentages 14 19 10 43
Graduate
Percentages 13 16 6 35
Post Graduate
Percentages 10 13 12 35
Professional Degree
Percentages 17 24 8 49
Diploma
Percentages 18 18 5 41
Total 72 90 41 203
Table-03A- Qualification and Performance level of Middle Managers of Non Graduates and Graduates
Qualification
Performance Levels
Total
High Medium Low
Non Graduates
Percentages 14 19 10 43
Graduate
Percentages 13 16 6 35
TABLE 03B-Qualification and Performance Level of Middle Managers of Post Graduates and Professional
Degree holders
Qualification
Performance Levels
Total
High Medium Low
Post Graduate
Percentages 10 13 12 35
Professional Degree
Percentages 17 24 8 49
TABLE 03C-Qualification and Performance Level of Middle Managersof Non -Graduates and Diploma holders
Qualification
Performance Levels
Total
High Medium Low
Non Graduates
Percentages 14 19 10 43
Diploma
Percentages 18 18 5 41
Table -04 Qualification and Performance level of Junior Managers
Qualification
Performance Levels
Total
High Medium Low
Non Graduates
Percentages 13 17 15 45
Graduate
Percentages 20 28 15 63
Post Graduate
Percentages 28 12 26 66
Professional Degree
Percentages 27 16 27 70
Diploma
Percentages 12 26 22 60
Total 100 99 105 304
Table -04A-Qualification and Performance level of Junior Managers of Non Graduates and Graduates
Qualification
Performance Levels
Total
High Medium Low
Non Graduates
Percentages 13 17 15 45
Graduate
Percentages 20 28 15 63
TABLE 04B-Qualification and Performance Level of Junior Managers of Post Graduates and Professional
Degree holders
Qualification
Performance Levels
Total
High Medium Low
Post Graduate
Percentages 28 12 26 66
Professional Degree
Percentages 27 16 27 70
TABLE 04C-Qualification and Performance Level of Junior Managersof Non -Graduates and Diploma holders
Qualification
Performance Levels
Total
High Medium Low
Non Graduates
Percentages 13 17 15 45
Diploma
Percentages 12 26 22 60
Table 05 Age and Performance level of Managers
Qualification
Performance
Total
High Medium Low
25-30
Percentage 11 35 6 52
30 to 35
Percentages 33 45 21 99
35 to 40
Percentages 47 57 20 124
40 to 45
Percentages 52 51 30 133
45 to 50
Percentages 21 44 40 105
50 above
Percentages 25 23 33 81
Table 05A- Age and Performance level of Managers between the age range of 25-30 years and 30-35 year
Qualification
Performance
Total
High Medium Low
25-30
Percentage 11 35 6 52
30 to 35
Percentages 33 45 21 99
Table 05B- Age and Performance level of Managers between the age range of 35-40 years and 40-45 years
Qualification
Performance
Total
High Medium Low
35 to 40
Percentages 47 57 20 124
40 to 45
Percentages 52 51 30 133
Table 05C- Age and Performance level of Managers between the age range of 45-50 years and above 50 years
Qualification
Performance
Total
High Medium Low
45 to 50
Percentages 21 44 40 105
50 above
Percentages 25 23 33 81
Table 06 Age and Performance level of Senior Managers
Qualification
Performance
Total
High Medium Low
25-30
Percentage 0 0 0 0
30 to 35
Percentages 0 0 0 0
35 to 40
Percentages 0 0 0 0
40 to 45
Percentages 3 0 9 12
45 to 50
Percentages 26 18 3 47
50 above
Percentages 11 14 3 28
Total 40 32 15 87
Table 06A- Age and Performance level of Senior Managers between the age range of 25-30 years and 30-35
years
Qualification
Performance
Total
High Medium Low
25-30
Percentage 0 0 0 0
30 to 35
Percentages 0 0 0 0
Table 06B- Age and Performance level of Senior Managers between the age range of 35-40 years and 40-45 years
Qualification
Performance
Total
High Medium Low
35 to 40
Percentages 0 0 0 0
40 to 45
Percentages 3 0 9 12
06C- Age and Performance level of Senior Managers between the age range of 45-50 years and above 50 years
Qualification
Performance
Total
High Medium Low
45 to 50
Percentages 26 18 3 47
50 above
Percentages 11 14 3 28
Table 07 Age and Performance level of Middle Managers
Qualification
Performance
Total
High Medium Low
25-30
Percentage 4 17 4 25
30 to 35
Percentages 18 18 8 44
35 to 40
Percentages 21 20 9 50
40 to 45
Percentages 11 11 4 26
45 to 50
Percentages 10 14 6 30
50 above
Percentages 8 10 10 28
Total 72 90 41 203
Table 07A- Age and Performance level of Middle Managers between range of 45-50 years and above 50 years
Qualification
Performance
Total
High Medium Low
25-30
Percentage 4 17 4 25
30 to 35
Percentages 18 18 8 44
Table 7B- Age and Performance level of Middle Managers between the age range of 35-40 years and
40-45 years
Qualification
Performance
Total
High Medium Low
35 to 40
40 to 45
Percentages 11 11 4 26
Table 07C- Age and Performance level of Middle Managers between the age range of 45-50 years and above
50 years
Qualification
Performance
Total
High Medium Low
45 to 50
Percentages 10 14 6 30
50 above
Percentages 8 10 10 28
Table 08 Age and performance level of Junior Managers
Qualification
Performance
Total
High Medium Low
25-30 8 21 4 33
30 to 35 25 23 16 64
35 to 40 22 32 5 59
40 to 45 12 6 26 44
45 to 50 7 12 28 47
50 above 26 5 26 57
Total 100 99 105 304
Table 08A- Age and Performance level of Junior Managers between the age range of 25-30 years and 30-35 years
Qualification
Performance
Total
High Medium Low
25-30
Percentage 8 21 4 33
30 to 35
Percentages 25 23 16 64
Table 8B- Age and Performance level of Junior Managers between the age range of 35-40 years and 40-45 years
Qualification
Performance
Total
High Medium Low
35 to 40
Percentages 22 32 5 59
40 to 45
Percentages 12 6 26 44
Table 08C- Age and Performance level of Junior Managers between the age range of 45-50 years and above 50 years
Qualification
Performance
Total
High Medium Low
45 to 50 7 12 28 47
Percentages 50 above
Percentages 26 5 26 57
Table 09 Type of Upbringing and Performance level of Managers
Type of Upbringing
Performance
Total
High Medium Low
Urban 98 96 72 266
Rural 114 125 89 328
Total 212 221 161 594
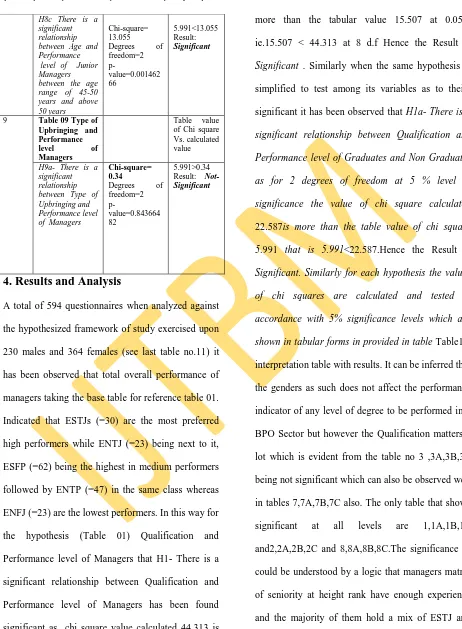
Table10: Interpretation of Results of respective Tables
TABL E No.
Category TABLE Type and Hypothesis
Corresponding Values
Interpretatio n against table value
at 5%
significant level taking p- value
1
Table-01-Qualification and
Performance
Level of
Managers
Table value of Chi square Vs. calculated value
H1- There is a significant relationship between Qualification and Performance level of Managers
Chi-square=
44. 313
Degrees of
freedom= 8 p-value= 5e-7
15.507 < 44.313 Result:
1A Table-01A-Qualification and Performance
Level of
Managers between Non Graduates and Graduates
Table value of Chi square Vs. calculated value
H1a- There is a significant relationship between Qualification and Performance level of Graduates and Non Graduates
Chi-square=
22.587 Degrees of
freedom= 2 p-value= 0.00001245 5.991<22.5 87 Result: Significant 1B Table-01B-Qualification and Performance
Level of
Managers between Post Graduates and Professional Degree holders
Table value
of Chi square Vs. calculated value
H1b- There is a significant relationship between Qualification and Performance level of Post Graduates and Professional Degree holders
Chi-square=
6.86 Degrees of freedom= 2 p-value= 0.03238694 5.991< 6.86 Result: Significant 1C Table-01C-Qualification and Performance
Level of
Managers between Diplomas and Non Graduates
Table value
of Chi square Vs. calculated value
H1c- There is a significant relationship between Qualification and Performance level of Diplomas and Non Graduates
Chi-square=
18.721 Degrees of
freedom= 2 p value=0.000086 06 5.991<18.721 Result: Significant 2
TABLE 02-Qualification
Table value of Chi square
and
Performance Level of Senior Managers
Vs. calculated value
H2- There is a significant relationship between Qualification and Performance level of Senior Managers
Chi-square= 22.863
Degrees of
freedom= 6 p-value=0.000843 69 12.592<22.86 3 Result: Significant 2A
TABLE 02A-Qualification and Performance Level of Senior Managers between Non Graduates and Graduates
Table value
of Chi square Vs. calculated value
H2a- There is a significant relationship between Qualification and Performance level of between Non Graduates and Graduates
Chi-square= 14 Degrees of
freedom=5 p-value=0.015609 42 11.070<14 Result: Significant 2B
TABLE 02B-Qualification and Performance Level of Senior Managers
of Post
Graduates and Professional Degree holders
Table value
of Chi square Vs. calculated value
H2b- There is a significant relationship between Qualification and Performance level of Senior Managers of Post Graduates and Professional Degree holders Chi-square= 15.401 Degrees of
freedom= 2 p-value=0.000452 6 5.991<15.401 Result: Significant 2C
TABLE 02C-Qualification and Performance Level of Senior Managers of Non -Graduates and Diploma holders
Table value
H2c- There is a significant relationship between Qualification and Performance level of Non -Graduates and Diploma holders
Chi-square=
21.375 Degrees of
freedom= 5 p-value=0.000687 99 11.070<21.37 5 Result: Significant 3 Table-03 Qualification and Performance level of Middle Managers
Table value of Chi square Vs. calculated value
H3- There is a significant relationship between Qualification and Performance level of Middle Managers
Chi-square=
7.558
Degrees of
freedom= 8 p-value=0.477790 64 15.507>7.558 Result: Not-Significant 3A Table-03A- Qualification and Performance level of Middle Managers
of Non
Graduates and Graduates
Table value
of Chi square Vs. calculated value
H3a- There is a significant relationship between Qualification and Performance level of Non-Graduates and Graduates
Chi-square= 0.479 Degrees of
freedom= 2 p-value=0.787021 27 5.991> 0.479 Result: Not-Significant 3B
TABLE 03B-Qualification and Performance Level of Middle Managers of Post Graduates and Professional Degree holders
Table value
of Chi square Vs. calculated value
H3b- There is a significant relationship between Qualification and Performance level of Middle Managers of Post Graduates and Professional Degree holders
Chi-square=
3.653 Degrees of
freedom= 2 p-value=0.160976 5.991>3.653 Result: Not-Significant 3C
TABLE 03C-Qualification and Performance Level of Middle Managers of Non -Graduates and Diploma holders
Table value
of Chi square Vs. calculated value
H3c- There is a significant relationship between Qualification and Performance level of Middle Managers of Non -Graduates and Diploma holders
Chi-square= 2.147 Degrees of
freedom= 2 p-value=0.341810 09 5.991>2.147 Result: Not-Significant 4
Table -04 Qualification and Performance level of Junior Managers
Table value of Chi square Vs. calculated value
H4- There is a significant relationship between Qualification and Performance level of Junior Managers
Chi-square=
20.223
Degrees of
4A
Table -04A-Qualification and Performance level of Junior Managers
of Non
Graduates and Graduates
Table value
of Chi square Vs. calculated value
H4a- There is a significant relationship between Qualification and Performance level of Junior Managers among Non-Graduates and
Graduates
Chi-square=
1.207 Degrees of
freedom=2 p-value=0.546894 15 5.991>1.207 Result: Not-Significant 4B
TABLE 04B-Qualification and Performance Level of Junior Managers of Post Graduates and Professional Degree holders
Table value
of Chi square Vs. calculated value
H4b- There is a significant relationship between Qualification and Performance level of Junior Managers of Post Graduates and Professional Degree holders
Chi-square=
0.491 Degrees of
freedom= 2 p-value=0.782313 28 5.991>1.491 Result: Not-Significant 4C
TABLE 04C-Qualification and Performance Level of Junior Managers of Non -Graduates and Diploma holders
Table value
of Chi square Vs. calculated value
H4c- There is a significant relationship between Qualification and Performance level of Junior Managers of Non -Graduates and Diploma holders
Chi-square=
1.128 Degrees of
freedom=2 p-value=0.568928 79 5.991>1.128 Result: Not-Significant 5
Table 05 Age and
Performance
level of
Managers
Table value of Chi square Vs. calculated value
H5- There is a significant relationship between Age and Performance level of Managers
Chi-square=
46.031
Degrees of
freedom=10 p-value=0.000001 42 18.307<46.03 1 Result: Significant
Table 05A- Age and
Performance
level of
Managers between the age range of 25-30 years and 30-35 years
Table value
of Chi square Vs. calculated value
5A
H5a- There is a significant relationship between Age and Performance level of Managers between the age range of25-30 years and 30-35 years
Chi-square=
6.593 Degrees of
freedom=2 p-value=0.037012 48 5.991<6.593 Result: Significant 5B
Table 05B- Age and
Performance
level of
Managers between the age range of 35-40 years and 40-45 years
Table value
H5b- There is a significant relationship between Age and Performance level of Managers between the age range of 35-40 years and 40-45 years
Chi-square=
2.273 Degrees of
freedom= 2 p-value=0.320940 35 5.991> 2.273 Result: Not-Significant 5C
Table 05C- Age and
Performance
level of
Managers between the age range of 45-50 years and above 50 years
Table value
of Chi square Vs. calculated value
H5c There is a significant relationship between Age and Performance level of Managers between the age range of 45-50 years and above 50 years
Chi-square= 4.581 Degrees of
freedom=2 p-value=0.101215 84 5.991>4.581 Result: Not-Significant
6
Table 06 Age and
Performance level of Senior Managers
Table value of Chi square Vs. calculated value H6- There is a
significant relationship between Age and Performance level of Senior Managers
Chi-square=
35.212
Degrees of
freedom=4 p-value=4.2e-7 9.488< 35.212 Result: Significant 6A
Table 06A- Age and
Performance level of Senior Managers between the age range of 25-30 years and 30-35 years
Table value
of Chi square Vs. calculated value
H6a- There is a significant relationship between Age and Performance level of Senior Managers between the age range of25-30 years and 30-35 years
Chi-square= 0 Degrees of
freedom= 1 p-value=1 3.841>0 Result: Not-Significant 6B
Table 06B- Age and
Performance level of Senior Managers between the age range of 35-40 years and 40-45 years
Table value
of Chi square Vs. calculated value
H6b- There is a significant relationship between Age and Performance level of Senior Managers between the age range of 35-40 years and 40-45 years
Chi-square= 27 Degrees of
freedom= 5 p-value=0.000057 04 11.070< 27 Result: Significant 6C
Table 06C- Age and
Performance level of Senior Managers between the age range of 45-50 years and above 50 years
Table value
of Chi square Vs. calculated value
H6c There is a significant relationship between Age and Performance level of Senior Managers between the age range of 45-50 years and above 50 years
Chi-square=
1.889 Degrees of
freedom= 2 p-value=
0.38887396
5.991> 1.889 Result: Not-Significant
7
Table 07 Age and
Performance level of Middle Managers
Table value of Chi square Vs. calculated value
H7- There is a significant relationship between Age and Performance level of Middle Managers
Chi-square=
12.477
Degrees of
freedom=10 p-value=
0.2543999
7A
Table 07A- Age and
Performance level of Middle Managers between the age range of 25-30 years and 30-35 years
Table value
of Chi square Vs. calculated value
H7a- There is a significant relationship between Age and Performance level of Middle Managers between the age range of25-30 years and 30-35 years
Chi-square=
5.453 Degrees of
freedom=2 p-value=0.654479 6 5.991> 5.453 Result: Not-Significant 7B
Table 7B- Age and
Performance level of Middle Managers between the age range of 35-40 years and 40-45 years
Table value
of Chi square Vs. calculated value
H7b- There is a significant relationship between Age and Performance level of Middle Managers between the age range of 35-40 years and 40-45 years
Chi-square=
0.091 Degrees of
freedom=2 p-value=0.955519 6 5.991>0.091 Result: Not-Significant 7C
Table 07C- Age and
Performance level of Middle Managers between the age range of 45-50 years and above 50 years
Table value
of Chi square Vs. calculated value
H7c There is a significant relationship between Age and Performance level of Middle Managers between the age range of 45-50 years and above 50 years
Chi-square=
1.822 Degrees of
freedom=2 p-value=0.402121 9 5.991> 1.822 Result: Not-Significant
8
Table 08 Age and performance level of Junior Managers
Table value of Chi square Vs. calculated value
H8- There is a significant relationship between Age and performance level of Junior Managers
Chi-square=
79.997
Degrees of
freedom=10 p-value=0 18.307< 79.997 Result: Significant 8A
Table 08A- Age and
Performance level of Junior Managers between the age range of 25-30 years and 30-35 years
Table value
of Chi square Vs. calculated value
H8a- There is a significant relationship between Age and Performance level of Junior Managers between the age range of25-30 years and 30-35 years
Chi-square= 6.84 Degrees of
freedom=2 p-value=0.032712 43 5.991<6.84 Result: Significant 8B
Table 8B- Age and
Performance level of Junior Managers between the age range of 35-40 years and 40-45 years
Table value of Chi square Vs. calculated value
Chi-square=
33.482 Degrees of
freedom= 2 p-value=5e-8 5.991<33.482 Result: Significant H8b- There is a
significant relationship between Age and Performance level of Junior Managers between the age range of 35-40 years and 40-45 years
8C
Table 08C- Age and
Performance level of Junior Managers between the age range of 45-50 years and above 50 years
Table value
H8c There is a significant relationship between Age and Performance level of Junior Managers between the age range of 45-50 years and above 50 years
Chi-square=
13.055 Degrees of
freedom=2
p-value=0.001462 66
5.991<13.055 Result: Significant
9
Table 09 Type of Upbringing and Performance
level of
Managers
Table value of Chi square Vs. calculated value H9a- There is a
significant relationship between Type of Upbringing and Performance level of Managers
Chi-square= 0.34
Degrees of
freedom=2
p-value=0.843664 82
5.991>0.34 Result: Not-Significant
4. Results and Analysis
A total of 594 questionnaires when analyzed against the hypothesized framework of study exercised upon 230 males and 364 females (see last table no.11) it has been observed that total overall performance of managers taking the base table for reference table 01. Indicated that ESTJs (=30) are the most preferred high performers while ENTJ (=23) being next to it, ESFP (=62) being the highest in medium performers followed by ENTP (=47) in the same class whereas ENFJ (=23) are the lowest performers. In this way for the hypothesis (Table 01) Qualification and Performance level of Managers that H1- There is a significant relationship between Qualification and Performance level of Managers has been found significant as chi square value calculated 44.313 is
more than the tabular value 15.507 at 0.05% ie.15.507 < 44.313 at 8 d.f Hence the Result is Significant . Similarly when the same hypothesis is simplified to test among its variables as to theirs significant it has been observed that H1a- There is a significant relationship between Qualification and
Performance level of Graduates and Non Graduates
as for 2 degrees of freedom at 5 % level of
significance the value of chi square calculated
22.587is more than the table value of chi square 5.991 that is 5.991<22.587.Hence the Result is Significant. Similarly for each hypothesis the values
of chi squares are calculated and tested in
accordance with 5% significance levels which are
homogeneity of success can be drawn in this class where the success rate of genders contributes to 87 males and 102 females .It must not be interpreted that all ESTJ and ENTJ are composite of 87 males and 102 females but it only means that those few who belong to these range should have exhibited the characteristics of extrovertedness. Similarly the managers who represent within the middle performance range exhibit ENFP and ESFP characteristics making the performance medium but not slow as they again are extroverts type and represents a total workforce of 255 out of which 90 males and 165 females. The difference between the two is wider than the most senior ones as females tend to perform better than males in their extrovertedness while handling the prerequisite portfolio. However a better training and job satisfaction can’t be excluded. The level of satisfaction that they derive out of such preference. Again it is evident that the significant relationship exhibited in table 8 suggests that the age factor dominates the performance with 97 females and 53 males where 15 females are represented with ENTP and 10 males to INTP. A simple look at the table 11 so formulated also suggests that most of the females showed high preference to “E” factor in majority as
contrast to males. This shows that females are more motivated and take on challenge well in accepted
leadership of these experienced 40 + age results the overall success of their organizations. In other ways the seniority and the age gap may be more evident in the failure of performance indicator as seniority starts from the age of 40 where the lowest rank holders are youth of 18+ in majority. So the level of significant of homogeneity is rejected in table 6 at par suggesting overall that it is rather significant in its “senior” prime table no 6 as such. Analyzing table 5
on the same pattern as analyzed for 6 shows a very narrow margin of uniformity of “seniority” of middle and lower managers suggesting that there is a sound understanding in these groups as the pattern of males to males and females to females is almost same but rather more drastic to males. So as we go up the ladder we see more people achieving the heights with the experience and qualification but not taking into age as, age is replaced with earning of qualification hence rejecting the basis of promotion on seniority
but upon the qualification and good progressive records.
Table: 11 MBTI trend among Males and Females vs. Level of Performance
MBTI Type
PERFORMANCE LEVELS
High M F Medium M F Low M F
ESTJ 30 18 12 2 0 2 0 0 0
ENTJ 23 8 15 3 0 3 2 0 2
ISTJ 15 8 7 10 3 7 11 2 9
INTJ 22 17 5 14 6 8 5 1 4
ESFP 6 2 4 62 13 49 12 4 8
ENFP 2 1 1 47 20 27 11 6 5
ISFP 6 3 3 12 8 4 3 2 1
INFP 8 6 2 10 7 3 17 10 7
ESTP 10 3 7 11 2 9 11 2 9
ENTP 2 0 2 12 5 7 19 4 15
INTP 7 2 5 10 7 3 13 4 9
ISTP 14 11 3 5 1 4 4 1 3
ESFJ 10 2 8 15 3 12 6 4 2
ENFJ 10 1 9 6 2 4 23 9 14
ISFJ 18 3 15 30 11 19 10 3 7
INFJ 6 2 4 6 2 4 3 1 2
Total 189 87 102 255 90 165 150 53 97
5. Conclusion:
After analysis and subsequent data interpretation it was discovered that in all the organizations A, B and C there was a high significant proportion of females dominating in middle level especially over males. Further if was also observed that the women tend to possess mainly in common the dichotomy pair of E, N, F, P, S, T. however in detail examination males
tend to possess I, N, S, and T as the most preferred preference. This indicates that females are better than men with “E” factor pressing them to work hard
and win over others while males tend to be dominated by “I” factor which is associated with
are better employees than males when it comes to successfully analyzing manpower performance over three successive years and on. Qualification yet adds value to the personality in terms of growth in professional front and it was most cashed by females than males in general as at the highest rank there is a dominancy of females in all organizations taken together over males. In terms of failures of employees in the performance range of “Low” it is rather shocking that females ranking is high in achievement against failures while males exhibited a low standard of performance which could be seen in the next stage of performance in “medium” stage. At this stage there is a drastic gap in between the self achievement indicator in terms of standards of performance wherein again females dominated males. So summarizing the study it can be concluded that females are appropriate to serve at highest level , enough to support in middle level and remarkable in
performance at initial level . However the study could not answer to the question as to why men were not able to do so and the possible reasons for it. Anyway the researcher was happy to note that when these findings were made known to top guns of organizations A,B,C they are now motivated to know the reasons for such lack of men in such indicative performances and the organizations have started taking following initiatives with a hope that it will solve problem –
1. Counseling sessions with males to be chaired by a male executive each week.
2. Frequent games and activities which enable males and females share more interactions.
3. shifting the mix of males and females at the workplace to sooth theirs psychological working. 4. Displaying a good performer from each gender weekly and rewarding them.
5.
Organizing Training and Developmentprogrammes for males and females in heterogeneous groups.
*** It ought to be noted that when the organizations were taken for study there was a high density of female employees in
“Executives “and this study is only restricted to executives not to all employees as such.***
References
1. Babcock, L. & S. Laschever. 2003. Women don’t ask: Negotiation and the gender divide. Princeton, N.J.: Princeton University Press
2. Barbuto, J.E., (1997). A critique of the Myers – Briggs indicator and its
3. Catalyst. 2003a. Advancing Latinas in the workplace: What managers need to know? New York: Author.
4. Catalyst. 2003b. Advancing Asian women in the workplace: Catalyst’s new guide for managers. New York: Author.
5. Hays-Thomas, R. 2004. Why now? The contemporary focus on managing diversity. In Stockdale, M.S. & F.J. Crosby, eds. The Psychology and management of workplace diversity. Malden, MA: Blackwell Publishers, Ltd. 1-30.
6. Harvey, R J (1996) Reliability and Validity, in MBTI Applications. A.L. Hammer, Editor. Consulting Psychologists Press: Palo Alto, CA. p. 5- 29.
7. Hill, A. B., (1999). Personality characteristics associated with academic
achievement among developmental college students. (Doctoral)
8. Kanter, R.M. 1977. Men and women of the corporation. New York: Basic Books.
9. Karsten, M.F. 1992. Gender issues in management.. Madison: Author. p. 23.
10. Myers, Isabel Briggs; McCaulley Mary H.; Quenk, Naomi L.; Hammer, Allen L. (1998). MBTI Manual (A guide to the development and use of the Myers Briggs type indicator). Consulting Psychologists Press; 3rd ed edition. ISBN 0-89106-130-4
11. Pettigrew, T., & Tropp, L. (2006, May).A meta-analytic test of intergroup contact theory.
12. Journal of Personality & Social Psychology, 90(5), 751-783