Original article
Clinical and laboratory profile of acute leukemia
with special reference to flow cytometry
Ratnamala Choudhury, Sreevalli A., Chaitanya H. Balakrishnan, Cecil R. Ross Department of Medicine, St. John’s Medical College, Bangalore, Karnataka, India Abstract
Background: Acute leukemias are a result of a sequence of somatic mutations in a multipotent primitive hematopoietic cell. It forms a major proportion of haematopoietic neoplasms that are diagnosed worldwide. Acute Myeloid Leukemia (AML) in adults accounts for 80-90% of cases of acute leukemias. Acute Lymphoid Leukemia (ALL), though common in childhood comprises 12% of all leukemias. Incidence rises again in the sixth decade but this age peak is absent in developing countries. Subtypes of AML and ALL differ in response to therapy, clinical course and prognosis. Leukemias have varied presentation. There is limited comprehensive assessment of clinical and laboratory profile of acute leukemias in Indian population. The diagnosis of leukemia only by morphological examination of peripheral blood films, is grossly inadequate. Bone marrow study and advanced diagnostic procedures like cytogenetic analysis, immunophenotyping, cytochemical staining and molecular genetics are yet to be fully incorporated in the workup of leukemias. The aim was to study the clinical and laboratory parameters of acute leukemias with special reference to flow cytometry
Methods: The study was conducted in St. John’s Medical College Hospital from October 2014 to March 2016. Consecutive patients diagnosed with acute leukemias were included in the study. Details were collected as per proforma regarding demographic factors, symptoms, signs, laboratory parameters. The morphological typing and sub-typing of leukemia was based on peripheral smear examination, bone marrow studies (aspiration and biopsy) employing the FAB criteria, flowcytometry and cytogenetics.
Results: In our study of 100 patients with acute leukemia, 70 had AML, 27 had ALL and 3 remained as unclassified acute leukemia. Male preponderance is seen in the patients studied, with 55% males and 45% females with male:female ratio of 1.2:1. Fever is the most common symptom. Pallor is the most common sign. Anemia is the most common haematological abnormality 98% (n=98) followed by thrombocytopenia in 93% (n=93). More than 30% blasts in peripheral smear is seen more commonly in ALL than AML. Coagulopathy, DCT positivity, spontaneous tumor lysis syndrome, deranged renal and liver parameters are more common in ALL than AML. Though 22% remained unclassified by peripheral smear, 13% could be classified by bone marrow study and 6% by flow cytometry. Thus only 3% remained unclassified after bone marrow and flow cytometry analysis of the same.
Conclusion: Diagnosis of leukemia is not only by morphological examination of peripheral blood films alone, but also requires bone marrow study, advanced diagnostic procedures like flow cytometry and cytogenetic analysis.
Key words: flow cytometry; leukemia coagulopathy
Corresponding author
Dr. Chaitanya H. Balakrishnan
Department of Medicine, St. John’s Medical College, Bangalore, Karnataka, India E-mail: chait.harita@gmail.com
Introduction
Acute leukemias are a result of a sequence of somatic mutations in a multipotent primitive hematopoietic
cell[1].It forms a major proportion of haematopoietic
neoplasms that are diagnosed worldwide.
Acute Myeloid Leukemia (AML) in adults accounts for
80-90% of cases of acute leukemias. Acute Lymphoid
Leukemia (ALL), though common in childhood
comprises 12% of all leukemias[2]. Incidence rises
again in the sixth decade but this age peak is absent in developing countries.
limited comprehensive assessment of clinical and laboratory profile of acute leukemia in Indian population. Because of population growth, aging and urbanization, changing dietary habits, better control of infections, and increasing tobacco consumption, developing countries like India are anticipated to bear greater cancer burden, including lympho-hemopoietic malignancies.
In many hospitals in developing countries, the diagnosis of leukemia is by morphological examination of peripheral blood films. This is grossly inadequate. Bone marrow study and advanced diagnostic procedures like cytogenetic analysis, immunophenotyping, cytochemical staining and molecular genetics are yet to be fully incorporated in the workup of leukaemias.
Subtypes of AML and ALL differ in response to therapy,
clinical course and prognosis[3].
According to GLOBOCAN 2008, the worldwide estimates of cancer incidence and mortality produced by the International Agency for Research on Cancer (IARC) for developing countries in 2008, revealed 116,500 and 93,400 new cases of leukemia in males and females respectively. Of these, the estimated deaths were 95,100 and 75,100 in males and females respectively[4].
The predisposing factors are:
a. Hereditary as seen in leukemias associated with congenital disorders like Down’s syndrome, Fanconi’s anemia, Bloom’s syndrome, Kostman syndrome, Diamond-Blackfan syndrome, Wiskott-Aldrich syndrome.
b. Acquired factors like ionizing radiation due to nuclear fall-out, therapeutic irradiation for other
neoplasms, chemical agents like benzene[5],
chemotherapeutics like alkylating agents,
topoisomerase II inhibitors[6], tobacco smoke[7],
viral infections like human lymphotropic virus type I, Epstein-Barr virus infections, acquired conditions like myeloproliferative syndrome, aplastic anemia
have been implicated[8].
Different mechanisms of leukaemogenesis:
1. Activation of a proto-oncogene to an oncogene when it is translocated to a transcriptionally active site: Translocation may cause a proto-oncogene to be brought closer to a transcriptionally active gene; this can cause activation of proto-oncogene and neoplastic transformation.
Ex: Translocation (8; 14) places the
proto-oncogene, C-MYC located at Chromosome 8 close to transcriptionally active immunoglobulin locus on Chromosome 14. This causes activation and increased transcription of C-MYC and abnormal
cellular proliferation in pre B-ALL[8].
2. Formation of a chimeric transcription factor: This is the major mechanism in the pathogenesis of AML.
Ex: t (15;17) in acute promyelocytic leukemia (APML) that leads to fusion of genes for Retinoic acid receptor alpha (RARA) on chromosome 15 with the promyelocytic leukemia gene on Chromosome
17. In APML, PML-RARα fusion protein represses
retinoic acid inducible genes, which prevent
appropriate maturation of promyelocytes.9
Administration of all-trans-retinoic acid normalizes
RARα signaling by releasing the transcription
repressors and allowing normal maturation and
differentiation of promyelocytes[8].
3. Formation of a fusion protein with enhanced tyrosine kinase activity: In few precursor B-ALL, t (9; 22) causes formation of a fusion protein BCR/ ABL that has enhanced tyrosine kinase activity. These abnormalities are insufficient by themselves to induce leukemia. Additional genetic alterations are required to cause leukemic transformation. Examples of second mutations are-
a) Activation of FLT3, a receptor tyrosine kinase in both ALL and AML which turns on signal transduction pathways and contributes to neoplastic transformation.
b) Inactivation of tumor suppressor gene pathway controlled by RB1 or p53 occurs in a proportion of cases of ALL[8].
Foetal origin of ALL: Some ALL may arise in utero. Leukemia specific fusion gene sequences (MLL/ AF4, TEL/AML1) have been identified in blood spots from neonates who developed ALL after a latent period and their leukemic cells contained
the identical fusion gene sequences[9]. Another
mechanism is thought to be in-utero exposure to X rays[10].
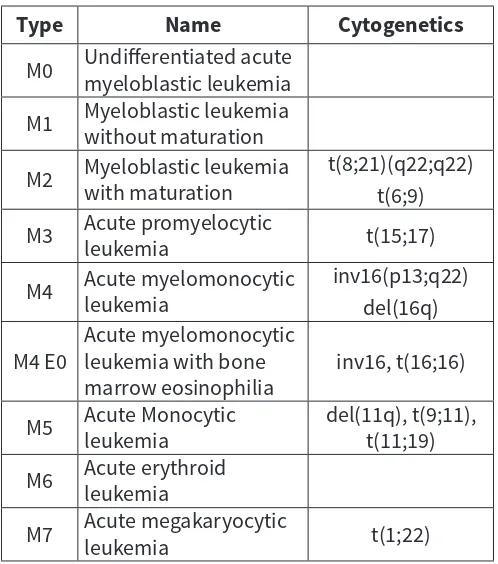
Table 1: FAB Classification of Acute Myeloid Leukemia
Type Name Cytogenetics
M0 Undifferentiated acute myeloblastic leukemia
M1 Myeloblastic leukemia without maturation
M2 Myeloblastic leukemia with maturation t(8;21)(q22;q22)
t(6;9)
M3 Acute promyelocytic leukemia t(15;17)
M4 Acute myelomonocytic leukemia inv16(p13;q22)
del(16q)
M4 E0 Acute myelomonocytic leukemia with bone
marrow eosinophilia inv16, t(16;16)
M5 Acute Monocytic leukemia del(11q), t(9;11), t(11;19)
M6 Acute erythroid leukemia
M7 Acute megakaryocytic leukemia t(1;22)
Table 2: FAB Classification of Acute Lymphoblastic Leukemia
Immunologic
Subtype Cases% of SubtypeFAB AbnormalitiesCytogenctic
Pre-B ALL 75 L1, L2 t(9;22), t(4;11), t(1;19)
T cell ALL 20 L1, L2 14q11 or 7q34
B cell ALL 5 L3 t(8;14), t(8;22), t(2;8)
Need for the study: Due to the rising incidence of acute leukemias in a developing country like India, the clinical profile of these diseases must be identified in order to facilitate early recognition, timely diagnosis and appropriate treatment. The various types and subtypes of acute leukemias are identified using advanced diagnostic techniques such as flow cytometry which are vital in prognostication and choosing treatment modalities
Hence, the aim was to study the clinical and laboratory parameters of acute leukemia with special reference to flow cytometry studies.
Materials and Methods
This was a cross sectional study including all adult patients diagnosed as acute leukemia. Patients with myelodysplastic syndromes transformed to
leukemias; Patients diagnosed as acute leukemias following chemotherapy for other malignancies; and Chronic Myeloid Leukemia with blast crisis were cluded from the study.
Consecutive patients diagnosed with acute leukemias admitted from October 2014 were included in the study after obtaining informed consent. Data was collected over a period of 18 months from October 2014 to March 2016. A total of 100 patients were included in the study.
Details were collected as per proforma regarding demographic factors, symptoms, signs, laboratory parameters. The morphological typing and sub-typing of leukemia was based on peripheral smear examination, bone marrow studies (aspiration and biopsy) employing the FAB criteria, flow cytometry and cytogenetics.
Cytochemical stains
The cytochemical stain myeloperoxidase is most sensitive and specific for granulocytes, therefore it is useful to differentiate AML from ALL. Periodic Acid Schiff stain shows typical block- like or coarse granular positivity of lymphoblasts in ALL and sometimes in AML (Monocytic, Erythroleukemia, Megakaryoblastic). The reaction and non-reaction with sudan black blue stain are both practically significant, as the former refers characteristically to AML and the latter is highly supportive of the diagnosis of ALL.
Flow cytometry
Cytogenetics
Acute leukemia is a complex disease with considerable phenotypic and genotypic heterogeneity reflecting the complexities of myeloid cell differentiation. There are more than 100 recurring cytogenetic abnormalities and numerous point mutations observed in AML and ALL. Cytogenetic translocations result in the formation of fusion proteins, which are a common pathway in leukemogenesis. Cytogenetic evaluation of cells from leukemia patients has resulted in better understanding of the specificity of some of the abnormalities observed in tumor cells. There is a close association of specific chromosomal abnormality with particular types of human leukemia. In addition they are the best prognostic indicators.
Data analysis
Data was analysed using SPSS 24 version. All continuous variables have been expressed as mean ± SD (when normally distributed) or median ± IQR (when not normally distributed). All categorical variables have been expressed as frequency and percentage. Categorical variables were analysed by Chi square test or Fischer’s exact test. Continuous variables were analysed by independent t test (when normally distributed) and Mann Whitney U test (when not normally distributed). One- way ANOVA was used for 3 or more independent variables and Kruskall Wallis was used for non parametric data. p value of <0.05 was considered to be significant.
Definitions:
As per WHO anemia is defined as hemoglobin level <13g/dl for males and <12g/dl for females (Table 3).
Table 3:WHO Grading of Anemia[11,12]
Grading
Haemoglobin level (g/dl)
Mild
11-normal
Moderate
8-10.9
Severe
<8
Leucocytosis was grouped into 11,000-50,000 cells/cu mm, 50,000-1,00,000 cells/cu mm, and >1,00,000 cells/ cu mm categories.
According to Common Terminology Criteria for Adverse Events v3.0 (CTCAE), thrombocytopenia was classified as (Table 4):
Table 4: CTCAE Grading Of Thrombocytopenia [13,14]
Grades
Platelet count (cells/cu mm)
Grade1
75,000-1,50,000
Grade 2
50,000-75,000
Grade 3
25,000-50,000
Grade 4
<25,000
Spontaneous tumor lysis is tumor lysis syndrome in the absence of cytotoxic therapy. Laboratory tumor lysis syndrome (LTLS) as per Cairo Bishop classification
must contain 2 or more of the following criteria[15,16]:
• Uric acid ≥8.0 mg/dL or 25% increase from baseline
• Potassium ≥6.0 mmol/L or 25% increase from
baseline
• Phosphorus ≥4.5 mg/dL or 25% increase from
baseline
• Calcium ≤7.0 mg/dL or 25% decrease from baseline
Results
100 patients of acute leukemia were studied in detail and evaluated for clinical and laboratory features (Figure 1).
ALL
27%
AML
70%
Uncla
ssied
3%
ALL AML
Unclassied acute leukemia
Figure 1: Types of leukemias
The mean age of study population was 41 years (SD 17.26), with minimum age of 18 years and maximum age being 83 years. Though the acute leukemias was distributed throughout all age groups, the peak age was 41-50 years(21%) while minimum belonged to 51-60 years (12%).
There was male preponderance in the patients studied, with 55% males and 45% females. Male: Female ratio is 1.2:1. Fever was the most common symptom seen in 71%, followed by fatigue in 44% (Figure 2).
by splenomegaly in 30% and lymphadenopathy in 28% (Figure 3).
Anemia was the most common haematological abnormality 98% (n=98) followed by thrombocytopenia in 93% (n=93) (Figure 4).
Based on the WHO classification of anemia, 66% of the patients had severe anemia, 29% had moderate, 3% had mild and 2% had no anemia.
49% of the patients had leukocytosis at presentation, 32% had leukopenia while 19% presented with a normal total count.
Minimum total count was 280 and maximum was 490,480 with a median of 10,365 with an IQR of 30,280. 93% of the patients had thrombocytopenia with median platelet count was 31,500 with an IQR of 64,000. Minimum platelet count was 4000 and maximum was 2,46,000
Out of 100 patients, 35 were diagnosed to have AML, 5 with ALL, 22 remained as unclassified acute leukemia by peripheral smear. The other 38 patients had
peripheral smear reported as NCNC, pancytopenia, macrocytic, leucoerythroblastic, and both macrocytic and leucoerythroblastic blood picture.
48% had blasts more than 30% in peripheral smear. It was more common in ALL than AML which was statistically significant with p=0.036 by chi square test. Peripheral smear of ALL patients showed a median blast percentage of 48% with an IQR of 56 while, peripheral smear of AML patients showed a median blast percentage of 16.5% with an IQR of 61 with p=0.135 by chi square test.
Coagulopathy was more commonly seen in females(95.6%) than males(92.7%) with p value of 0.688 by chi square test. 6% had features of coagulopathy which was more common in ALL than AML with p=0.669 by chi square test.
Direct Coomb’s Test (DCT) was positive in 26 patients. Among them 16 were ALL and 10 were AML. Thus, being more common in ALL than AML, with a statistically significant p value of 0.001 by chi square test.
FIGURE 2: SYMPTOMS 0%
10% 20% 30% 40% 50% 60% 70%
80% 71%
44%
24%
11% 11% 8%
6% 5%
FIGURE 3 : SIGNS
0% 10% 20% 30% 40% 50% 60% 70% 80%
30% 28%
20%
12% 8%
1% 1%
79%
0% 50% 100%
FIGURE 4 : HAEMATOLOGICAL ABNORMALITY
98% 95%
49%
32%
19%
4
14
9
34
1 5
6
[VALUE]
5
3
0 5 10 15 20 25 30 35 40
Tumor lysis was preset in 80% of the patients. Tumor lysis was more common in ALL (84.3%) than AML (70.4%) though the p value was not statistically significant (p=0.122) by chi square test.
Blood urea was high in 19% of patients. It was more common in ALL(37%) than AML(11.4%) which was statistically significant(p=0.004) by chi square test. 16% of study group had abnormal creatinine which was more common in ALL(22.2%) than AML(11.4%) which was statistically significant(p=0.02) by chi square test.
By bone marrow, 67 patients were diagnosed to have AML, 24 as ALL and 9 were unclassified.
Flow cytometry was done in 93% of the patients by which 27 had ALL, 63 had AML, 3 remained as unclassified. Among the remaining 7% of study population in whom flow cytometry was not done, bone marrow study of 6 patients was consistent with AML M3. 1 patient of AML did not consent for flow cytometry, hence it was not done (Figure 5, Table 5). Cytogenetics was done in 20% only, due to financial constraints. Cytogenetics was done in all 11 APML patients, among which 9 were PML RAR positive, 2 were negative. Among the others, 1 was AML M4 inv16 positive.1 case of AML with aberrant CD10 was t (8,21) (15,17), inv16, FLT3, NMP1 mutation negative. 5 cases of AML,1 AML M4,1 AML M6 were inv16, CBFB MYH11, FLT3-ITD mutation negative.
Finally, with the aid of peripheral smear, bone marrow and flow cytometry, 70 were diagnosed to have AML, 27 ALL, and 3 remained unclassified.
Discussion
The mean age of patients in our study was 41 years (SD 17.26) which is similar to Makkar et al who noted it to be 46.8 years[17].
Though acute leukemia has been observed in all age groups, the peak decade is 41-50 years (21%) in our study while minimum number of patients was
in 6th decade (51-60 years). Study done by Kusum
et al demonstrated the peak decade to be 51-60
years (18.4%)[18]. For most of the hematological
malignancies, lower age standardized incidence rates
have been observed as compared to the West[19].
Of the 100 patients in our study, 55% were males and 45% were females which was similar to studies
by Nwaandi et al[20] and Shahab et al[21]. Male
preponderance in acute leukemias can be attributed to exposure to environmental and occupational carcinogens. According to a study by Bhutani et al, average age standardized (world population) incidence rate of lymphoid malignancies in Bangalore was 1.2 in males and 0.8 in females, that of myeloid malignancies was 1.8 in males and 1.7 in females. In most of the studies including ours, fever is the most common symptom. Fever (71%) is followed by fatigue (44%), bleeding (24%), weight loss (11%), abdomen pain (11%), bone pain (8%), jaundice (6%), swelling in the neck and axilla (5%) and gum hypertrophy (1%). Nwannadi et al showed that fatigue (82.2%) was the most common symptom, followed by fever (78.5%), weight loss (54.6%), lymph node enlargement (53.4%),
bone pain (31.9%), and bleeding (10.4%)[20].
Fever was seen in 77% and bleeding in 23% in a study
by Shahab et al, which was similar to our study[21].
Table 5: Comparison of bone marrow versus flow cytometry findings
ALL AML AML M3 AML M4 AML M5 AML M6 acute leukemia TOTALUnclassified
Not done 0 1 6 0 0 0 0 7
ALL 4 0 0 0 0 0 0 4
B ALL 13 0 0 0 0 0 1 14
T ALL 7 0 0 0 0 0 2 9
AML 0 32 0 0 0 0 2 34
AML M0 0 0 0 0 0 0 1 1
AML M3 0 1 4 0 0 0 0 5
AML M4 0 3 0 3 0 0 0 6
AML M5 0 5 0 0 7 0 0 12
AML M6 0 1 0 0 0 4 0 5
Unclassified Acute leukemia 0 0 0 0 0 0 3 3
Bleeding has been observed in 24%, with gastrointestinal bleeding being most common, in the form of malaena and haematochezia in our study. Ghosh et al also observed bleeding in 21.9% of patients similar to our study, however both Ghosh et al and Rathee et al showed mucocutaneus bleeding to
be the most common[22,23].
Pallor is the most common sign similar to previous studies. It was followed by splenomegaly (30%), lymphadenopathy (28%), hepatomegaly (20%), icterus (12%), edema (8%), cyanosis (1%) and clubbing (1%). Nwannadi et al showed that pallor was the most common physical sign (71.2%), followed by
splenomegaly (66.3%) and hepatomegaly (47.8%)[20].
In our study hepatomegaly and splenomegaly were seen in 20% and 30% respectively. In studies conducted
by Shome et al[24], hepatomegaly was seen in 73% and
splenomegaly in 52% while Mathur et al[25], noted it to
be in 76% and 73% respectively. Sharma et al[26],found
that 7.59% presented with hepatomegaly and 39.24% patients presented with splenomegaly.
Incidence of lymphadenopathy in our study is 28%
which correlates with the studies of Shome et al[24],
and Mathur et al[25] but, in a study by Advani et al[27],
lymphadenopathy was seen in only 4%.
Organomegaly was seen more commonly in ALL than AML in our study which was similar to a study
by Shimizu et al[28]. Shahab F et al[21], in his study also
showed that enlargement of liver, spleen and lymph nodes were more commonly associated with ALL compared to AML.
In our study anemia is the most common haematological abnormality 98% (n=98) followed by thrombocytopenia 93% (n=93) which has also been
illustrated by Rathee et al[23].Study done by Preeti
et al[29], showed thrombocytopenia to be the most
common haematological abnormality, followed by anemia and leukocytosis. In a study by Manisha B et
al[30], anemia was the most common (50%), followed
by leukocytosis (60%) and thrombocytopenia (75%).
Study by Burn CP et al[31], showed that 50% had
leukopenia, 25% had normal leukocyte count and 25% had leukocytosis, while in our study 32% had leukopenia, 19% had normal leucocyte count and 49% had leukocytosis.
Sharma et al[32], showed that prothrombin time was
prolonged in 62 acute leukemia patients (39.24%)
which is similar to our study (35%). Dixit et al[33],
showed that coagulation abnormalities were more common in ALL than AML which has been observed in
our study also. Dixit et al found that 64.2% of ALL and 35.8% of AML had coagulation abnormalities.
Direct Coomb’s test is positive more commonly in ALL (59.3%) than AML (14.3%). Autoimmune hemolytic anemia (AIHA) is well known to be associated with lymphoproliferative disorders. Anecdotal reports reveal the possibility of positive DAT in cases of
acute leukemia as seen by Solal et al[34], and Gurlek
et al[35]. Autoantibody against erythrocytes has
occasionally been observed in patients with de novo acute myelocytic leukemia (AML) as demonstrated by Tamura et al[36].
16% patients had deranged renal function tests. It has been observed more commonly in ALL (22.2%) than AML(11.4%). Barcos et al, in an autopsy study of 1200 acute leukemia cases, showed that the prevalence of
kidney infiltration was 54% in ALL, and 33% in AML[37].
Lanore et al[38], showed that 43% of patients with
hematologic malignancies had AKI. In a study done by
Medonca et al[39],patients with lymphoma or leukemia
had the greatest risk for AKI (odds ratio 2.23) relative to other factors, including infection, cirrhosis, and cardiovascular disease.
Tumor lysis syndrome is seen in 80% of our study population. Amita et al showed that hyperuricemia, hypocalcemia, hyperkalemia, and hyperphosphatemia
were more common in ALL, similar to our study[40]. In
a study by Coiffier et al incidence of life-threatening complications from tumour lysis syndrome was as high as 13% in patients with hematologic malignancies
than other malignancies[41].
Median peripheral smear blast percentage in our study is 48% in ALL and 16% in AML. In bone marrow it is 78% in ALL and 55% in AML. In a study by Rathee
et al[23], median blast percentage was 45% in AML and
38% in ALL. Ghosh et al[22], demonstrated mean values
and range for peripheral blood blasts in AML as 41.4% (5-77%) and bone marrow blasts as 57.6% (34-96%).
Preethi et al[29], noted a mean blast percentage of 62%
in AML correlating with the study conducted by Mathur et al[26].
66.7% of ALL and 42.9% of AML in our study show peripheral blood blast >30%. It was recommended by Cheson et al that the diagnosis of AML can be made when the percentage of blasts in peripheral blood samples is 30% or more, even if the blast count in the BM is less than 30%[42,43].
and were diagnosed to have acute leukemia by bone marrow study and flowcytometry. Rabizadeh et al in his study diagnosed 75% (72 of 96) to have acute leukemia by peripheral smear while in our study it is
62%[44]. In a study by Rathee et al on peripheral smears
of acute leukemia patients, 33.8% were affected with
AML, and 17.2% with ALL[23].
Bone marrow was done in all patients, after which, 67% were confirmed to have AML, 24% ALL and 9 remained unclassified. It was almost similar to a study done by Kusum et al where 25.4% had ALL while 37.7% had
AML[18]. Pradhan et al in his study noted that 35.95%
were ALL and 21.9% were AML, thus ALL being more
common than AML[45].
Among 9 patients who still remained as unclassified acute leukemia after bone marrow biopsy, could be grouped into either AML or ALL by flow cytometry. Andoljsek et al, showed that immunophenotyping is of great use to distinguish between AML and lymphoid leukemia, as well as when defining hybrid and biphenotypic leukemia where leukemic cells are atypical[46].
Sazawal et al showed that CD13, 33 were the most useful markers in diagnosis of AML similar to our study. CD14 and CD36 were most often seen in monocytic(38%)
and myelomonocytic (44%) leukemias[47].
Lymphoid antigen expression was seen in 15% of
cases in a study done by Ghosh et al[22] and the highest
positivity was seen in case of CD7 at 11%. However in our study it is seen in 4% and CD10 is the most common. Lymphoid antigen positivity has been reported between 16-22% and CD7 appears to be the most commonly expressed marker (28.4%) according
to Launder et al, Bradstock et al, and Ball et al[48-50].
Cytogenetics was done in 20% only, due to financial constraints. But all patients who had acute promyelocytic leukemia(11%) had cytogenetics done
for RARA- t[15,17] out of which 9 were PML RARA positive,
2 were negative. 1 patient was AML M4 inv16 positive and remaining 8 patients had cytogenetics reported as
negative. Zheng et al noted that t (8; 21), t[15,17], inv[16]
were exclusively found in M2, M3, M4 respectively[51].
With the aid of peripheral smear, bone marrow and flowcytometry, in our study AML is seen in 70%, ALL is seen in 27%, and 3 patients remained as unclassified acute leukemia.
Shahab F et al[21], demonstrated that among 92
patients who had acute leukemias, ALL constituted 46%, AML 38% and undifferentiated acute leukemia 16%.
Among patients with AML, M5 subtype is the most
common in our study, while Ghosh et al[22], and Advani
et al[27], observed it to be AML M2 with 37% and 35%
respectively. Shome et al[24], also found that AML M2
was the most common followed by M4. Sudha et al[52],
showed AML M3 (57%) was the most common, and Shahab et al found AML-M4 was the most common
sub-type. Preeti et al[29], found that AML M1 was seen
in 10 (20%), M2 in 22 (44%), M3 in 3(6%), M4 in 11 (22%), AML M5 in 4 (8%) patients. No patients of M0, M6 and M7 subtypes were seen. In our study AML M0 was seen in 1%, M3 in 11%, M4 in 6%, M5 in 12%, M6 in 5%. No patients of AML M2 and M7 were seen. 35% were unclassified AML.
In our study, among patients who had ALL, 9% had T cell ALL, 14% had B cell ALL, 4% were unclassified ALL.
Shahab et al[21], showed that T cell ALL and pre B cell
ALL was more common.
In our study initially by peripheral smear though 22% remained unclassified, among them, 13% could be classified by bone marrow and 6% by flow cytometry. Thus only 3% remained unclassified after bone marrow and flow cytometry analysis of the same. Thus peripheral smear alone may miss the diagnosis of acute leukemia. Both bone marrow study and flow cytometry not only help to classify acute leukemias but also subtype both myeloid and lymphoid leukemias, which are essential for prognosis and treatment.
References
1. Marshall A. Lichtman, Thomas J. Kipps et al. Part X. Neoplastic Myeloid Diseases. Chapter 89: Acute Myelogenous Leukemia. In: Williams Hematology. Eighth Edition. New York: The McGraw-Hill Companies; 2010.
2. Greer J, Baer M, Kinney M. Acute Myeloid Leukemia in Adults. Chapter 79. In: Wintrobe’s Clinical Hematology. 12th edition. New York: Williams and Wilkins; 2009. p. 1844 -46.
3. Idris M, Shah SH, Fareed J, Gul N. An experience with sixty cases of haematological malignancies: a clinico haematological correlation. J Ayub Med Coll JAMC. 2004;16(4):51–4.
4. Ferlay J1, Shin HR, Bray F, Forman D, Mathers C, Parkin DM. Estimates of worldwide burden of cancer in 2008: GLOBOCAN 2008. International Journal of Cancer 2010;127(12): 2893-917.
5. Snyder R. Benzene and leukemia. Crit Rev Toxicol 2002; 32(3):155-210. 6. Thirman MJ, Larson RA. Therapy related myeloid leukemia.
Haematology/ Oncology Clinics 1996;10(2);293-320.
7. Brownson RC, Novotny TE, Perry MC. Cigarette smoking and adult leukemia: a Meta-analysis. Archives of Internal Medicine 1993;153: 469. 8. Kawthalkar SM. Acute leukemias. In: Essentials of Haematology. 1st
edition. New Delhi: Jaypee brothers medical publishers; 2006. p. 224. 9. Grimwade D, Enver T. Acute prolymphocytic leukemia; where does it
stem from? Leukemia 2004;18: 375.
10. Doll R, Walaford R. Risk of childhood cancer from fetal irradiation. British Journal of Radiology 1997;70:130.
12. Preventing and controlling anaemia through primary health care: a guide for health administrators and programme managers. Geneva: World Health Organization; 1989.
13. Cancer Therapy Evaluation Program. Common Terminology Criteria for Adverse Events, Version 3.0, DCTD, NCI, NIH, DHHS March 31, 2003. Available at: http://ctep.cancer.gov. Published date: August 9, 2006. 14. David et al. Overview of Platelet Disorders [Internet]. Merck Manuals
Professional Edition. [cited 2016 Oct 11]. Available from: http:// www.merckmanuals.com/ professional/hematology-and-oncology/ thrombocytopenia-and-platelet-dysfunction/overview-of-platelet-disorders
15. Hande KR, Garrow GC. Acute tumor lysis syndrome in patients with high-grade non-Hodgkin’s lymphoma. Am J Med. 1993;94:133-139
16. Cairo MS, Bishop M. Tumour lysis syndrome: new therapeutic strategies and classification. Br J Haematol 2004;127:3-11.
17. Vikas Makkar, Sandeep Puri, Sahil Mehta, Amit Bery, JS Sandhu, JS Sekhon. Analyzing renal involvement in 100 cases of hematological malignancy. Int J Med Sci Public Health. 2015; 4(4): 486-491.
18. Kusum A, Negi G, Gaur DS, Kishore S, Meena H, Sharma A, Verma SK. Hematological malignancies diagnosed by bone marrow examination in a tertiary hospital at Uttarakhand, India. Indian J Hematol Blood Transfus. 2008 Mar; 24(1): 7-11.
19. Bhutani M, Vora A, Kumar L, Kochupilla V. Lymphopoietic Malignancies in India. Medical Oncology 2002;19:141-150.
20. Nwannadi, O Alao, G Bazuaye, M Nwagu, M Borke. Clinical and Laboratory Characteristics of Patients with Leukaemia in South-Nigeria. The Internet Journal of Oncology. 2009; 7(2).
21. Shahab et al. Clinical presentation of acute leukemias. Journal of the College of Physicians and Surgeons Pakistan 2014;24 (7): 472-476 22. Ghosh S, Shinde SC, Kumaran GS, Sapre RS, Dhond SR, Badrinath Y,
et al. Haematologic and immunophenotypic profile of acute myeloid leukemia: an experience of Tata Memorial Hospital. Indian J Cancer 2003;40(2):71-6.
23. Radha Rathee, Minakshi Vashist, Ashok Kumar et al. Incidence of acute and chronic forms of leukemia in Haryana. International Journal of Pharmacy and Pharmaceutical Sciences 2014; 6(2):323-25.
24. Shome DK, et al. The leukemias at presentation: Clinical, Demographic and cytologic variables. Indian J Cancer. 1985:194–209.
25. Sharma et al. Abnormal hepatic function and splenomegaly on the newly diagnosed acute leukemia patients. JNMA J Nepal Med Assoc. 2007;46(168):165-9.
26. Mathur et al. Leukemic Pattern in Delhi – A Ten year study of 490 cases. Indian J Cancer. 1982; 19: 81–86
27. Advani SH, Jussawala DJ, Nagaraj Rao D, Gangadharan P and Shetty PA. A study of 1226 leukemia cases – Epidemiologic and end result analysis. Indian J of Cancer 1979; 16: 8–17
28. Shimizu Y. Liver in systemic disease. World Journal of Gastroenterology 2008;14: 4111–19.
29. Preethi CR. Clinico-hematological study of acute myeloid leukemias. J Clin Diagn Res. 2014;8(4):14-7
30. Manisha B, Vinod K, Sameer B. Childhood Acute lymphoblastic Leukemia: Indian experience. Indian Journal of Medical and Pediatric Oncology. 2004;25:12-18
31. Burns CP, Armitage JO, Frey AL, et al. Analysis of presenting features of adult leukemia. Cancer 1981;47; 2460.
32. Kaushal et al. A study of chromosomal morphology in leukemias.” Journal of Anatomy society of India 2001; 50(2):112-118.
33. Dixit et al. Disseminated intravascular coagulation in acute leukemia at presentation and during induction therapy. Journal of International Academy of Clinical and applied thrombosis/hemostasis2007;13(3):292-8 34. Solal et al. Positive Coombs test in acute leukemia. Br J Haematol
1984;57:563-9
35. Gurlek et al. Direct Antiglobulin Test Positivity in Children with Acute Lymphoblastic Leukemia at Diagnosis. Pediatric Hematology and Oncology 2015; 32(7):490-494
36. Tamura H, Ogata K, Yokose N, et al. Autoimmune hemolytic anemia in patients with de novo acute myelocytic leukemia Ann Hematol 1996;72:45–47.
37. Barcos M, Lane W, Gomez GA, et al. An autopsy study of 1206 acute and chronic leukemias (1958 to 1982). Cancer. 1987;60(4):827-837.
38. Lanore JJ, Brunet F, Pochard F, et al. Hemodialysis for acute renal failure in patients with hematologic malignancies. Crit Care Med.1991;19(3):346-351.
39. de Mendonca A, Vincent JL, Suter PM, et al. Acute renal failure in the ICU: risk factors and outcome evaluated by the SOFA score. Intensive Care Med. 2000;26(7):915-921.
40. Amita T, Timothy C, Simon B. Hypercalcemia in acute lymphoblastic leukemia: an overview. J Pediatr Hematol Oncol. 2009;31(6):424–427 41. Coiffier B, Altman A, Pui CH, et al. Guidelines for the management of
pediatric and adult tumor lysis syndrome: an evidence based review. J Clin Oncol 2008;26:2767-78.
42. Cheson BD, Cassileth PA, Head DR, et al. Report of the National Cancer Institute-sponsored workshop on definitions of diagnosis and response in acute myeloid leukemia. J Clin Oncol. 1990;8:813-819
43. Cason JD, Trujillo JM, Estey EH, et al. Peripheral acute leukemia: high peripheral but low bone-marrow blast count. Blood. 1989;74:1758-1761. 44. Rabizadeh et al. Acute leukemia detection rate by automated blood
count parameters and peripheral smear review. Int J Lab Hematol. 2015 Feb;37(1):44-9.
45. Pradhan RM, Gupte et al. Pattern of leukemias: a ten-year incidence study of 242 cases. J Postgrad Med 1989;35:191
46. Dusan Andoljsek et al. Cell markers in the recognition of Acute Myeloblastic leukemia subtypes. Cellular and molecular biology letters 2002;7(2); 343-345
47. Sazawal S, Kumar B et al. Haematological & molecular profile of acute myelogenous leukaemia in India. Indian J Med Res 2009;129:256-261. 48. Launder TM, Bray RA, Stempora L, Chenggis ML et al. Lymphoid-
Associated antigen expression by acute myeloid leukemia. Am J Clin Pathol 1996;106:185-91.
49. Bradstock KF, Kirk J, Grimsley PG, Hughes WG et al. Unusual immunophenotypes in acute leukemias: incidence and clinical correlations. Br J Haematol 1989;72:512-8.
50. Ball ED, Davis RB, Griffith JD, et al. Prognostic value of lymphocyte surface markers in acute myeloid leukemia. Blood 1991;77:2242-50. 51. Jine Zheng et al. A correlation study of immunophenotypic, cytogenetic
and clinical features of 180 AML patients in China. Cytometry 2008;74B: 25-29
52. Sudha S, Bijender K, Panchi D, Syed KH et al. Hematological and molecular profile of acute myelogenous leukemia. Indian Journal of Medicine Res 2009;129:256-261.
Conflict of interest: Nil Source of funding: Nil
Date received: August 9th 2017
![Table 4: CTCAE Grading Of Thrombocytopenia [13,14]](https://thumb-us.123doks.com/thumbv2/123dok_us/8841472.1795206/4.595.304.553.362.534/table-ctcae-grading-of-thrombocytopenia.webp)


