Doppler HF Radar Application for the Study of
Spatial Structure of Currents in the Black Sea
V.V. Gorbatskiy
1, K.D. Sabinin
2, V.A. Telegin
3, A.G. Zatsepin
4,*,
S.B. Kuklev
51Krylov State Research Centre, Saint-Petersburg, Russian Federation 2N.N. Andreev Acoustic Institute, Moscow, Russian Federation
3N.V. Pushkov Institute of Terrestrial Magnetism, Ionosphere and Radio Wave Propagation,
Russian Academy of Sciences, Moscow, Russian Federation
4P.P. Shirshov Institute of Oceanology, Russian Academy of Sciences, Moscow, Russian Federation
*e-mail: [email protected]
5Southern Department of the P.P. Shirshov Institute of Oceanology,
Russian Academy of Sciences, Gelendshik, Russian Federation
The results of the surface current spatial structure observations performed by SeaSonde Doppler HF radar (operating frequency is 25 MHz) in the Black Sea region adjacent to the city of Gelendzhik are represented. The observations imply a special technique consisting in successive measurements at two selected points of the coastline. Initially, the measurements are carried out in the first of two selected coastal points during two hours. Then the radar system is transferred to the second point on the coast where the procedure is repeated. At that the velocity field is assumed to remain unchanged during the total measurement period (including the time of the radar displacement) from both points. The meas-urement results are shown in a form of a spatial map of the current velocity vectors in the research region (with 20 × 20 km dimensions). Some features of the current spatial and temporal variability in the coastal waters are revealed. Particularly, the eddy-like formations (the diameter is a few kilome-ters) which rapidly move and collapse. Since similar eddies are detected using the contact measure-ment methods, complex and variable structure of the surface currents measured by a radar does not seem to be an artifact. Nevertheless, reliability of the data resulted from the radar measurements of the surface current velocity field should be verified in future by comparing it with the results of the quasi-synchronous velocity field measurements performed by stationary, drifting and towed velocity meters.
Keywords: the Black Sea, coastal zone, Doppler HF radar, two-point measurement range, correlation radius, antenna, surface currents, eddy structures
DOI: 10.22449/1573-160X-2017-3-58-68
© 2017, V.V. Gorbatskiy, K.D. Sabinin, V.A. Telegin, A.G. Zatsepin, S.B. Kuklev © 2017, Physical Oceanography
Introduction. The technology of surface current velocity measurement by
Doppler radars in the coastal zones of the seas and oceans has been developed and used in different countries, such as the USA, Canada, United Kingdom, France, Australia and Japan for almost 40 years [1]. Various companies produce Doppler HF radars (for example, SeaSonde radars by CODAR Ocean Sensors (USA) [2] and WERA by Helzel Messtechnik GmbH (Germany) [3]), which measure the ve-locity of surface currents in the coastal zone from 0.5–5 to 20–200 km from the shore with a 0.5–5 km spatial resolution, depending on the operational frequency range and the range of measurements. In the presence of the large amount of radars
spaced along the shore, it is possible to reconstruct the velocity field of surface cur-rents along the coastline, as is being carried out, for example, in California, USA [4].
Currently, Doppler radar systems operate in many countries. They are used to control currents and wind waves in coastal areas of the ocean and inland seas. Con-stant monitoring of the water surface by such systems allows warning of the tsu-nami approach and ensuring the safety of marine operations in the sea shelf devel-opment areas. The use of Doppler radars increases the effectiveness of measures to control the consequences of emergencies in areas of oil spills. In the USA, such devices are widely used by the US Coast Guard in emergency situations during search and rescue operations in the coastal waters of the ocean. For this purpose a network of Doppler radars along the eastern and western coasts of the country has been developed.
Unfortunately, it is necessary to note that in Russia the radar technology of re-search of marine hydrodynamic processes is not developed and Doppler HF radars to measure the surface current velocity in the sea water areas are not produced. The work on the Russian HF radar development described in papers [5, 6] is stopped because of a lack of funding. It is obvious that the constant radar observations in such areas as the Black Sea coastal waters have not only scientific but also great practical significance. In particular, the results can be used to solve the operational oceanology tasks (forecast of development of dangerous hydrodynamic processes, extreme waves and currents and prevention of possible emergency situations asso-ciated with them); ecological problems (registration and forecast of distribution of emergency oil spills); monitoring and prevention of dangerous meteorological con-ditions at the sea (tornadoes, thunderstorm clouds), etc.
In the domestic practice of marine research through a number of years (2005– 2009), measurements of surface currents using SeaSonde Doppler radar (operating frequency 25 MHz) were carried out in the Baltic Sea (the Curonian Spit area [7] and in the Kara Sea from the vessel [8]). However, these studies were characterized by selectivity and did not focus on the study of special hydrophysical processes that are significant for coastal water areas. This paper presents the results of meas-urements of surface sea currents in the Black Sea, previously published only in the report [9].
Measurement conditions and methods. The surface current velocity
the studied Black Sea water area and the altitude of the antennas above sea level (at the sea level, at altitudes of 4, 20 and 60 m above the sea level) affect the obtained signal, and also how trees, bushes and metal parapet were cut into the signal quali-ty. As a result, the position of the antennas providing an optimal area for registra-tion of the currents and a high quality of their measurement was chosen.
Detailed technical characteristics of SeaSonde Doppler radar are presented in [7]. In the present paper only the main features necessary for understanding the methodology of work are listed: the working frequency is 25 MHz, the spatial reso-lution is 0.75 km, the number of cells along each beam is 32, the angular distance between the radar beams along which the radial velocity components of the cur-rents are determined is 5°, probing distance is about 22 km (limited by the water salinity value about 18‰ in the water area).
The method with the sequential use of a single radar in two spaced points on the shore was implemented during the measurements. The essence of the method is as follows.
At the preliminary stage of the installation of radar antennas, the shore points are identified to meet the following criteria:
1) no more than 100 m distance from the water's edge;
2) the maximum openness of the sea horizon for the propagation of radio waves (no capes, elevations of terrain, artificial structures and other obstacles);
3) the maximum possible area of intersection of radar zones, freely covered from selected shore points;
4) convenient access for motor transport, providing the minimum possible time expenditure when moving from one measurement point to another.
First, the measurements are taken at the first of two selected shore points for 2 hours. Then the radar system is transferred to the second shore point, where the measurements are carried out in the same manner. In this case, it is assumed that the velocity field remains unchanged during the total (taking into account the mov-ing to another point) measurement period from both points. The obtained radial (in the direction of radar radiation) surface current components are processed using special software HFRadarmap in Matlab language, which is distributed freely on the Internet (URL: http://www.oc.nps.edu/~radlab/HFRadarmapToolbox/).
The full vectors of surface currents are the addition of radial vectors obtained from two different points.
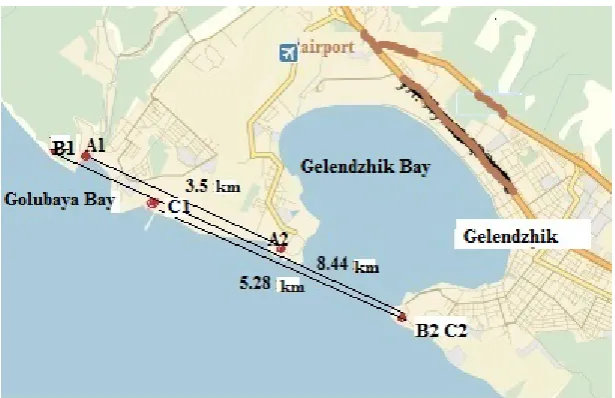
In the described experiment for the radar system transportation between the an-tenna installation points on the shoreline, the all-terrain UAZ minibus was used. In its cabin the measuring equipment was placed (Fig. 1, a). Fig. 1, b shows the installation of the radiating and receiving antennas at one of the measurement points. Fig. 2 is a map of the area where the measurements were carried out in October, 19–21, 2010, indicating the position of all radar installation points.
a b
Fig. 1. Layout of the measuring equipment in the minibus (а) and the position pattern of the radar antennas on the shoreline (b)
Fig. 2. Position of the radar antenna installation points on the shoreline during the measurements in October, 19–21. А1 and А2 points – for October, 19, B1 and B2 points for October, 20 and C1 and C2 points for October, 21
On the same day, measurements were taken from the A2 point, located on the seashore near the Tonkiy (Thin) Cape of the Gelendzhik Bay at a 3.5 km distance from the first point and approximately at the same height above the water level. The shape of the shoreline in the vicinity of this point is close to rectilinear and the locator has a free view of the adjacent water area over a wide range of scanning angles. It makes the measurement conditions optimal from the viewpoint of the water area coverage. However, the operational installation of antennas in a given location with rocky soil, presents a certain difficulty.
On October, 20, the location for the B1 point was selected on steep seashore westward of the Golubaya Bay at an altitude of about 60 m. This point provides a good overview for efficient operation of the radar system. However, it takes con-siderable time to reach this point and the vehicle must have high all-terrain capabil-ity due to the absence of a groomed road in the mountainous area.
On the same day, the B2 point was 8.5 km from B1 on the steep shore of Tol-stoy Cape of the Gelendzhik Bay at 20 m above sea level. This point has a good overview for recording the radial component of the current velocity throughout the examined water area, and it is easily accessible for any type of vehicle.
In order to change the overview area on October 21, the C1 and C2 points on the southeastern shore of the Golubaya Bay were chosen. The distance between these points was 5.3 km.
Most of the selected radar antenna locations provided a good overview and the possibility of reducing the interval up to 1.5 hours between measurements at the points.
Results of the measurements. The map of the radial velocity components of
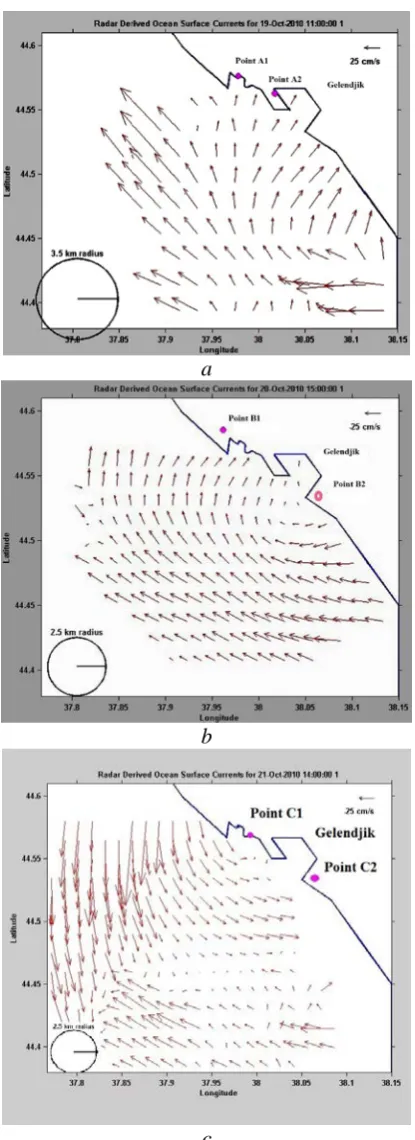
the sea surface obtained by the SeaSonde system on October 19 at the A1 point (Fig. 3, a) covers a relatively narrow spatial region. The reason is the high shore of the Golubaya Bay, which limits the locator scan in the western direction.
Fig. 3, b shows a map of the distribution of radial velocity components on Oc-tober 21 at the B2 point. Areas of measurement at all points (except the A1 one) have a good coverage, similar to that shown in Fig. 3, b. It makes it possible to ob-tain an extended intersection area of the measurement regions made of two points.
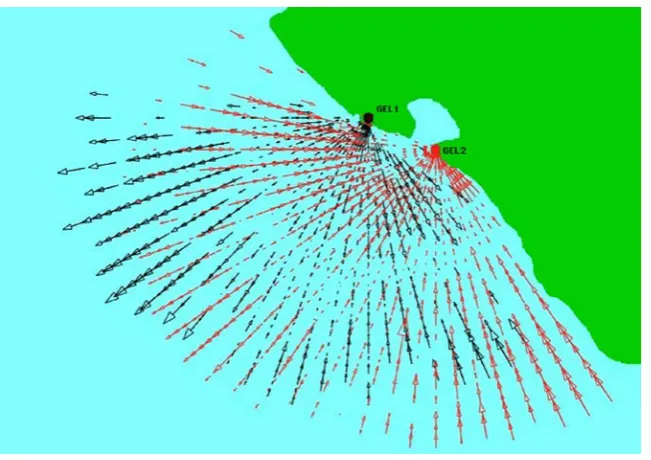
The construction area of the current velocity vector field based on the radar measurements is determined by the size and position of the intersection area of the radial velocity component maps obtained at two adjacent locations of the radar an-tenna. Fig. 4 presents an example of such an intersection according to the meas-urements carried out on October 21.
The vector field was constructed using a rectangular grid with a pitch of 0.015° step in latitude and longitude. On the maps of the current velocity vectors
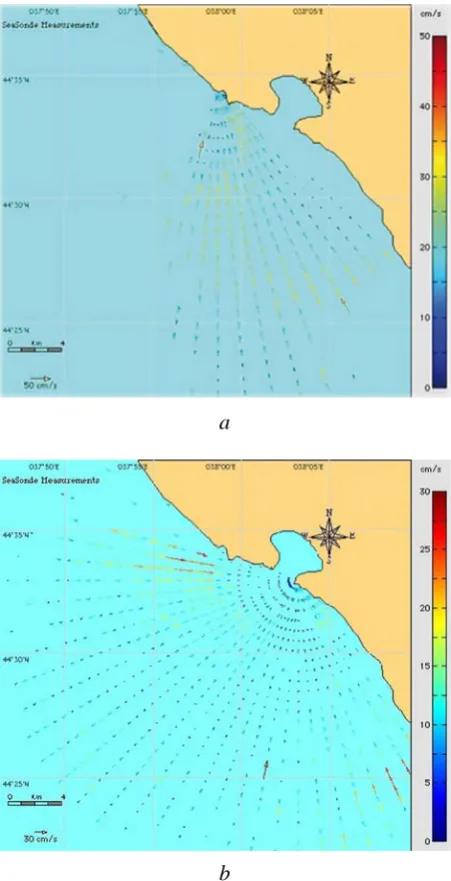
dated October 19–21, a circle of the corresponding scale in the lower left corner indicates the region of averaging of the radial velocity components that fall in the vicinity of the grid nodes with the indicated radius (Fig. 5).
a
b
Fig. 3. Examples of maps of the radial current velocity components on October 19 (a) and 21 (b)
cur-rents to the shore in the coastal area. The current velocity is generally about 25– 30 cm/s, however in some areas it reaches 50 cm/s.
Fig. 4. An example of the formation of the current velocity vector determination area based on the mapping of radial current velocity components on October 21
On October 20 an anticyclonic vorticity is marked on the current velocity map (Fig. 5, b). At that, the current velocity is directed mainly to the north-west, and its value does not exceed 25 cm/s. The intersection of the measurement areas carried out on October 20 from two points, which the current velocity vectors can be con-structed on, has a larger area than the intersection of the measurement areas per-formed on October 19. In this case, the distance between the antenna points on Oc-tober 20 is more than twice exceeds the distance between the measurement points on October 19, which reduces the probability of errors in the determination of the current velocity vectors.
On the map of currents, obtained on October 21, the measurement area has a good coverage and contains pronounced elements of the eddy-like currents (Fig. 5, c). The most characteristic features of this map are the current convergence zone in the middle part of the measured area and high values of the current velocity of the southern direction (up to 89 cm/s) in the western part of the cross-section area. The spatial inhomogeneity of the current velocity distribution may be due to a change in wind conditions during a 3-hour interval between measurements at two points.
a
b
c
The variety of maps of the current velocity fields obtained during three days of radar measurements may call into doubt their representativeness. However, during these measurements the dynamics of coastal waters in the Gelendzhik and No-vorossiysk regions were characterized by the complexity of the current structure and their high spatiotemporal variability. The MODIS-Aqua satellite image of this sea area in the suspended matter field dated October 18, 2010 is a definitely proves this (Fig. 6). According to the opinion of the authors of this work, three eddies clearly stand out in this image: the A anticyclone (closer to Novorossiysk), the C cyclone (closer to Gelendzhik) and the A anticyclone (to the east of Gelendzhik). They form the convergent current structure near the shore and the divergent one – out at sea. In Fig. 6, b the contours of the aforementioned sub-mesoscale eddy-like structures are indicated by dashed lines, and the direction of rotation – by arrows. Since, according to previously performed complex observations, these eddy-like formations move rapidly and are destroyed in rather sort time [10, 11]. So, the complex and variable structure of the surface currents measured by the radar is not an artifact.
a b
Fig. 6. Manifestations of the submesoscale eddies at the sea surface in the area of radar measure-ments on October, 18 according to the MODIS-Aqua satellite data
Conclusion. On October 19–21, 2010 in the Gelendzhik area of the Black Sea,
a successful attempt to measure the velocity field of the surface sea current using
SeaSonde Doppler HF radar was carried out. The method of radar measurements from two adjacent points of the coast is applied using a single radar, which is sub-sequently moved from one point to another.
The results of measurements showed the possibility of obtaining a realistic structure of the current field and its variability, even in the course of a short-term series of operational observations. In particular, the existence of eddy-like struc-tures in the alongshore currents was registered. At the same time, reliability of the data resulted from the radar measurements of the surface current velocity field should be verified in future by comparing it with the results of the quasi-synchronous velocity field measurements performed by stationary, drifting and
towed velocity meters [10, 11]. Such comparative measurements are already car-ried out at the Gelendzhik polygon of the IO RAS in the Black Sea [9].
Acknowledgements. The present work was supported by the RSF Grant
No. 14-05-00095.
REFERENCES
1. Barrick, D.E., Evans, M.W. and Weber, B.L., 1977. Ocean Surface Currents Mapped by
Ra-dar. Science, [e-journal] 198 (4313), pp. 138-144. doi:10.1126/science.198.4313.138
2. Codar Ocean Sensors. 2016. SeaSonde Remote Unit Specifications and Configuration
Op-tions. [online] Available at: http://www.codar.com/SeaSonde.shtml. [Accessed 10 May 2016].
3. Information of HR-Radar. 2016. University of Hamburg HR-Radar Home Page. [online]
Available at: http://ifmaxp1.ifm.uni-hamburg.de [Accessed: 10 May 2016].
4. Lynch, D.R., Holboke, M.J. and Naimie, C.E., 1997. The Maine Coastal Current: Spring Cli-matological Circulation. Con. Shelf Res., [e-journal] 17(6), pp. 605-634. doi:10.1016/S0278-4343(96)00055-6
5. Garbatsevitch, V.A., Telegin, V.А., Lapshin, V.S., Shaboldin, N.А., Ivanov, I.I. and Ivonin, D.V., 2011. Malogabaritnaya Mnogochastotnaya RLS Dekametrovogo Diapazona dlya Monitoringa Okeana i Ionosfery. Kontseptsii Razrabotki I Pervye Rezul'taty [Compact Multifrequency HF Radar for Ocean and Ionosphere Monitoring. Conception and First Tests]. Sovremennye Problemy Dis-tantsionnogo Zondirovaniya Zemli iz Kosmosa, [e-journal] 8(4), pp. 100-106. Available at: http://d33.infospace.ru/d33_conf/2011v8n4/100-106.pdf [Accessed 9 May 2016] (in Russian).
6. Garbatsevich, V.A., Lapshin, V.S., Telegin, V.A., Buzinsky, N.L., Shaboldin, N.A., Maksimova, N.S., Ivanov, I.I. and Ivonin, D.V., 2012. RLS Dekametrovogo Diapazona, Prednaznachennaya dlya Radio-lokatsionnogo Monitoringa Prirodnykh Sred [Radar of Decametric Band Designed for Radar Moni-toring of Natural Environments]. Special Equipment, (3), pp. 30-34 (in Russian).
7. Gorbatskiy, V.V., Babakov, A.N. and Gurova, E.A., 2008. Izmerenie Parametrov
Pribrezh-nykh Morskikh Techeniy Doplerovskim Radiolokatorom CODAR Seasonde [Measuring the Parameters of Coastal Marine Currents with CODAR SeaSonde Doppler Radar]. In: Trudy XXV Vserossiyskogo Simposiuma “Radiolokatsionnye Issledovaniya Prirodnykh Sred” [Proc. 25th All-Russia Symposium “Environment Radar Research]. Saint Petersburg, pp. 198-206 (in
Russian).
8. Gorbatskiy, V.V., Gudoshnikov, Yu.P. and Nesterov, A.V., 2011. Izmereniya Techeniy na
Morskoy Poverkhnosti Doplerovskim Radarom, Ustanovlennym na Sudne [Measurements of Currents on the Sea Surface by a Doppler Radar Mounted on a Ship]. In: Sbornik Trudov XXVII Vserossiiskogo Simposiuma “Radiolokatsionnoe Issledovanie Prirodnykh Sred” [Proc.
27th All-Russian Symposium “Environment Radar Research]. Saint Petersburg:
A.F. Mozhayskiy VKA, pp. 111-115 (in Russian).
9. Baranov, V.I., Gorbatskiy, V.V., Dudko, D.I., Zatsepin, A.G., Krayushkin, E.V., Kuklev, S.B., Kukleva, O.N., Lavrova, O.Yu., Myslenkov, S.A. and Nazirova, K.R., 2015. Novyy Podkhod k Issledovaniyu Submezomasshtabnoy Dinamiki Vod Chernomorskogo Shel'fa Dis-tantsionnymi i Kontaktnymi Metodami [A New Approach to the Study of Sub-Mesoscale Dy-namics of the Black Sea Shelf Waters by Remote and Contact Methods]. In: XXIII Vserossi-iskaya Otkrytaya Konferentsiya “Sovremennye Problemy Distantsionnogo Zondirovaniya Zemli iz Kosmosa” [Proc. 23th All-Russian Open Conference “Actual Problems in Remote
http://smiswww.iki.rssi.ru/d33_conf/thesisshow.aspx?page=109 [Accessed 9 May 2016] (in Rus-sian).
10. Zatsepin, A.G., Kremenetskii, V.V., Ostrovskii, A.G., Poyarkov, S.G., Korzh, A.O. and Solov’ev, D.M., 2008. Studies of the Hydrophysical Processes over the Shelf and Upper Part of the Continental Slopeof the Black Sea with the Use of Traditional and New Observation Techniques. Oceanology, [e-journal] 48(4), pp. 466-475. doi:10.1134/S0001437008040024
11. Zatsepin, A.G., Ostrovskii, A.G., Kremenetskiy, V.V., Nizov, S.S., Piotukh, V.B., Solov’ev
V.A., Shvoev, D.A., Tsibulsky, A.L., Kuklev, S.B., Kukleva, O.N., Moskalenko, L.V., Podymov, O.I., Baranov, V.I., Kondrashov, A.A., Korzh, A.O., Kubryakov, A.A., Solov’ev,
D.M. and Stanichny, S.V., 2014. Subsatellite Polygon for Studying Hydrophysical Processes in the Black Sea Shelf-Slope Zone. Izvestiya. Atmospheric and Oceanic Physics, [e-journal] 50(1), pp. 13-25. doi:10.1134/S0001433813060157