July and August 2012
Communicable Diseases Branch
Health Protection NSW
For updated information, including data and facts on specific diseases, visit www.health.nsw.gov.au and click on Public Healthand then Infectious
Diseases. The communicable diseases site is
available at: http://www.health.nsw.gov.au/ publichealth/infectious/index.asp.
Figure 1 and Tables 1 and 2 show notifications of commu-nicable diseases received in July and August 2012 in New South Wales (NSW).
Enteric infections
Outbreaks of suspected foodborne disease
Two of the nine complaints received by the NSW Food Authority about suspected foodborne disease in July and August 2012 were thought to be related to consumption of contaminated food. July and August was however a period of high levels of viral gastrointestinal disease in the community and most reports of suspected foodborne gastrointestinal illness in this period were, upon investiga-tion, thought to be cases of viral gastrointestinal disease spread person-to-person.
In July, NSW Health was notified of cases of gastrointesti-nal illness in nine members of a group of 15 people who shared a meal at a restaurant in Sydney. Case-patients developed vomiting and diarrhoea 25 hours after the meal and their symptoms lasted between 8 and 44 hours. Public health unit staff interviewed 12 members of the group, six of whom were case-patients. Foods consumed included scallop soup, baked pie, cheese souffle´, lamb, eggnog (served in an egg shell), mulled wine and three desserts (plum pudding Alaska, pear and walnut truffle and rasp-berry macaroons). The group had also attended pre-dinner drinks together which included casual food (chips, dips, salad and cupcakes). On analysis, illness was not associated with the consumption of any food items. No stool specimens were submitted for testing. The NSW Food Authority inspected the premises based on the inclusion
on the menu of raw egg food products that have a high risk forSalmonellacontamination. The restaurant has subse-quently taken extra steps to ensure food safety including sterilising the egg shells used in serving the eggnog and baking the meringue used in the Alaska dessert. The cause of the outbreak remains unknown.
In August, two separate groups of people reported illness following meals at a restaurant in Sydney on the same day. Four people in a group of seven, and six people in a group of eight, were affected with abdominal cramps and diar-rhoea approximately 14 hours after eating at the restaurant. Symptoms lasted between 10 and 20 hours. No stool specimens were submitted for testing. The common ingre-dient eaten only by the case-patients and not by other members of the groups was a creamy mushroom sauce. The symptoms and duration of illness are suggestive of a bacterial toxin, however an environmental investigation was not possible as the restaurant was destroyed by fire soon after illness was reported.
Viral gastrointestinal disease
There were 188 outbreaks of gastroenteritis in an institu-tion reported in July and August 2012, affecting at least 3684 people. The previous 5-year average for this period was 150 outbreaks. A total of 115 outbreaks occurred in aged-care facilities, 40 in child-care centres and 33 in hospitals. In the 138 outbreaks in which a stool specimen was collected, norovirus was confirmed in cases from 69 outbreaks and rotavirus was confirmed from 15.
There were 394 cases of rotavirus reported in July and August. This is the largest number of notifications for rotavirus since it became a notifiable condition in 2010. This increase is in parallel with increases in institutional outbreaks and presentations of gastroenteritis in emergency departments.
Respiratory infections
Influenza
positive for influenza B increased over the same reporting period but is well below the peak reached in June.
In July, there were:
• 659 presentations to emergency departments (rate 3.3 per 1000 presentations)
• 1711 cases of laboratory-confirmed influenza including: – 1552 (91%) influenza A
– 159 (9%) influenza B.
In August, there were:
• 477 presentations (rate 2.4 per 1000 presentations) • 1259 cases of laboratory-confirmed influenza including:
– 915 (73%) influenza A – 344 (27%) influenza B.
For a more detailed report on respiratory activity in NSW see: http://www.health.nsw.gov.au/PublicHealth/ Infectious/influenza_reports.asp
Vaccine-preventable diseases
Meningococcal disease
Twenty-two cases of meningococcal disease were notified in NSW in July and August 2012 (14 in July and eight in August), an increase from 15 notified in the same period in 2011. The age of the case-patients ranged from 3 months to 88 years and included five case-patients aged less than 5 years. The death of a 7-month old due to meningococcal disease serogroup B was notified in this period. Thirteen (59%) cases were due to serogroup B (for which there is no vaccine), three were due to serogroup Y, two (9%) were unable to be typed, and for three there was insufficient specimen collected. Of the 15 cases notified during the same period in 2011, 10 were due to serogroup B, two to serogroup W135, one to serogroup Y, and the remaining two were of an undetermined serogroup.
It is recommended that a single vaccine against meningo-coccal C disease be given to all children at the age of 12 months as well as persons at high risk of disease.1
Measles
Fifty-eight cases of measles were notified in NSW in July and August 2012; all were part of an ongoing outbreak that began in April. This was an increase compared to the 16 cases reported for the same period in 2011.
The age groups most affected were children aged 0–4 years (n¼25), of which 18 were infants aged less than 1 year, and young people aged 15–19 years (n¼11) and 10–14 years (n¼9). The average age of notified cases was 12.7 years (range: 4 months–41 years). Approximately half the case-patients were female (n¼28, 48%). Four (7%) case-patients were Aboriginal people, and all resided in Sydney South West Local Health District (LHD).
Pacific Islander communities continue to be disproportion-ately affected.
Most cases were notified in the Sydney South West Local Health District (88%), followed by Sydney West (Parra-matta) (10%) and Illawarra (2%) LHDs, with a concentra-tion of cases from a small number of local government areas including Campbelltown and Liverpool.
Of the 58 notifications, 57 (98%) were laboratory con-firmed. All specimens that were genotyped (n¼16) were measles virus genotype D8, indicating this outbreak is associated with the one measles importation from Thailand that was identified in April. Measles virus genotype D8 importations from Thailand in April have also been reported in Europe.2
The majority (90%) of the case-patients were not vaccinated for measles. Of the six case-patients that were reported to have been vaccinated, four were aged over 17 years and their vaccination status could not be verified on the Australian Childhood Immunisation Register; the other two case-patients were reported, based on parent recall, of having received one dose.
Two doses of measles-mumps-rubella (MMR) vaccine are recommended for all children (at 12 months and 4 years of age),1 as well as all young adults planning international travel.
Pertussis
During July and August, 831 cases of pertussis were notified in NSW, less than half the number of cases notified for the same period in 2011 (n¼1966). Most case-patients were aged 5–9 years (n¼220), followed by the 0–4-year age group (n¼162) and the 10–14-year age group (n¼129). A 6-week old unvaccinated infant from the Illawarra died from pertussis infection in July.
Direct protection for young infants remains available through free vaccination for pertussis that is administered at 2, 4 and 6 months of age. The first dose can be provided as early as 6 weeks of age. There is also a booster dose at 3½ to 4 years. New parents and grandparents should also discuss the benefits of pertussis vaccination with their general practitioner.
Sexually transmissible infections and bloodborne viruses
Gonorrhoea
There were 678 cases of gonorrhoea notified in NSW in July and August 2012, an increase of 45% compared with the same period last year (n¼467). Most cases were notified in South Eastern Sydney LHD (35%) and Sydney LHD (20%) and 81% of case-patients were men.
heterosexual sex. NSW Health is working to enhance surveillance of the infection to better understand the mode of transmission, risk factors and testing patterns at a local level. Gathering further information will help inform campaigns promoting safer sex messages to high-risk communities.
Immunisation Handbook. 9th ed. Canberra: Australian Government Department of Health and Ageing; 2008.
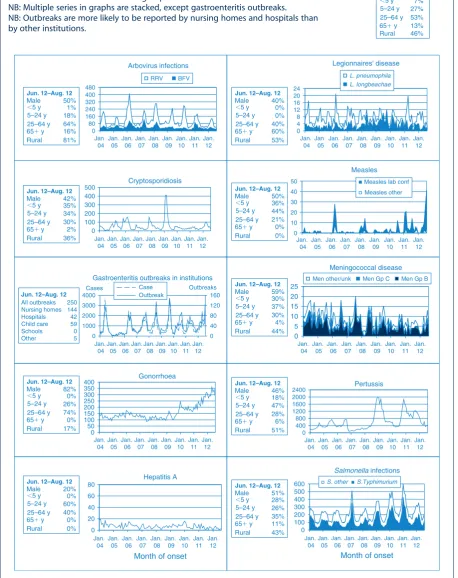
Figure 1. Reports of selected communicable diseases, NSW, January 2004 to August 2012, by month of onset.
Preliminary data: case counts in recent months may increase because of reporting delays. Laboratory-confirmed cases only, except for measles, meningococcal disease and pertussis. BFV¼Barmah Forest virus infections, RRV¼Ross River virus infections,
lab conf¼laboratory confirmed,
Men Gp C and Gp B¼meningococcal disease due to serogroup C and serogroup B infection, other/unk¼other or unknown serogroups.
NB: Multiple series in graphs are stacked, except gastroenteritis outbreaks. NB: Outbreaks are more likely to be reported by nursing homes and hospitals than by other institutions.
0 100 200 300 400 500 600
Salmonella infections
S. other S.Typhimurium
0
0 10 20 30 40 50 4 8 12 16 20 24
Legionnaires' disease
0 100 200 300 400 500
Cryptosporidiosis
0 5 10 15 20 25
Meningococcal disease
Men other/unk Men Gp C Men Gp B
0 50 100 150 200 250 300 350
400 Gonorrhoea
0 20 40 60 80
Hepatitis A
0 80 160 240 320 400 480
Arbovirus infections
RRV BFV
0 400 800 1200 1600 2000
2400 Pertussis
Measles
Month of onset
data not comparable
Month of onset
0 40 80 120 160
0 1000 2000 3000 4000
Gastroenteritis outbreaks in institutions
Case Outbreak
Cases Outbreaks
Jan. 04
Jan. 05
Jan. 06
Jan. 07
Jan. 08
Jan. 09
Jan. 10
Jan. 11
Jan. 12
Jan. 04
Jan. 05
Jan. 06
Jan. 07
Jan. 08
Jan. 09
Jan. 10
Jan. 11
Jan. 12
Jan. 04
Jan. 05
Jan. 06
Jan. 07
Jan. 08
Jan. 09
Jan. 10
Jan. 11
Jan. 12
Jan. 04
Jan. 05
Jan. 06
Jan. 07
Jan. 08
Jan. 09
Jan. 10
Jan. 11
Jan. 12
Jan. 04
Jan. 05
Jan. 06
Jan. 07
Jan. 08
Jan. 09
Jan. 10
Jan. 11
Jan. 12
Jan. 04
Jan. 05
Jan. 06
Jan. 07
Jan. 08
Jan. 09
Jan. 10
Jan. 11
Jan. 12
Jan. 04
Jan. 05
Jan. 06
Jan. 07
Jan. 08
Jan. 09
Jan. 10
Jan. 11
Jan. 12
Jan. 04
Jan. 05
Jan. 06
Jan. 07
Jan. 08
Jan. 09
Jan. 10
Jan. 11
Jan. 12
Jan. 04
Jan. 05
Jan. 06
Jan. 07
Jan. 08
Jan. 09
Jan. 10
Jan. 11
Jan. 12
Jan. 04
Jan. 05
Jan. 06
Jan. 07
Jan. 08
Jan. 09
Jan. 10
Jan. 11
Jan. 12
Jun. 12–Aug. 12
Male
⬍5 y 5–24 y 25–64 y 65⫹ y Rural
50%
18% 1%
64% 16% 81%
Jun. 12–Aug. 12
Male
⬍5 y 5–24 y 25–64 y 65⫹ y Rural
40%
0% 0%
40% 60% 53%
Jun. 12–Aug. 12
Male
⬍5 y 5–24 y 25–64 y 65⫹ y Rural
50%
44% 36%
21% 0% 0%
Jun. 12–Aug. 12
Male
⬍5 y 5–24 y 25–64 y 65⫹ y Rural
59%
37% 30%
30% 4% 44%
Jun. 12–Aug. 12
Male
⬍5 y 5–24 y 25–64 y 65⫹ y Rural
46%
47% 18%
28% 6% 51%
Jun. 12–Aug. 12
Male
⬍5 y 5–24 y 25–64 y 65⫹ y Rural
51%
26% 28%
35% 11% 43%
Jun. 12–Aug. 12
Male
⬍5 y 5–24 y 25–64 y 65⫹ y Rural
42%
34% 35%
30% 2% 36%
Jun. 12–Aug. 12
Male
⬍5 y 5–24 y 25–64 y 65⫹ y Rural
82%
26% 0%
74% 0% 17%
Jun. 12–Aug. 12
Male
⬍5 y 5–24 y 25–64 y 65⫹ y Rural
20%
60% 0%
40% 0% 0% All outbreaks 250 144 42 59 0 5 Nursing homes Hospitals Child care Schools Other
Jun. 12–Aug. 12
NSW Population
Male
⬍5 y 5–24 y 25–64 y 65⫹ y Rural
50% 7% 27% 53% 13% 46%
Measles lab conf Measles other
L. pneumophila L. longbeachae
Table 1. Notifications of scheduled medical conditions received in July 2012 by Local Health District, NSW Condition Local Health District Total Murrumbidgee (including Albury) Southern NSW Western NSW Far West Hunter New England Northern NSW Mid North Coast Central Coast Northern Sydney South Eastern Sydney
Illawarra
Shoalhaven
Sydney
Table 2. Notifications of scheduled medical conditions received in August 2012 by Local Health District, NSW Condition Local Health District Total Murrumbidgee (including Albury) Southern NSW Western NSW Far West Hunter New England Northern NSW Mid North Coast Central Coast Northern Sydney South Eastern Sydney
Illawarra Shoalhaven Sydney South Western Sydney Western Sydney Nepean Blue Mountains Justice Health For Aug b Year to date b Bloodborne and sexually transmitted Chancroid a –– – – – – – – – – – – – – – – – – Chlamydia (genital) a 76 43 65 6 275 77 50 73 147 286 8 3 1 26 119 170 76 31 1711 14 460 Gonorrhoea a 3 2 5 1 16 6 1 6 3 0 1 22 7 5 2 1 9 3 6 1 7 1 326 2684 Hepatitis B – acute viral a –– – – 1 1 – – – – – – – – – – 2 1 5 Hepatitis B – other a 4 1 2 – 4 – 1 1 39 29 1 3 1 4 1 5 6 – 2 2 13 1605 Hepatitis C – acute viral a –– – – 2 1 – 1 1 – – – – – – – 5 3 1 Hepatitis C – other a 14 8 1 2 1 48 17 10 20 13 19 12 31 25 27 7 2 8 2 92 2253 Hepatitis D – unspecified a –– – – – – – – – – – – – – – – – 3 Lymphogranuloma venereum – – – – – – – – – – – – – – – – – 8 Syphilis – – – – 2 – – 4 5 3 – 1 – 1 1 4 21 417 Vectorborne Barmah Forest virus a 1 1 1 – 3 7 1 – – – 1 – – – 1 – 16 219 Ross R iver virus a 7 1 2 – 4 3 3 1 – – 1 – 1 – – – 23 472 Arboviral infection (other) a – – 2 – 3 1 1 – 2 2 2 1 2 1 – 1 18 196 Malaria a 1– – – 1 – – – – 1 1 – 1 3 1 – 9 4 4 Zoonoses Anthrax a –– – – – – – – – – – – – – – – – – Brucellosis a –– – – 1 – – – – – – – – – – – 1 3 Leptospirosis a –– – – – – – – – – – – – – – – – 1 8 Lyssavirus a –– – – – – – – – – – – – – – – – – Psittacosis a –– – – – – – – – – – – – – – – – 1 0 Q fever a –– 2 – 2 – – – – – – – 1 – – – 5 7 7 Respiratory and other Blood lead level a 4 – 6 2 2 1 – – 1 – 2 – – 4 2 – 24 323 Influenza a 137 71 54 12 393 105 3 3 3 1 179 202 9 4 6 9 1 40 161 71 1 1 754 6379 Invasive pneumococcal infection a 3 3 4 – 11 8 3 3 8 9 5 4 9 13 5 – 88 387 Legionella longbeachae infection a –– – – 1 – – – 1 – 1 – – 1 – – 4 1 9 Legionella pneumophila infection a –– – – – – – – – – – – 1 2 – – 3 4 9 Legionnaires’ disease (other) a –– – – – – – – – – – – – – – – – 9 Leprosy – – – – – – – – – – – – – – – – – 2 Meningococcal infection (invasive) a –– – – – – – 1 – 1 – 1 1 2 2 – 8 5 0 Tuberculosis – – – – 1 – – – 2 4 – 1 – 5 – – 13 175 Vaccine-preventable Adverse event after immunisation 1 2 – – – – – – 2 1 – 1 – 1 1 – 9 120 H. influenzae b infection (invasive) a –– – – – – – – – – – – – – – – – 2 Measles – – – – – – – – – – – 1 3 0 4 – – 36 78 Mumps a –– 1 – – – – 1 1 5 2 3 1 – – – 1 4 8 7 Pertussis 29 24 42 – 3 2 1 6 8 9 5 1 3 1 3 9 2 2 4 6 7 2 2 9 – 450 4352 Rubella a –– – – – – – – – – – 1 1 – – – 2 9 Tetanus – – – – – – – – – – – – – – – – – – Enteric Botulism – – – – – – – – – – – – – – – – – – Cholera a –– – – – – – – – 1 – – – – – – 1 2 Cryptosporidiosis a 4 1 – – 4 – 1 – 4 1 1 1 1 2 3 2 – 3 4 534 Giardiasis a 6 3 6 – 14 1 1 5 2 7 2 0 5 8 6 10 6 – 118 1465 Haemolytic uraemic syndrome – – – – – – – – – – – – 1 – – – 1 7 Hepatitis A a –– – – – – – – – 1 – – 1 – – – 2 2 5 Hepatitis E a –– – – – – – – – – – – – – – – – 5 Listeriosis a –– – – – – – – – 1 – – – – – – 1 2 3 Rotavirus a 3 2 12 – 2 5 7 3 7 36 14 19 22 28 49 19 – 2 46 683 Salmonellosis a 11 4 4 4 2 1 5 1 1 4 1 7 2 6 1 6 1 6 2 0 2 8 1 4 – 201 2003 Shigellosis a –– – – – – – 1 1 2 – 2 2 – – – 8 9 1 Typhoid a –– – – – – – – 1 1 – – – – – – 2 3 1 Verotoxin producing E. coli a –– – – – – – – – – – – 1 – – – 1 1 1 Miscellaneous Creutzfeldt–Jakob d isease – – – – – – – – – – – – – – – – – 2 Meningococcal conjunctivitis – – – – – – – – – – – – – – – – – – aLabora tory-confirm ed cases only . bInclude s case s with unknown postcode. NB: Data a re current and accurate a s a t the prepa ration date. The number of cases reporte d is, however, subject to change, as cases may be entered at a lat er date o r retracted upon further investigatio n. Data a re reporte d b y Local Health Dis trict of residenc e (geocoded to 2011 boundaries). Sou rce: Notifia ble Cond itions Informat ion Management System, Health P rotection NSW.