Outbreak in an aged-care facility
Respiratory outbreaks in residential aged-care facilities are the cause of significant mortality and morbidity.1,2An out-break of an influenza-like illness occurred among residents and staff of a multi-purpose residential aged-care facility located on the north coast of New South Wales (NSW) in September–October 2006. At the time of the outbreak, there were 60 residents, ranging in age from 64 to 96 years, and 75 staff. The facility caters for residents with low- and high-care needs, and includes a purpose-built dementia facility. A high proportion of residents had previously been vaccinated against influenza A and B (96%; n⫽58); however, vaccina-tion coverage was low among staff members (27%; n⫽20).
Lessons from a respiratory illness outbreak
in an aged-care facility
Abstract: This report outlines practical lessons
learnt from an influenza-like outbreak in an aged-care facility in NSW, which affected 26 residents, resulted in 14 hospital admissions and was associated with six deaths. No common causative agent was identified. Key recommendations include: encouraging aged-care facilities to establish mechanisms that improve the early identification of outbreaks and timely imple-mentation of outbreak control strategies; identifying strategies to inform general practitioners of outbreaks if they have patients residing in aged-care facilities; and improving the vaccination coverage of the aged-care workforce.
John Turahui
A, Cate Wallace
B, Paul Corben
A,Cand Robin Osborne
AAPublic Health Unit, North Coast Area Health Service
BNSW Public Health Officer Training Program, NSW Department of Health CCorresponding author. Email: [email protected]
Public health response
Course of the outbreak
The outbreak extended over a 7-week period starting on 2 September 2006, with onset of the last case reported on 20 October 2006. A total of 26 residents (43%) and one staff member (1%) were affected. Of these, 14 residents (54%) were hospitalised and six (23%) died.
Immediate actions taken by the public health unit and aged-care facility
On 17 October 2006 the North Coast Area Health Service (NCAHS) Public Health Unit (PHU) was notified of the out-break. The aged-care facility was advised to implement several strategies to contain the outbreak including: isolating sick residents; excluding sick staff; increasing infection control practices; deferring admissions; and discouraging non-essential visitors to the facility. The facility was also provided with fact sheets and the Guidelines for the
preven-tion and control of influenza outbreaks in residential care
facilities in Australia.3
During a site visit on the day following notification to the PHU, nasal and throat swabs and blood samples were taken from ill residents at the facility and from residents who had been admitted to hospital. In addition, PHU staff collected and reviewed information about affected staff and residents, including basic demographics, symptoms and onset date from those who had experienced symptoms since 2 September 2006. PHU staff also found that the facility was experiencing difficulty in sourcing protective (P2) masks. These are high efficiency, disposable masks with the capacity
NSW PUBLIC HEALTH
BULLETIN
Vol. 19(9–10) • September–October 2008
State Health Publication PH 080328 ISSN 1034 7674
w w w. p u b l i s h . c s i r o. a u / j o u r n a l s / p h b CONTENTS – See back page
154 | Vol. 19(9–10) 2008 NSW Public Health Bulletin
to filter up to 95% of airborne particles with an aero-dynamic diameter of 0.3 micron or more. The PHU was able to provide additional mask stocks.
Approximately 30 general practitioners who provided care to residents of the facility were notified of the outbreak by a letter forwarded by the facility. Antibiotics were pre-scribed for some symptomatic and asymptomatic residents by their general practitioners. Where possible, convalescent serology was collected 4 weeks later.
Diagnosis and testing
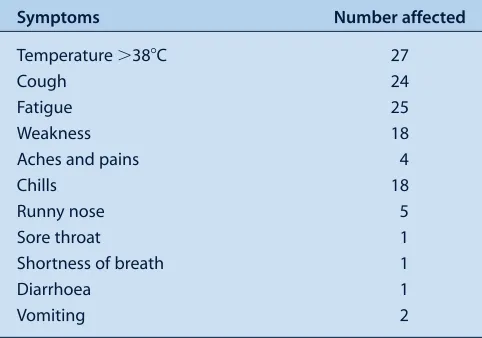
After considering relevant national guidelines, the range of symptoms reported and the occurrence of laboratory-confirmed influenza in surrounding locales, a case defini-tion was formed.3For this outbreak, a case was defined as a resident or staff member of the facility who had a fever of 38°C or more, and at least two of the following symptoms with onset after 2 September 2006: chills, cough, fatigue, aches and pains (including severe pain), diarrhoea, vomit-ing and hypertension. A summary of the symptoms experi-enced by affected people is presented in Table 1.
Symptomatic residents received point-of-care tests for influenza A and B during an initial site visit. Point-of-care tests, or tests that occur at the patient’s beside, allow physi-cians to diagnose patients more rapidly than traditional laboratory-based testing. The Victorian Infectious Diseases Reference Laboratory tested nasal and throat swabs and blood samples taken from sick residents at a later date, for a range of conditions including: influenza A and B, parainfluenza, respiratory syncytial virus, adenovirus,
Chlamydophila psittaci, Mycoplasma pneumoniae and Legionella pneumophila. Test selection was guided by
avian and pandemic influenza protocols and Guidelines
for the prevention and control of influenza outbreaks in residential care facilities, as well as potentially relevant
environmental features of the facility, such as water foun-tains and domestic birds.3–5
Ongoing response to the outbreak
Two days after the outbreak notification, on 19 October, a teleconference was convened to discuss: the status of the outbreak, action taken, potential sources of infection and future management of the outbreak. The discussion group consisted of: the facility’s Acting Director of Nursing; the Director of Medical Services and the infection control practitioner from the local hospital; and staff from the PHU and the Communicable Diseases Branch of NSW Department of Health. The possibility of further hospital admissions and the range of pathology tests to be under-taken were also discussed.
Throughout the outbreak, the PHU was in regular (at least daily) contact with the facility and the local hospital, and provided updates on the status of the outbreak, the likeli-hood of further hospitalisations and the health status of residents at the facility.
A second site visit was conducted on 20 October in order to: • review the effectiveness of the infection control
strategies implemented by the facility • identify potential sources of infectious agents • interview residents and staff members
• collect additional nasal and throat swabs and blood samples from ill and convalescing residents.
Samples were initially sent to the local pathology service for analysis. However, due to the number of sample batches, the range of tests required and the need for rapid processing, the samples were forwarded to the Victorian Infectious Diseases Reference Laboratory for analysis, as described above. Where possible, convalescent serology was collected 4 weeks after the first visit.
The results of the serological tests were inconclusive and no common causative agent was identified. One of six point-of-care tests performed was positive for both influenza A and B; however, the sensitivity and specificity of these tests is limited.6Serology of convalescent patients also failed to identify a common causative agent.
Media issues
The outbreak received considerable media interest. Initially the aged-care facility was reluctant to make any public comment. Following increasing media speculation about the nature and extent of the outbreak, the NCAHS issued a statement on 30 October 2006 confirming that an outbreak of an unidentified infectious respiratory illness had been associated with the death of elderly people in residential care and requesting unwell people to avoid visiting aged-care facilities and health-aged-care facilities. The media state-ment did not identify the aged-care facility nor provide details of the number of suspected cases or deaths. In response, a local newspaper used funeral notices from the previous week to speculate that up to 13 people over the age Table 1. Frequency of symptoms among affected residents
and staff at a residential aged-care facility on the north coast of NSW, September –October 2006 (Nⴝ27)
Symptoms Number affected
Temperature ⬎38⬚C 27
Cough 24
Fatigue 25
Weakness 18
Aches and pains 4
Chills 18
Runny nose 5
Sore throat 1
Shortness of breath 1
Diarrhoea 1
of 80 had died as a result of the outbreak. The following day the parent company of the aged-care facility issued a state-ment that appeared to conflict with the NCAHS statestate-ment regarding the link between recent resident deaths and the respiratory illness. This statement aroused further media interest and led to the involvement of the NSW Shadow Minister for Health. The local Member of Parliament wrote to the NSW Minister for Health requesting that the matter be investigated.
Public health lessons
Interaction between public health units and aged-care facilities
Several valuable lessons were learnt as a result of this outbreak. Most importantly, it highlights the need either to meet with aged-care providers regularly or involve them in periodic emergency management training ses-sions. This regular contact with aged-care facilities would emphasise the importance of early outbreak notification and close liaison with the PHU on matters such as vacci-nation and infection control. In this outbreak, the delay in the facility identifying and notifying the PHU of the out-break may have contributed to difficulties in containing its spread and led to increased media interest. With support from PHUs, aged-care facilities should be encouraged to establish sentinel surveillance systems to improve out-break recognition and timely implementation of infection control strategies. The NCAHS PHU has written to all res-idential aged-care facilities in the region to advise them of the resources available to assist in dealing with outbreaks, including notification procedures.
Laboratory testing
Considerable delay was experienced in receiving serolog-ical test results. Increased clarity about the tests available at reference laboratories and improved efficiency in trans-porting specimens to laboratories during an outbreak may shorten turnaround times for test results and aid the iden-tification of appropriate treatment and infection control measures. The management of this outbreak would have benefited from closer liaison between the PHU and pathology laboratories, and the advocacy of the NSW Public Health Laboratory Liaison Officer when labora-tory-related issues arose.
Informing general practitioners
Appropriate strategies for informing general practitioners who have patients residing in affected facilities need to be identified. In the case of this outbreak, the only available means of notifying the general practitioners of the resi-dents of the outbreak was by a letter from the facility. This emphasises the need for a collaborative response to out-breaks between aged-care facilities, attending general practitioners and PHUs. It also reinforces the need for col-laboration with Divisions of General Practice and aged-care panels and committees, where they exist, and the importance
of seeking the consent of residents and the facility for information-sharing between agencies.
Controlling the outbreak
Although influenza was not identified as the likely causative agent in this outbreak, it provides important inci-dental lessons for influenza control in aged-care facilities. Researchers have reported that elderly residents of aged-care facilities often have an impaired immune response to influenza vaccinations due to age or co-morbidities.7,8 Influenza outbreaks have been reported in aged-care facil-ities with high levels of vaccination coverage (more than 85%), even when the vaccine used matches the circulating influenza strain.9,10 In this facility, influenza vaccination coverage among residents was high (96%); however, vac-cination levels among staff were low (27%). This low vaccination rate may in part be because influenza vaccinations are not provided free of charge to staff of aged-care facilities. One high priority for preventing influenza outbreaks in aged-care facilities is to prevent the introduction of the virus into the facility by ensuring high levels of vaccination coverage among all health-care workers and visiting general practitioners. To achieve this outcome, incentives for facilities to fund staff vaccinations could be considered. Increasing vaccination coverage among visitors is harder to achieve. One strategy is to educate the general public about the risks of transmitting respiratory illnesses when visiting health-care facilities. Appropriate signage at aged-care facilities and advice in the media during outbreak events are additional potential strategies that would reinforce these messages.
Liaison between care and health organisations
A standardised notification procedure to a defined point within the Australian Government Department of Health and Ageing would assist PHUs and the NSW Department of Health to provide timely outbreak notification. Identifi-cation of an appropriate mechanism to advise the NSW Ambulance Service of outbreaks in private facilities is also necessary.
Managing the outbreak through regular liaison with the affected facility, local hospital and PHU was considered beneficial for all, as this allowed joint problem-solving and information sharing. It also assisted in planning for poten-tial hospital admissions and discharges. It would have been useful for this group to have jointly issued a media release to avoid the controversy that ensued following the perceived contradiction between the PHU and the facility’s media releases.
Summary
156 | Vol. 19(9–10) 2008 NSW Public Health Bulletin
agent was identified. The practical lessons learnt that may be of use to other PHUs include:
• encouraging aged-care facilities to establish mechanisms for effective early identification of outbreaks and timely implementation of infection-control strategies
• identifying effective strategies to inform general practitioners, the NSW Ambulance Service and the Australian Government Department of Health and Ageing of outbreaks in aged-care facilities
• improving the vaccination coverage among the aged-care health workforce.
References
1. Guy RJ, Di Natale R, Kelly H, Lambert S, Tobin S, Robinson P et al. Influenza outbreaks in aged-care facilities: staff vaccina-tion and the emerging use of antiviral thereapy. Med J Aust 2004; 180: 640–2.
2. Ellis S, Coffey C, Mitchel E, Dittus R, Griffin M. Influenza-and respiratory syncytial virus-associated morbidity Influenza-and mortality in the nursing home population. J Am Geriatr Soc 2003; 51: 761–7. doi:10.1046/j.1365-2389.2003.51254.x
3. Communicable Disease Network Australia. Guidelines for the prevention and control of influenza outbreaks in residential care facilities in Australia. Canberra: Department of Health and Ageing; 2005.
4. NSW Health. NSW Health Pandemic Influenza Interim Response Protocol for Public Health Units 2006. Sydney: NSW Health; 2006. Available from: http://www.health.nsw.gov.au/ pandemic/docs/piresponse.pdf (Cited 19 March 2007.)
5. Department of Health and Ageing. Australian Management Plan for Pandemic Influenza, June 2005. Canberra: Department of Health and Ageing; 2005. Available from: http://www.health.gov.au/internet/main/publishing.nsf/ Content/FC517607D6EE443ECA2570190019CDF7/$File/ pandemic_plan.pdf (Cited 24 October 2008.)
6. Charles PG, Grayson ML. Point of care tests for lower respiratory tract infections. Med J Aust 2007; 187(1): 36–9.
7. National Health and Medical Research Council. The Australian immunisation handbook. 8th ed. Canberra: NHMRC; 2003. Available from: http://www9.health.gov.au/immhandbook/ pdf/handbook.pdf (Cited January 2007.)
8. Bradley SF. Prevention of influenza in long-term-care facilities. Long-Term-Care Committee of the Society for Healthcare Epidemiology of America. Infect Control Hosp
Epidemiol 1999; 20: 629–37. doi:10.1086/501687
9. Morens DM, Rash VM. Lessons from a nursing home outbreak of influenza A. Infect Control Hosp Epidemiol 1995; 16: 275–80.
Pertussis is an acute infectious disease that is vaccine pre-ventable but cases still occur because vaccination cover-age is not complete and protection wanes with time. Although it is usually regarded as a childhood illness, where severe morbidity and mortality of the disease occur in very young children, pertussis can occur at any age.
Pertussis appears to be endemic in the former Macquarie Area Health Service (now part of Greater Western Area Health Service) in New South Wales (NSW). Epidemics occur in addition to a background of regularly reported cases. We describe here three clusters of pertussis in aged-care facilities (private nursing homes) that occurred as part of an outbreak in 2004. The clusters occurred in two towns within the area health service.
Index case A: aged-care facility 1
On 8 July 2004, the Macquarie Area Health Service Centre for Population Health was notified of a possible case of pertussis in a staff member of an aged-care facility (facility 1) in a town in the northern part of the area. The staff member had a spasmodic cough and a high serum IgA titre
Evidence of pertussis clusters in three
aged-care facilities in the former Macquarie
Area Health Service, NSW
Abstract: During a limited outbreak of pertussis in
an area health service in NSW, three clusters occurred in aged-care facilities – the first reported outbreaks of pertussis in Australian nursing homes. The attack rates across the three clusters were 16.7% for staff and 15.7% for residents. Our inves-tigation revealed that older adults are not immune to pertussis. We suggest methods for controlling a pertussis outbreak in an aged-care facility.
Ala’a Al-Murieb
A, Anthony M. Brown
A,B,
Alexandra Raulli
A, Carol George
A,
Carole Gander
A, Patsy Forrester
Aand Sharwyn Gibson
AAPopulation Health Division, Greater Western Area Health Service
BCorresponding author. Email: tony.brown@ gwahs.health.nsw.gov.au
to pertussis (IgA positive). The local general practitioner (GP) managed the person as an incident case. The GP ini-tiated treatment and advised the patient to stay at home. This became index case A.
It was initially thought that the positive blood test of index case A represented a persistent IgA response to previous pertussis, notified in 2000. As a precaution, the facility was advised to carry out active case finding and appropri-ate tests. This strappropri-ategy involved testing all people in the facility with a cough and those who developed a cough in the two to three weeks following identification of index case A. A diagnosis of pertussis was defined as IgA posi-tivity in the presence of a clinically compatible illness.
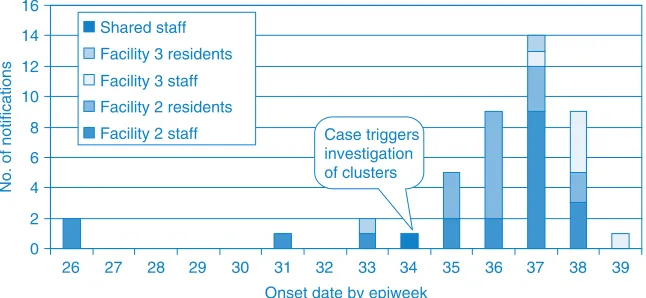
Index case B: aged-care facilities 2 and 3
On 9 September 2004, in another town, a case of pertussis (positive IgA) was reported in an assistant in nursing who worked in two aged-care facilities (facility 2 and facility 3), and who had had a coughing illness compatible with per-tussis for two to three weeks. The date of onset of the illness was between 16 and 23 August (Epiweek 34). The treating GP had started the patient on erythromycin for 14 days and provided a sick leave certificate for five days.
Public health response
At facility 1, the public health response aimed to ensure that cases and contacts were treated appropriately to limit infection. Symptomatic staff were advised not to attend work until five days of recommended antibiotic treatment had been completed. The facility was advised to imple-ment appropriate infection control guidelines, including: personal hygiene and personal protective equipment; min-imising visitors (especially children and pregnant women); and early detection of new cases by testing all staff or res-idents who developed a cough.
158 | Vol. 19(9–10) 2008 NSW Public Health Bulletin Response at facility 1
Three weeks after the notification of index case A, a further eight cases were reported from facility 1. A number of residents and staff had developed a cough and had had blood tests. Seven out of 24 residents and one additional staff member were IgA positive and reported to have a cough (Table 1).
Over the next week, other concerned asymptomatic staff members arranged to be tested and four more matic staff were found to be IgA positive. Being asympto-matic, these people were not regarded as cases.
Response at facility 2
Facility 2 actively identified and tested residents with a cough. A number of IgA positive tests among the residents were reported on 15 September 2004 (Table 1).
In response, an investigation team visited facility 2 to obtain epidemiological information about the people who tested positive in order to support the facility and advise on appropriate infection-control procedures. Detailed information about the cases was difficult to obtain as age, dementia and illness meant that most of the people could not remember or communicate their immunisation status or could not remember having previously had a whooping cough-like illness.
The team recommended that all residents who had devel-oped a cough in the preceding three weeks should receive antibiotic treatment regardless of IgA status. All residents who developed a cough in the following week were treated empirically (i.e. treatment was initiated before a diagnosis of pertussis was confirmed).
Symptomatic staff were advised to be tested, to be treated and to take leave from work until they had completed five days of antibiotic treatment. A fact sheet was distributed to visitors, and signs were posted to exclude high-risk cate-gory visitors (children less than one year of age, children between 12 months and 5 years who were not fully immu-nised and women in the last month of pregnancy). This outbreak and the infection control procedures generated local media interest and a media release was issued and followed up with television and radio interviews.
Response at facility 3
Despite having received the same information and advice as facility 2, facility 3 did not actively identify residents and staff with a cough. Facility 3 had fewer symptomatic residents and staff. A few people developed a cough in the following weeks and tested positive (Table 1).
Results
The number of staff and residents found to have pertussis and the attack rates in each of the three aged-care facilities are shown in Table 1. In each facility, a significant propor-tion of the staff was affected. Facility 2 and facility 3 were situated in the same town. In both facilities, a significantly larger proportion of staff were affected than residents.
A review of the notifications for pertussis in facility 2 and facility 3, and a calculation of their onset dates, revealed five cases with onset before index case B.
Discussion
These three clusters arose during 2004, a high incidence year for pertussis in the former Macquarie Area Health Service. The clusters occurred in two different towns in the area: facility 2 and facility 3 were situated in the same town and had a significantly larger proportion of staff affected than residents.
Pertussis has generally been considered a disease of chil-dren. In NSW, there has been a shift in the age distribution of new cases of pertussis from pre-teens to adolescents.1 Pertussis is not assumed to be significant in adults. Our data clearly show that outbreaks of pertussis can occur in elderly people. Other researchers have found an incidence rate of serologically defined infection of 19.7 per 100 person-years in a group of 100 people aged over 65.2 Pertussis in adults produces considerable morbidity and, in addition, provides a significant reservoir of infection for children.
Outbreaks of infectious diseases such as influenza are well known to occur in nursing homes.3,4 Pertussis outbreaks have less commonly been reported: an outbreak of pertus-sis in a Wisconsin nursing home in the 1980s and an out-break in severely handicapped patients in a neurological ward have previously been described.5,6This occurrence Table 1. Cases of pertussis in three aged-care facilities in the former Macquarie Area Health Service (now part
of Greater Western Area Health Service) in NSW, 2004
Number Number Staff Resident Staff attack Resident attack
of staff of residents cases cases rate (%) rate (%)
Facility 1 22 24 2 7 9.10 29.20
Facility 2 90 80 21 15 23.30 18.80
Facility 3 67 62 7 3 10.50 4.80
is the first reported in an Australian nursing home. In 2005, the United States’ Centers for Disease Control and Prevention (CDC) reported outbreaks of pertussis in hos-pitals in three states.7
Importantly, outbreaks of pertussis in residential institutions have also involved staff. In an investigation of pertussis in a residential facility for handicapped people, the epidemio-logical evidence suggested that the infection was introduced and spread by staff.8It is common for staff to work in more than one aged-care facility and this movement facilitates disease transmission. In facility 2 and facility 3, the review of notifications of pertussis and the calculation of their onset dates revealed five cases in these two facilities reported before index case B (Figure 1). Because staff members had pertussis before the index case triggered investigation, it is most likely that the infection was intro-duced to the facilities by staff. As pertussis is endemic in this area, undiagnosed cases maintain the disease in the community and may be responsible for outbreaks.
The outbreak was controlled by rapid identification and treatment of people with a cough. The implementation of prevention strategies also played an important role in the control of the outbreak. Although it has been reported that prophylactic antibiotics have a role in controlling the extent of pertussis outbreaks, mass prophylactic antibi-otics were not used in this situation as they are not recom-mended by NSW Health guidelines.9,10Hospital outbreaks reported by CDC did use prophylactic antibiotics for con-tacts and, although further cases did not occur, the role of prophylactic antibiotics remains uncertain.7
Vaccination is the mainstay of pertussis prevention although one report indicated that the attack rate in immunised residents was the same as for non-immunised residents.8 Until recently, there has not been a pertussis vaccine rec-ommended for use in adults: normally, immunisation of this
age group would have occurred many years earlier in child-hood and immunity may have waned. The efficacy of per-tussis vaccination in adults during an outbreak has been suggested but has yet to be established.2,7,8
These three clusters also underline the limitation of detec-tion using specific IgA alone. IgA may persist for some time after the acute infection and may have delayed the identification of the initial case.11However, IgA may also be positive without symptoms and a diagnosis of pertussis depends on IgA positivity in the presence of a clinically compatible illness. In facility 2, a number of asympto-matic staff were tested and found to be positive for IgA.
Conclusion
This investigation has shown that pertussis outbreaks can occur in adults in semi-enclosed communities, such as nursing homes, and that staff can readily transmit the disease. With the present availability of a multivalent vaccine containing pertussis that is suitable for adults, routine vacci-nation of staff at aged-care facilities should be considered.
References
1. Brotherton J, McAnulty J. A Pertussis epidemic in NSW: How epidemiology reflects vaccination policy. N S W Public Health
Bull 2003; 14: 77–81. doi:10.1071/NB03024
2. Hodder SL, Cherry JD, Mortimer EA, Ford AB, Gornbein J, Papp K. Antibody responses to Bordetella pertussis antigens and clinical correlations in elderly community residents.
Clin Infect Dis 2000; 31(1): 7–14. doi:10.1086/313913
3. Guy RJ, Di Natale R, Kelly H, Lambert SB, Tobin S, Robinson PM et al. Influenza outbreaks in aged-care facilities: staff vaccination and the emerging use of antiviral therapy. Med J
Aust 2004; 180(12): 640–2.
4. Bush KA, McAnulty J, McPhie K, Reynolds R, Boomer M, Clarkson LM et al. Southern New South Wales Public Health Unit. Antiviral prophylaxis in the management of an influenza outbreak in an aged care facility. Commun Dis Intell 2004; 28(3): 396–400.
Evidence of pertussis clusters in three aged-care facilities
0 2 4 6 8 10 12 14 16
26 27 28 29 30 31 32 33 34 35 36 37 38 39
Shared staff
Facility 3 residents
Facility 3 staff
Facility 2 residents
Facility 2 staff Case triggers investigation of clusters
Onset date by epiweek
No. of notifications
160 | Vol. 19(9–10) 2008 NSW Public Health Bulletin
5. Addiss DG, Davis JP, Meade BD, Burstyn DG, Meissner M, Zastrow JA et al. A pertussis outbreak in a Wisconsin nursing home. J Infect Dis 1991; 164(4): 704–10.
6. Tomoda T, Ogura H, Kurashige T. The longevity of the immune response to filamentous hemagglutinin and pertussis toxin in patients with pertussis in a semiclosed community. J Infect Dis 1992; 166(4): 908–10.
7. Centers for Disease Control and Prevention. Outbreaks of pertussis associated with hospitals: Kentucky, Pennsylvania and Oregon, 2003. Morb Mortal Wkly Rep 2005; 54: 67–71.
8. Tanaka Y, Fujinaga K, Goto A, Iwai H, Aoyama T, Murase Y et al. Outbreak of pertussis in a residential facility for handicapped people. Dev Biol Stand 1991; 73: 329–32.
9. Partiarca PA, Steketee RW, Biellik RJ, Wassilak SG, Brink EW, Burstyn DG et al. Outbreaks of pertussis in the United States: the Wisconsin experience. Tokai J Exp Clin Med 1988; 13(Suppl.): 117–23.
10. NSW Health. Occupational screening and vaccination against infectious diseases. NSW Health Circular 2003/91.
NSW Health: Sydney; 2003.
Falls in older people are common, costly and potentially debilitating. Falls are the leading cause of injury-related hospitalisation and death in people aged 65 years and older, and often result in high economic and social costs.1,2 Depending on the population under study, between 22 and 60% of fallers suffer injuries from their falls.3,4 Major injuries including soft tissue damage, head trauma, dislo-cations and fractures occur in 5 to 15% of all falls in any given year. Furthermore, it has been estimated that 20% of older people who experience a fall sustain injuries that require medical attention.5,6
Studies undertaken in Sweden, the United States and the United Kingdom have drawn attention to the significant direct health-care costs required for the treatment of fall-related injury.7–12Two recent studies have used aggregated data to examine the current and projected costs of fall injuries in Australia.13,14One study examined all injury cat-egories and found that fall injuries were the most costly of any injury mechanism.13 The second study, which was
Hospital and non-hospital costs for fall-related
injury in community-dwelling older people
Abstract: Objectives: This study determined the
cost of fall-related health care in a cohort of community-dwelling people. Methods: 578 people aged 75 years and over were monitored for falls and related health-care costs for one year. Results: The mean cost per injurious fall was $1600 (year 2000 dollars). Hospital costs accounted for 67% of the total cost, even though only 4% of injurious falls required hospital admission. The cost of non-hospital health care was also substantial.
Conclusion: This study highlights the economic
burden of falls and the importance of injury pre-vention strategies.
Anne C. Tiedemann
A,B, Susan M. Murray
A,
Bridget Munro
Aand Stephen R. Lord
AAPrince of Wales Medical Research Institute, University of New South Wales
BCorresponding author. Email: [email protected]
undertaken on behalf of the Australian government, found that ageing of the Australian population in the next 50 years will have a significant impact on the health system due to the increased number of older people suffering fall-related injuries.14 The study concluded that prevention strategies will need to deliver a reduction in falls incidence of approx-imately 66% in order to maintain cost parity with current health system costs. A third Australian study estimated fall-related costs in more detail by assessing costs for 79 older people admitted to acute hospital care due to a fall and then discharged to the community.15 Community and informal care costs were derived from daily diaries completed by par-ticipants in the three-month period following hospital dis-charge and the results showed that hospital costs accounted for most of the post-fall care costs, but that community and personal costs were also substantial. A larger, subsequent study by the same authors found that more than half of the total fall-related health-care cost was attributed to hospital inpatient care when costs were examined for people attend-ing emergency departments (EDs) in Western Australia over a one-year period.16A limitation of these study designs, however, is that they only included subjects who had attended a hospital ED following a fall-related injury, thereby limiting the focus to the small percentage of falls that result in serious injury.
The current study builds upon the previous population-aggregated cost studies by broadening the scope of costs included in the analysis to include non-hospital health care in addition to costs associated with hospital admission for all injurious falls, regardless of severity. We examined the cost and cost components of all individual injurious falls that occurred in a large sample of community-dwelling people aged 75 years and over, over a one-year period. For each fall we ascertained costs related to hospitalisation, ambulance, ED presentation, non-hospital medical and allied health care, pharmaceutical and diagnostic investi-gation and other out-of-pocket expenses to provide accu-rate costs of individual falls and the costs of the various health-care components required for their treatment.
Methods
Participants
162 | Vol. 19(9–10) 2008 NSW Public Health Bulletin
company and invited to take part in a randomised con-trolled falls-prevention trial, conducted in northern Sydney between 1999 and 2002.17 Exclusion criteria included minimal English, blindness, Parkinson’s disease or a Short Portable Mental Status Questionnaire (SPMSQ) score ⬍7. People were also excluded from further partici-pation in the study if, after initial assessment, they were found to have a low falls risk (as measured by the Physiological Profile Assessment), since the aim of the trial was to test an intervention for high-risk fallers.18 Six hundred and twenty people were enrolled in the study; however, during the study year, 42 people were lost to follow-up due to ill-health, death, leaving the study area or withdrawal of consent. Thus, 578 participants aged between 75 and 98 years (mean⫽80.2; SD⫽4.4) were included for cost-of-falls analysis. Informed consent was obtained from all participants prior to participation and approval was given by the Human Studies Ethics Committee at the University of New South Wales (approval number CEPIHS 98048).
Falls definitions and data collection
Falls experienced by all participants for a period of 12 months were measured prospectively, using monthly fall calendars. Details of each fall, including the injuries sustained and consequent medical treatment, were col-lected via telephone interview. Injuries were classified using the International Classification of Diseases, Ninth Revision, Clinical Modification (ICD-9-CM). The partic-ipants returned the calendars to the research team at the end of each month and participants who did not return cal-endars were contacted via telephone.
Health-care use and cost data
Participants who experienced a fall that resulted in health-care utilisation were contacted via telephone on a weekly basis to collect information relating to ongoing medical, health-care and associated costs. This follow-up continued until the fall-related treatment had ceased (range 1–20 weeks). Information was collected on all aspects of the participants’ medical treatment, including hospital costs, outpatient services from medical practitioners and allied health professionals and the cost of pharmaceutical med-ications and diagnostic investigations. Costs obtained from subjects were total costs and did not take account of Medicare or health fund rebates. The data were collected between the years 1999 and 2002, and the costs calculated using year 2000 fees and charges.
Hospital costs were based on the Diagnosis Related Group (DRG) allocated to each specific fall-related injury, since the authors did not have access to hospital cost informa-tion directly from the source. For cases where the length of stay differed from the average length of stay for each DRG, adjustments to the average ward costs were made, i.e. cost⫽DRG figure⫻(patient length of stay/DRG
average length of stay). Estimates from the NSW Health Services Comparison Data were used to calculate missing costs.19
Patients who presented at a hospital ED and were dis-charged without admission were allocated the average cost of a visit to the ED ($238 for a principal referral hospital and $271 for a major metropolitan hospital), plus addi-tional costs for individual services such as pathology ($170 principal referral and $95 major metropolitan hos-pital) and imaging ($174 principal referral and $123 major metropolitan hospital), where relevant. These cost esti-mates were obtained from the NSW Health Services Comparison Data.19
The cost of ambulance travel in relation to a fall was also included in the analysis and an average fee for service was used ($143), which was determined through direct contact with the Ambulance Service of NSW.
Costs for services provided by medical practitioners and allied health professionals were obtained from the partici-pants. Where participants were not able to provide specific information, the standard fee-for-service was used. For medical practitioners, standard fees were obtained from the Medicare Benefits Schedule.20 For allied health pro-fessionals, the following amounts were used (obtained from the relevant representative professional organisa-tions): physiotherapy and occupational therapy, $50 initial visit, $40 subsequent visit; home nurse, $50 per hour.
The cost of fall-related pharmaceuticals was ascertained through the Schedule of Pharmaceutical Benefits.21 The cost of associated diagnostic investigations such as x-rays was obtained directly from the participant or, when this was not possible, from the Medical Benefits Schedule.20
Other out-of-pocket expenses included in the analysis were the repair of broken glasses, purchase of non-prescription analgesics, installation of safety rails in the home and purchase of bandages and other items for wound protection. The amounts for these items were obtained directly from the study participants.
Costs that were beyond the scope of the study and therefore not ascertained included indirect costs such as informal care from friends and family, transport-related costs such as taxi fares to and from medical appointments, and participant opportunity costs such as time away from work.
Statistical analysis
hospital attendance and those that resulted in medical attention without hospital attendance. The costs obtained were then adjusted to reflect year-2006 costs by multiply-ing them by the cumulative change in the Consumer Price Index (CPI) between the years 2000 and 2006.22 For this calculation, the figure used was the percentage change of the weighted average of eight Australian capital cities for each year for the CPI health group only. The data were analysed using SPSS 11.5 software.23
Results
In the 12-month study period, 48% of the study partici-pants fell one or more times. The total number of falls over this period was 538. In the follow-up year, 303 people (52%) suffered no falls, 145 (25%) suffered one fall and 130 (23%) suffered two or more falls. The proportion of men and women in each fall category was similar (χ2⫽3.39, 3 d.f., p⫽0.34).
Table 1 illustrates the number of injurious falls that occurred during the study period and the subsequent type of medical treatment that was sought. More women than men suffered an injury (χ2⫽18.14, 1 d.f., p⬍0.001) and
suffered falls that required medical treatment (χ2⫽14.29, 1 d.f., p⬍0.001).
Of the 538 falls, a total of 458 injuries occurred, including bruising with intact skin surface (39% of the injuries), sprains and strains of joints and muscles (17%) and super-ficial injuries (15%). Fractures accounted for 5% of the injuries, including two hip fractures. Women were more likely to suffer fall-related fractures than men, with 83% of the fractures occurring in women. Men had a higher rate of open wound injuries, accounting for 33% of all men’s injuries compared with 16% in women.
Table 2 presents the average, minimal, maximal, total and year-2006-adjusted costs for falls injuries that required inpatient hospital, ED and non-hospital services. The overall cost of fall-related health care for the study popu-lation in the follow-up period was $195 183. Sixty-seven percent of this cost was due to services utilised while in hospital, 3% was due to services utilised while in an ED and the remaining 30% was due to services utilised from non-hospital sources.
Hospital and non-hospital costs for fall-related injury
Table 1. The number of falls according to injury status and receipt of medical treatment in study participants between 1999 and 2002 in Sydney, NSW
Fall type Men Women Total
(nⴝ190) (%) (nⴝ348) (%) (Nⴝ538) (%)
Without injury 105 55.3 92 26.4 197 36.7
No injury but had medical check-up 2 1.0 1 0.3 3 0.6
Injury, no medical attention 56 29.5 160 46 216 40.1
Injury, medical attention, excluding hospital 22 11.6 74 21.3 96 17.8
Injury, medical attention, including hospital 5 2.6 21 6 26 4.8
Table 2. The total and adjusted cost of falls injuries that required hospital admission, treatment at an emergency department or other non-hospital services between 1999 and 2002 in Sydney, NSW
Treatment type Cost ($)
Average Minimum Maximum Total CPI adjusted total*
(year 2000) (year 2006)
Hospital admission (n⫽13)
In-hospital services# 10 003 1530 26 262 130 041 175 165
Non-hospital services 2328 11 5200 30 269 40 772
Emergency department** (n⫽13)
Emergency department services 424 147 1164 5512 7425
Non-emergency department services 756 101 2371 9828 13 238
Other non-hospital services (n⫽96) 203 10 1759 19 533 26 311
Total for all services 195 183 262 912
#Average length of stay of 19.5 days (range 1–49 days).
*Year 2000 cost multiplied by the cumulative change in the Consumer Price Index (CPI) between the years 2000 and 2006.22
164 | Vol. 19(9–10) 2008 NSW Public Health Bulletin
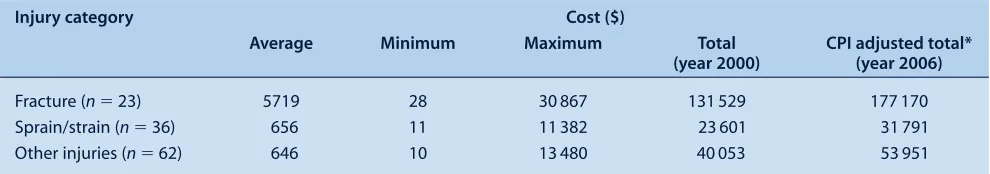
The cost of falls for the major injury categories: fractures, sprains and strains, and other injuries are summarised in Table 3. Fractures were the injury type that incurred the greatest medical costs, with the highest overall individual cost of $30 867 being for a hip fracture. Fractures com-prised 5% of all the injuries suffered, yet accounted for 67% of the total cost of fall-related injury.
Discussion
In the 12-month study period, 48% of the participants fell one or more times, a rate that would be anticipated for a sample aged 75 years and over, which had excluded people with a low risk of falling.2,3The proportion of falls that resulted in injuries (63%) and injuries requiring medical care (23%) are also consistent with previous research assessing similar populations.2
The total cost of fall-related treatment was $195 183, which equates to a total of $262 912 using year-2006-adjusted figures. This translates to an average cost of $1600 per person for the 122 participants who sustained falls requir-ing medical care in the study period. This figure is lower than the average costs reported in Australian studies by Potter-Forbes and Aisbett ($5688), Hall and Hendrie ($4291) and Hendrie et al. ($4619).13,15,16The lower cost is most likely due to a greater capture of people who had minor injuries that required treatment only from a medical practitioner or allied health worker: $1600 is therefore likely to represent a more accurate estimate of all injurious falls suffered by older people in community. When the analyses were restricted to participants attending the ED (and possible subsequent hospital admission), the average cost was $6756. This figure is more comparable to the pre-vious studies that used indirect means for estimating non-hospital care or recruited their study population from ED attendees only.13,15,16
Only 4% of the falls that resulted in injuries led to admis-sion to hospital. Despite this, hospital costs accounted for 67% of the total cost of injury-related health care. This figure is midway between the findings of Hendrie et al. (53%), Potter-Forbes and Aisbett (55%) and Hall and Hendrie (80%).13,15,16Again, when only those requiring
ED and hospital care were considered, hospital costs accounted for a similar percentage of total costs (74%) as reported by Hall and Hendrie.15 These findings confirm that a small minority of falls that result in serious injury are responsible for the bulk of health care costs for this injury mechanism.
The major strengths of the current study were that it was comparatively large, population based and used individual rather than aggregated data. Also, associated costs data were collected prospectively with a rigorous protocol of follow-up interviews until health care utilisation had ceased. This approach is optimal for maximising the recording of all falls and for calculating non-hospital costs, as routine data collection is not undertaken.24The findings indicated that non-hospital costs were substantial and accounted for 19% of the costs of falls that required admission to hospital and 64% of the costs of falls requir-ing treatment from an ED. The overall proportion of costs attributed to non-hospital services for all falls was 30%. These findings, therefore, complement the research undertaken using aggregated data by providing accurate estimates of costs of all sources of health care.
The study also has a number of limitations. Participants were recruited from a private health insurance database and only those classified as ‘high risk fallers’ were included, so the study population may not be representa-tive of the older population as a whole. It is possible that this could skew the degree and modality of treatment sought for falls injuries. Nevertheless, the findings are similar to recent Australian studies that have assessed costs in general community populations.13,15,16A further limitation is that indirect costs were not ascertained. Previous research has shown indirect costs to be quite sub-stantial in relation to fall injury, so the figures from this study do not provide the total extent of the economic burden of falls injuries.13
In conclusion, this study provides detailed cost estimates of hospital and non-hospital treatment for fall-related injuries suffered by community-dwelling older people who were at an increased risk of falls. The inclusion of Table 3. The total and adjusted cost of falls in study participants according to major injury categories between 1999
and 2002 in Sydney, NSW
Injury category Cost ($)
Average Minimum Maximum Total CPI adjusted total*
(year 2000) (year 2006)
Fracture (n⫽23) 5719 28 30 867 131 529 177 170
Sprain/strain (n⫽36) 656 11 11 382 23 601 31 791
Other injuries (n⫽62) 646 10 13 480 40 053 53 951
treatment from non-hospital services provides a broader estimate of the cost of fall-related injury compared with previous Australian studies. This information may assist health-care planners to guide the allocation of funding priorities and provide estimates of falls-injury treatment categories for use in cost-effectiveness studies of falls pre-vention strategies.
Acknowledgments
The National Health and Medical Research Council (POPI Partnership in Injury and Project Grants), and the Medical Benefits Fund of Australia supported this study.
References
1. Baker SP, Harvey AH. Fall injuries in the elderly. Clin Geriatr
Med 1985; 1: 501–12.
2. Tinetti ME, Doucette EJ, Claus E, Maratolli R. Risk factors for serious injury during falls by older persons in the community.
J Am Geriatr Soc 1995; 43: 1214–21.
3. Speechley M, Tinetti M. Falls and injuries in frail and vigorous community elderly persons. J Am Geriatr Soc 1991; 39: 46–52.
4. Lord SR. Falls in the elderly: admissions, bed use, outcome and projections. Med J Aust 1990; 153: 117–8.
5. Tinetti M, Williams C. Falls, injuries due to falls and the risk of admission to a nursing home. N Engl J Med 1997; 337: 1279–84. doi:10.1056/NEJM199710303371806
6. Reinsch S, MacRea P, Lachenbruch PA, Tobis JS. Attempts to prevent falls and injury: a prospective community study.
Gerontologist 1992; 32: 450–6.
7. Sjogren H, Bjornstig U. Unintentional injuries among elderly people: incidence, causes, severity, and costs. Accid Anal Prev 1989; 21: 233–42. doi:10.1016/0001-4575(89)90014-6
8. Alexander BH, Rivara FP, Wolf ME. The cost and frequency of hospitalization for fall-related injuries in older adults. Am J
Public Health 1992; 82: 1020–3.
9. Covington DL, Maxwell JG, Clancy TV. Hospital resources used to treat the injured elderly at North Carolina trauma centers. J Am Geriatr Soc 1993; 41: 847–52.
10. Carroll NV, Slattum P, Cox F. The cost of falls among the community-dwelling elderly. J Manag Care Pharm 2005; 11: 307–16.
11. Findorff M, Wyman J, Nyman J, Croghan C. Measuring the direct healthcare costs of fall injury event. Nurs Res 2007; 56: 283–7. doi:10.1097/01.NNR.0000280613.90694.b2
12. Scuffham P, Chaplin S, Legood R. Incidence and costs of unintentional falls in older people in the United Kingdom.
J Epidemiol Community Health 2003; 57: 740–4.
doi:10.1136/jech.57.9.740
13. Potter-Forbes M, Aisbett C. Injury costs: A valuation of the burden of injury in New South Wales in 1998–1999. Sydney: NSW Injury Risk Management Research Centre, University of New South Wales; 2003.
14. Moller J. Projected costs of fall related injury to older persons due to demographic change in Australia. Canberra:
Commonwealth Department of Health and Ageing; 2003.
15. Hall SE, Hendrie DV. A prospective study of the costs of falls in older adults living in the community. Aust N Z J Public
Health 2003; 27: 343–51.
doi:10.1111/j.1467-842X.2003.tb00405.x
16. Hendrie D, Hall SE, Arena G, Legge M. Health system costs of falls of older adults in Western Australia. Aust Health Rev 2004; 28: 363–73.
17. Lord SR, Tiedemann A, Chapman K, Munro B, Murray SM, Sherrington C. The effect of an individualized fall prevention program on fall risk and falls in older people: a randomised, controlled trial. J Am Geriatr Soc 2005; 53: 1296–304. doi:10.1111/j.1532-5415.2005.53425.x
18. Lord SR, Menz HB, Tiedemann A. A physiological profile approach to falls risk assessment and prevention. Phys Ther 2003; 83: 237–52.
19. NSW Department of Health. NSW Health Services
Comparison Data 1999–2000. Volume 2 Case-mix Measures. Sydney: NSW Department of Health; 2003. Available from URL: http://www.health.nsw.gov.au/pubs/2003/pdf/ yellowbook_vol2_99-00.pdf (Cited 26 October 2005.)
20. Australian Government Department of Health and Ageing Medicare Benefits Schedule. 1 November 2000. Canberra: Commonwealth Department of Health and Ageing.
21. Schedule of Pharmaceutical Benefits, August 2000. Canberra: Commonwealth Department of Health and Ageing.
22. Australian Bureau of Statistics. Consumer Price Index. Canberra: Australian Bureau of Statistics; 2008. Available from: http://www.abs.gov.au/AUSSTATS/[email protected]/
second⫹level⫹view?ReadForm&prodno⫽6401.0&viewtitle= Consumer%20Price%20Index,%20Australia~Sep%202008~ Latest~22/10/2008&&tabname⫽Past%20Future%20Issues& prodno⫽6401.0&issue⫽Sep%202008&num⫽&view⫽& (Cited 3 November 2008.)
23. SPSS Inc. SPSS for Windows release 11.5.0. SPSS Inc: Chicago; 2002.
24. Cummings SR, Nevitt MC, Kidd S. Forgetting falls: the limited accuracy of recall of falls in the elderly. J Am Geriatr
Soc 1988; 36: 613–6.
166 | Vol. 19(9–10) 2008 NSW Public Health Bulletin
Injuries resulting from falls, particularly hip fractures, are a major public health issue and will become more so with the ageing of the population. Of all falls resulting in hip frac-ture, about 35% occur in residents of aged-care residential facilities.1,2Each year, the John Hunter Hospital, the major tertiary referral hospital for what was previously the Hunter Area Health Service, admits around 400 patients aged 65 years and over with a fractured neck of femur (R Gibberd, personal communication, February 2006). Our experience suggests that around one-third of these patients are admitted from residential care facilities. One-third of this group comes from hostels and utilises about 4500 bed-days, while the two-thirds that come from nursing homes have much shorter stays and use about 1500 bed-days (Kichu Nair, personal communication, April 2007).
On this basis, we calculate that, at a cost of $500 per bed-day, hip fractures from aged-care facilities in the former Hunter Area Health Service could cost around $3 000 000
Incidence of falls and fall-related outcomes
among people in aged-care facilities
in the Lower Hunter region, NSW
Abstract: This article describes the rate of falls
and adverse outcomes following falls, such as frac-ture, hospitalisation and death, among residents of 88 aged-care facilities in the Lower Hunter region of NSW from July to December 2005. A high rate of falls was observed with a crude incidence of 171 falls per 1000 beds per month. Around 40% of the falls resulting in hospitalisation were for fractured neck of femur. Estimated 3-month survival follow-ing fractured neck of femur was low, with a rate ratio of around 1 : 3. The data indicate an urgent need for falls injury prevention in aged-care facilities.
Richard E. Gibson
A,B,C, Mandy Harden
B,
Julie Byles
Aand John Ward
BAResearch Centre for Gender Health and Ageing, Faculty of Health, University of Newcastle BHunter New England Area Health Service
CCorresponding author. Email: [email protected]
each year. The potential savings from the prevention of hip fractures are large in terms of health care resources and cost. Moreover, the incidence of falls can be up to three times higher among residents of aged-care facilities com-pared to the local community, with rates in aged-care facil-ities being reported as 1.4 falls per person per year, rising to 6.2 falls per person per year in a psychogeriatric ward.3 In an Australian study, 625 residents of hostels and nursing homes in three states were followed for two years. Over that period, 1555 falls were reported among 355 of these residents.4
The aim of this study was to describe reports of falls and fall-related outcomes among people in residential aged-care facilities in the Lower Hunter region of New South Wales (NSW).
Methods
All aged-care facilities in the former Hunter Area Health Service and the Lower Mid North Coast Cluster of the Hunter New England Area Health Service were invited to participate in this study. Facilities with 20 or more beds were included (facilities with less than 20 beds were con-sidered to be atypical). In June 2005, each facility pro-vided data on the number of beds by type. All beds were assumed to be occupied and the number of beds, assumed to be fixed, was used to determine the denominator in the analyses. An index of the turnover of individuals within this fixed size population was obtained from monthly data on the number of new permanent and respite admissions. Further, the characteristics of participating facilities were determined at a census in January 2006. In this census, each facility provided details of all permanent residents, including their date of birth, sex, whether they were ambu-lant or not, whether they were residing in a dementia-specific unit or not and resident classification scale (RCS). Each new resident was assigned to one of eight RCS cate-gories designed to reflect their level of need.
Using a standard form, each facility provided monthly aggregate data describing the number of falls (not the number of residents who experienced a fall, as each resi-dent could register multiple falls) and the number of falls reported in residents’ charts that resulted in adverse events such as fracture, hospitalisation or death. Each facility designated a senior staff member to supervise the project
Incidence of falls and fall-related outcomes
within their facility and to collect the monthly data. The staff member audited residents’ charts to identify ‘incident records’, which report details of fall incidents including date, time, injury, immediate treatment and medical treat-ment by facility staff. Cumulative data from the monthly falls reports showed the total number of reported falls for that month as well as: the number of falls resulting in frac-ture; fractured neck of femur; fractured neck of femur within three months of admission; hospitalisation due to a fall-related injury; and the number of deaths occurring within three months of fractured neck of femur. Where a facility failed to provide a monthly falls report, the desig-nated staff member was sent a second form by email or fax then followed up by telephone.
Not all facilities returned forms every month. The rate of falls and related events occurring each month was deter-mined by dividing the number of events by the total number of beds for all facilities that had returned forms for that month. The total number of beds for each month was summed to provide the overall denominator as bed-months of observation.
Results
In total, 98 facilities were identified in the Lower Hunter region. Of these, six were ineligible due to small size, four declined to participate in the study and 88 consented to participate (consent rate of approximately 96% if ineligi-ble facilities are excluded). Characteristics of the facilities are shown in Table 1 and characteristics of the residents are shown in Table 2.
The median and mean number of new permanent admis-sions each month at each facility was 2 and 2.3 (range: 0–28), and the median and mean number of new respite admissions each month at each facility was 2 (range: 0–10).
Falls data forms were collected and collated for the period July to December 2005. Over this 6-month period, forms were returned by 75–93% of facilities each month, with an
overall return rate for the period of 84%. There was no sys-tematic bias in returns according to type of facility. The total bed-months of observation was 28 536.
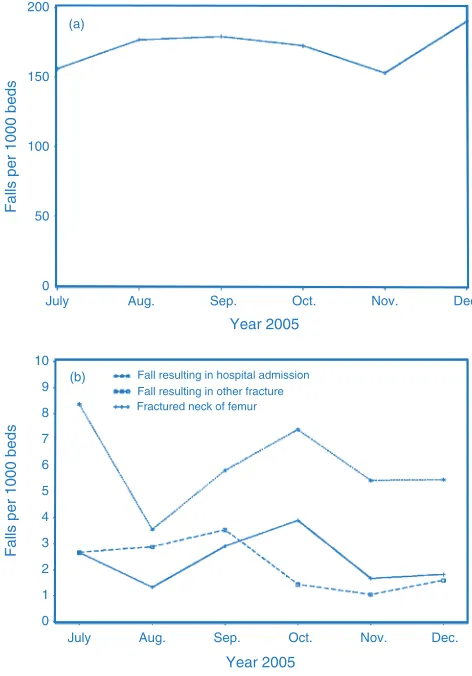
The trend in the rate of falls and related events for every 1000 beds is shown in Figure 1. The overall crude inci-dence rate was 171 falls: 2.4 falls with fractured neck of femur; and 2.2 falls with other fracture injury for every 1000 bed-months of observation. The crude overall inci-dence rate for hospitalisation from a fall was 6 per 1000 bed-months of observation.
The outcomes of the falls are shown in Table 3 where rates are expressed for every 1000 falls. Overall, 3.6% of falls required hospital admission, 1.4% of falls resulted in a fractured neck of femur and a similar proportion resulted in other fracture. For every 14 fractured neck of femur events, 1.8 occurred within the first three months follow-ing admission (13%); that is, a rate ratio of 1.8 : 14. The rate of death within three months of a fractured neck of femur was 35% of the rate of falls with fractured neck of femur – that is, a rate ratio of around 1 : 3 – indicating a high mor-tality rate among residents experiencing fractured hip.
Discussion
These data were collected before an intervention for falls prevention in aged-care facilities was implemented at the
Table 1. Distribution and characteristics for low-care, high-care and mixed-care beds in participating resident aged-care facilities in the Lower Hunter region of NSW, 2005–2006
Type of Facilities Median Median number Median Median number Median number Median
care n number dementia number new admissions respite admissions RCS**
general beds⫹ specific beds⫹ all beds⫹ per month* per month*
n Range n Range n Range n Range n Range n Range
Low care 42 40 0–78 0 0–65 40 25–132 1 0–28 2 0–9 5 1–8
High care 24 60 28–136 0 0–96 65 28–216 3 0–12 0 0–9 2 1–7
Mixed (low 22 68 37–130 10 0–46 8 44–160 2 0–17 2 0–10 3 1–8
and high)
⫹Data obtained June 2005.
*Data obtained from monthly reports from facilities. **Data obtained from a census of residents in January 2006. RCS: Resident Classification Scale.
Table 2. Characteristics of the residents in 88 aged-care facilities in the Lower Hunter region of NSW at the time of the census, January 2006 (Nⴝ5354)
Age in years: median (range) 85 (27–107)
Female (%) 73
Ambulant* (%) 70
Dementia-specific care (%) 21
168 | Vol. 19(9–10) 2008 NSW Public Health Bulletin
beginning of 2006. The data were aggregated in facilities and so are not age specific and include a wide age range. Additionally, the data were reported by the facilities and accuracy, therefore depends on procedures and protocols
for incident reporting at each facility. The true number of falls may be higher or lower than reported.
We assumed that bed numbers remained fixed and that all beds were occupied for the duration of the study. While the assumption of full beds is reasonable, some facilities increased bed numbers during the period, possibly result-ing in an overestimation of rates per 1000 beds. Similarly, if falls were underreported in these data then the denomi -nator for rates per 1000 falls should be larger and the rates may have been overestimated. Furthermore, we observed a decrease in the response rate over time and there was possible under-reporting by facilities where no falls occurred in a month (or by facilities with many falls). Under-reporting would bias both the denominator and the numerator. In contrast, we experienced a high rate of facil-ity enrolment in the study and participation was generally strong (given the limitations of time and resources experi-enced by these facilities).
Given these limitations, the data demonstrated a rate of 171 falls for every 1000 beds for each month. Extrapolating across a 12-month period, this is equivalent to two falls per bed for every year. This is higher than would be expected in the community; for example, Mackenzie et al. reported a rate of 47 per 1000 people each month.4,5The rate of falls observed here in residential settings are comparable to an Australian study by Flicker et al., where a crude rate of 155 per 1000 people every month was observed (calculated from data provided).6 In addition, a Scandinavian study found a much higher rate of 357 per 1000 person-months among residents with dementia compared with residents of senior citizens apartments (142 per 1000 person-months) and residents of an old people’s home (176 per 1000 person-months).7Around 3.6% of falls reported in our study resulted in hospital admission. Among those admitted to Fall resulting in hospital admission
Fall resulting in other fracture Fractured neck of femur
July Aug. Sep. Oct. Nov. Dec.
July Aug. Sep. Oct. Nov. Dec. 10
9
8
7
6
5
4
3
2
1
0 200
150
100
50
0
Year 2005
Year 2005
Falls per 1000 beds
Falls per 1000 beds
(a)
(b)
Figure 1. Falls per 1000 beds among residents of aged-care facilities in the Lower Hunter region of NSW for the period July 2005 to December 2005. (a) Rate of total falls. (b) Rate of falls resulting in hospital admission, fractured neck of femur and other fracture.
Table 3. Monthly total number of beds and falls in residential care facilities and rate of falls outcomes per 1000 falls for July–December 2005 in the Lower Hunter region of NSW
Month Beds Falls Outcomes per 1000 falls Returns received
N N Hospital Fractured Other Fractured neck Deaths within from facilities admission neck of fracture of femur within 3 months of contributing data
femur 3 months of fractured neck n %
admission of femur to facility
July 5288 830 53 17 17 3.6 3.6 82 93
August 4491 807 21 7.4 17 1.2 6.2 72 82
September 4822 863 32 16 20 1.2 5.8 74 84
October 4898 840 43 23 8.3 1.2 4.8 74 84
November 4786 731 36 11 6.8 0.0 2.7 74 84
December 4251 799 29 10 7.5 3.8 6.3 66 75
Totals 28 536 4870 – – – – – 442 84
Overall – – 36 14 13 1.8 4.9
Incidence of falls and fall-related outcomes
hospital, around 40% were reported to have a fractured neck of femur, and we observed a high rate of death within three months of fracture. Moreover, we observed that on average over the six months, an estimated 13% of falls that resulted in a fractured neck of femur occurred within three months of admission.
The data revealed a rate of falls among residents of aged-care facilities that can be improved. We intend to work with facilities involved in the study to improve monthly reporting of falls and falls injuries. Additionally, we have enrolled a cohort of around 5000 residents in participating facilities and will be able to observe falls resulting in a fractured neck of femur at an individual level. Cross-checking patient information data for admissions with a fractured neck of femur will allow more accurate reporting of this injury in our routine data collection activities.
The results of this preliminary ecological study indicate a need for falls injury prevention in residential aged-care facilities.
Acknowledgments
Funding for data collection was provided by NSW Health and is part of a Health Promotion Demonstration Project. This paper is pre-pared by the authors on behalf of the research team. Researchers in the Faculty of Health at the University of Newcastle and in the Hunter New England Area Health Service are members of the Hunter Medical Research Institute.
References
1. Fisher AA, Davis MW, Smith PN. Undertreatment of osteo-porosis following hip fracture. J Bone Joint Surg Am 2003; 85-A(7): 1394–5.
2. Fisher AA, Davis MW, McLean AJ, Le Coutteur DG. Epidemiology of falls in elderly semi-independent residents in residential care. Australas J Ageing 2005; 24(2): 98–102. doi:10.1111/j.1741-6612.2005.00081.x
3. Cameron I, Murray GR, Gillespie LD, Cumming RG, Robertson MC, Hill K, Kerse N. Interventions for preventing falls in older people in residential care facilities and hospitals (Protocol). Cochrane Database of Systematic Reviews 2005; 3: CD005465.
4. Hill K, Vrantisidis F, Haralambous B, Fearn M, Smith R, Murray K et al. An analysis of research on preventing falls and falls injury in older people: Community, residential care and hospital settings (2004 update). Report to the Australian Government, Department of Health and Ageing, Injury Prevention Section by the National Ageing Research Institute. Canberra: Commonwealth of Australia; 2004. Available at: http://www.health.gov.au/internet/main/publishing.nsf/Content/ health-pubhlth-publicat-document-falls_community-cnt.htm (Cited 30 October 2008.)
5. Mackenzie L, Byles J, D’Este C. Validation of self-reported fall events in intervention studies. Clin Rehabil 2006; 20(4): 331–9. doi:10.1191/0269215506cr947oa
6. Flicker L, MacInnes RJ, Stein MS, Scherer SC, Mead KE, Nowson CA et al. Should older people in residential care receive vitamin D to prevent falls? Results of a randomized trial. J Am Geriatr Soc 2005; 53: 1881–8. doi:10.1111/ j.1532-5415.2005.00468.x
7. Jenson J, Lundin-Ollson L, Nyberg L, Gustafson Y. Falls among frail older people in residential care. Scand J Public
170 | Vol. 19(9–10) 2008 NSW Public Health Bulletin Background and risk identification
Sampleton (not the real name) is a small country town in rural New South Wales (NSW). Until 2001, the inhabitants of the town had been supplied with drinking water sourced from a local surface water catchment. In 2002, the drought prompted the local authority to negotiate with a local col-liery to release its extracted underground mining water into the local drinking water catchment. The local government
Environmental health risk assessment of nickel
contamination of drinking water in a country
town in NSW
Abstract: Objectives: To assess the health risks
associated with consumption of drinking water with elevated nickel concentration in a NSW country town named Sampleton. Methods: We used enHealth Guidelines (2002) as our risk assess-ment tool. Laboratory test results for nickel in water samples were compared with the Australian Drinking Water Guidelines 2004 and the World Health Organization’s (WHO) Guidelines for Drinking Water Quality 2005. Results: The mean nickel concentration in the drinking water samples tested over a 4-year period (2002–2005) was 0.03 mg/L (95% CI: 0.02–0.04). The average daily consumption of two litres of water by a 70-kg adult provided 0.06 mg (0.03 mg⫻2) of nickel, which was only 7% of the lowest observed adverse effect level (LOAEL) based on experiments on nickel-sensitive people in a fasting state. Conclusions: The mean nickel concentration in drinking water appears to have no health risks for the inhabitants of Sampleton.
Noore Alam
A,B,C, Stephen J. Corbett
Aand Helen C. Ptolemy
AACentre for Population Health, Sydney West Area Health Service BNational Centre for Epidemiology and Population Health (NCEPH), Australian National University
CCorresponding author. Email: noore.alam@ cancerinstitute.org.au
authority (LGA) treated the water before supplying it as drinking water to its residents.
Between 2002 and 2005, the water samples at Sampleton recorded on the NSW Health Drinking Water Database intermittently exceeded the Australian Drinking Water Guidelines (ADWG) value for nickel of 0.02 mg/L.1,2The aim of this risk assessment was to assess the potential health risks associated with the consumption of drinking water with an elevated nickel concentration.
Risk assessment methodology
We used the enHealth Guidelines for Assessing Human Health Risks from Environmental Hazards (2002) as the risk assessment tool.3The ADWG and the WHO guidelines for nickel were used for the specific guidelines on nickel levels in drinking water.2,4 Chemical analysis of water samples were undertaken by a laboratory accredited by the National Association of Testing Authorities (NATA).5 Laboratory test results for nickel in the water samples were compared with the ADWG and the WHO guidelines.
Hazard assessment
Hazard identification
Ground water can contain dissolved metals including nickel (Ni) and chemicals naturally released from rock and soil, which can be harmful to humans.6 The estimated average daily dietary intake of nickel is between 0.1 mg/day and 0.3 mg/day.7,8The intake of nickel from food is estimated to be less than 0.2 mg/day. Drinking water generally contributes 5–25µg of nickel per day, which is approximately 2–11% of the total daily oral intake of nickel.4In Australia, the concentration of nickel in typical drinking water is less than 0.01 mg/L with the highest allowable value of 0.02 mg/L.9
Non-occupational sources of nickel exposure include food, air and water, but the amount of nickel found is usually much smaller than that typically found in occupa-tiona