A b s t r a c t. Short crack behaviour during the two-dimen-sional cutting of brittle agricultural soils is a non-symmetrical mixed mode crack loading problem. The inability to resolve this problem limited the brittle fracture soil cutting theory developed earlier by Aluko and Chandler (2004). In this paper, finite element modelling was used to simulate the loading of a brittle soil, in which a horizontally propagating crack had been initiated, by a two-dimensional plane cutting blade. Using a finite element subroutine, solutions were obtained for the separate values of the modulus (K), mode I (KI) and mode II (KII) stress intensity factors for both short and long crack regimes.
Further analysis of the stress intensity factor curves led to two possible interpretations for estimating peak soil cutting forces: the energycriterion and thedirect mode Icriterion. Using both criteria, brittle fracture force predictions were carried out for polished plane cutting blades in a sandy loam and a clay loam soil. Theenergy criterion was found to under-predict soil cutting forces when compared with published experimentally measured forces on these soils. However, the directmode Icriterion gave reasonable force estimates compared to measured values over a limited range of low rake angles. In conjunction with the passive pressure theory, the brittle fracture model can be used to predict the expected soil failure mechanism in a given situation by applying the minimal energy criterion in the comparison of forces predicted by both theories.
K e y w o r d s: soil fracture, crack growth, finite element method, blade configuration, soil cutting forces
INTRODUCTION
The mechanism of brittle fracture, which sometimes occurs during soil cutting and tillage operations, is not yet fully understood. Previous work by Aluko and Seig (2000) showed that the fracture of brittle agricultural soils during two-dimensional cutting operations is principally an elastic problem. Aluko and Chandler (2004) subsequently
develo-ped a model for brittle fracture during two-dimensional soil cutting, using methods of fracture mechanics for elasticbrit-tle materials. The estimation of maximum cutting forceswith the use of the model was, however, limited because of inabili-ty to deduce short crack behaviour under mixed mode loading.
The finite element method (FEM) has been used as an ap-proximate numerical solution procedure for solving many kinds of linear and non-linear continuum mechanics problems. In particular, in soil mechanics research work, it has been pointed out (Coleman and Perumpral, 1974) that the method is capable of providing information which is difficult or sometimes impossible to obtain experimentally; and in the present work, by the previous theoretical approach (Aluko and Chandler, 2004; Coleman and Perumpral, 1974; Perumpralet al., 1971; Raper and Erbach, 1990, and Yong and Fattah, 1976) have applied the FEM to the study of soil compaction and the associated deformation and stress distri-bution patterns within a soil under the influence of a tractor wheel or other compaction device. Yong and Hanna (1977) modelled soil cutting by simple plane (two-dimensional) blades using the FEM. Liu Yan and Hou Zhi-Min (1985) and Chi and Kushwaha (1987, 1989) applied the FEM to the study of three-dimensional soil cutting with narrow blades. Using finite element modelling, Fielke (1999) studied the effect of different tillage tool cutting edge geometries on the defor-mation, forces and soil movement around the cutting edge. In the foregoing applications of the FEM, soil mechani-cal behaviour was modelled based on the classimechani-cal Mohr-Coulomb theory of shear failure. In general, this approach is appropriate for processes where deformation (or plasticity effects) is significant. Examples of such processes include wheel-soil interaction, triaxial testing and mole ploughing.
Finite element aided brittle fracture force estimation during two-dimensional
soil cutting
O.B. Aluko
Department of Agricultural Engineering, Obafemi Awolowo University, Ile-Ife, Nigeria
Received August 6, 2007; accepted December 19, 2007
© 2008 Institute of Agrophysics, Polish Academy of Sciences
Corresponding author’s e-mail: [email protected]
A
A
It is also appropriate in the analysis of soil cutting problems where shear failure with significant plastic deformation occurs. However, it has been shown (Aluko and Seig, 2000; Aluko and Chandler, 2004) that when brittle fracture occurs in soil cutting, soil mechanical behaviour can be macro-scopically considered to be elastic-brittle.
To resolve the limitation (pointed out above) of the brittle fracture soil cutting model developed by Aluko and Chandler (2004), this study was carried out to deduce short crack behaviour under mixed mode loading using the FEM and to predict brittle fracture forces during two-dimensional soil cutting.
BRITTLE FRACTURE SOIL CUTTING THEORY
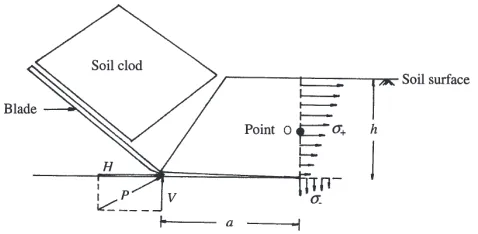
For an ideally horizontally propagating crack in a brittle agricultural soil (Fig. 1), Aluko and Chandler (2004) showed that the fracture process leading to clod formation comprises two regimes of crack growth/development, termed theshort andlongcrack regimes. During the initial stages of crack growth in the short crack regime, the relationship between the developing crack and the applied cutting force is given by (Aluko and Chandler, 2004):
K H
a V
H
I (p )
p p
2 4 1 2
4 2 -é ë ê ê ù û ú
ú = - , (1)
where:KIis the applied stress intensity factor (N m-3/2), VandHare the vertical and horizontal components, respec-tively, of the cutting forcePin N exerted on the soil by the blade (Fig. 1), andais the crack length (m). With further development, crack behaviour changes from short to long. The model for long crack behaviour (Aluko and Chandler, 2004) is: K h H V H V H a h I
0.541 1.68 1.92
1 2
=- + æèç ö
ø
÷+ æèç ö
ø ÷æ
è ç ö
ø
÷, (2)
wherehis the height (m) of the encastré soil beam above the developing crack.
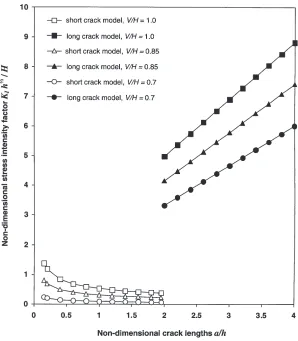
The pattern of applied stress intensity factors for both short and long crack models is illustrated in Fig. 2 for diffe-rent values ofV/Hbetween 1 and 2/ð. Aluko and Chandler (2004) attributed the apparent incompatibility between the two models (Fig. 2) to the difference in their modes of crack loading. Whereas the derivation of the short crack model was based on conditions of symmetrical single mode crack loading, that of the long crack model was based on non-symmetrical mixed mode crack loading. As pointed out earlier, this paper reports the use of the finite element me-thod to deduce short crack behaviour during the two-dimen-sional cutting of brittle agricultural soils, which constitutes a non-symmetrical mixed mode crack loading problem.
FINITE ELEMENT MODELLING
To deduce short crack behaviour during two-dimensio-nal soil cutting, finite element modelling was used to simula-te the loading of a brittle soil, in which a horizontally propa-gating crack had been initiated, by a two-dimensional plane cutting blade. The study was carried out using subroutines from a finite element modelling software (Henshell, 1984). As pointed out by Fielke (1999), in the application of finite element modelling it is assumed that the material, in this case soil, consists of discrete connected elements with assigned material properties on which displacement and force constraintsare applied.
Geometric boundary conditions
In the present application of the finite element method, the geometrical configuration and boundary conditions were chosen to simulate the actual experimental soil and blade conditions previously reported by Aluko and Seig (2000). Figure 3 shows the finite element idealization of the blade-soil system. The system consisted of an inclined plane (two-dimensional) blade cutting through a soil continuum having a height of 163 mm and a width of 700 mm. Blade working depthhwas kept constant at 70 mm below the soil surface while different blade rake angles within the range 25-90° were investigated. The soil surface was assumed to be horizontal and stress free, and blade motion was assumed to be horizontal. At a sufficiently large horizontal distance from the blade tip (x= 10h), the front side boundary was chosen so that there was no displacement of soil elements in thex-direction. The same obtained for the rear side boundary below the developing crack. It was also assumed that at a reasonable depth below the crack line (y= 1.3h), vertical movements of soil elements were vanishingly small at the bottom boundary of the soil continuum.
Fig. 2.Typical stress intensity factor curves for short and long crack models:KI– applied stress intensity factor,h– height of encastré soil beam above crack tip,a– crack length,H– horizontal component of cutting forcePexerted by the blade,V– vertical component of cutting forcePexerted by the blade (Aluko and Chandler, 2004).
Discretization and element specification
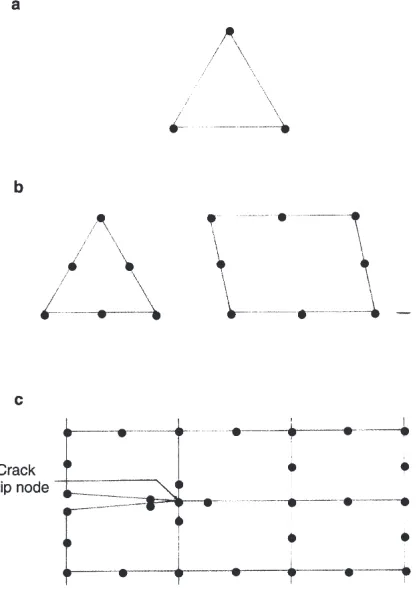
The overall discretization of the soil continuum is shown in Fig. 3. Deformations and strains were accounted for by the use of isoparametric elements in preference to linear con-stant strain triangular elements.The latter have often been used in previous applications for the finite element meshes except at points of slip and failure. Figures 4a and 4b show a ty-pical linear constant strain triangular element and isopara-metric elements, respectively. The advantages of the iso-parametric element over the linear constant strain triangular element are two-fold:
1. The element uses a polynomial interpolation for the displacements over the element whereas a linear inter-polation is carried out for the linear constant strain triangular element. Whilst the element sides in the latter always remain straight, the former accommodates reasonable distortions from the straight-sided configuration and element sides can be curved. This makes the isoparametric element concept very powerful. In the analysis of a body with curved boun-daries or where geometric non-linearity may occur due to deformation, the use of a large number of straight-sided constant strain triangular elements can be avoided by using isoparametric elements. Better accuracy of results is also generally obtained.
2. Isoparametric distortion makes this element very suitable for the modelling of singularities in the region of a crack tip. This is achieved by moving the mid-side nodes of element sides adjacent to the crack tip, from their usual position at the centre of each side to14the element side from the crack tip node. The procedure is illustrated in Fig. 4c. Crack tip stress intensity factors can be accurately determi-ned using this procedure. The mathematical justification for this procedure can be found in Zienkewicz (1971) and Henshell (1984).
Figure 5 depicts the crack tip region of Fig. 3 enlarged. Although the nodes are not shown, the triangular elements that were used to model soil in the immediate vicinity of the crack tip in Fig. 5 were six-noded isoparametric elements of the type shown in Fig. 4b. This was in accordance with the requirements for crack tip modelling of the finite element software used. Eight-noded quadrilateral isoparametric ele-ments were used elsewhere within the finite element mesh.
Soil properties
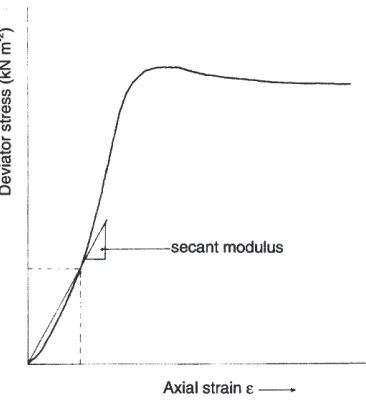
The input soil properties for the present analysis are the Young’s modulus,E, the Poisson’s ratio,n,and the density of the soil. These properties are summarised in Table 1 and were considered to be constant. The Young’s modulus was determined from stress-strain curves obtained from triaxial test data on soil samples tested at zero confining pressure or uniaxial compression (s2=s3= 0). The secant modulus at1
3 peak stress was taken as the value of Young’s modulus, E (Bofinger, 1970). A typical illustration of the secant modu-lus is shown in Fig. 6. The values of soil dry density used in the present analysis corresponded with those of the experimen-tal soils previously reported by Aluko and Seig (2000).
Fig. 4.Element types and crack tip modelling: a – three-noded linear constant strain triangular element, b – six and eight-noded isoparametric elements, and c – isoparametric distortion for crack tip singularity.
Fig. 5. Element specification, modelling and loading of the crack tip region of Fig. 3 (enlarged).
Soil property Sandy loam Clay loam
Density (Mg m-3) 1.33 1.40
Young’s modulus (MN m-2) 5.521 5.797
Poisson’s ratio 0.3 0.3
Values of Poisson’s ratio within the range of 0.25-0.49 have been used by research workers in soil and rock mechanics studies, the lower part of the range being used for more brittle samples whilst the upper part is used for more ductile samples where significant deformations occur. Young’s and Hanna (1977) used a value of 0.49, Coleman and Perumpral (1974) used a value of 0.4, and Seig (1985) used a value of 0.25. It has been posited that a Poisson’s ratio value of 0.3 is typical for dense top soils (Anonymous, 1990; Fielke, 1999). However, preliminary investigations by Aluko (1988), using different values of Poisson’s ratio within the range 0.25-0.49, showed that within this range no significant effect was observed on the values of the applied stress intensity factors obtained. The Poisson’s ratio used in the present analysis was therefore kept constant at a value of 0.3.
Load boundary conditions and analytic procedure
Although the cutting force in shear failure results from the continuous development of passive pressures on the surface of the cutting blade, it has been shown (Aluko and Chandler, 2004; Aluko and Seig, 2000) that in brittle fractu-re the cutting force is cyclic in natufractu-re and is essentially concentrated in the region of the blade tip. The brittle fracture cutting force can be resolved into its horizontal and vertical components. In the present finite element analysis, the applied load at the tip of the cutting blade is simulated by specifying constant horizontal and vertical loads on the corner node of the developing crack as shown in Fig. 5. This provides the load boundary conditions. For a particular blade configuration iea constant load ratioV/H) the ana-lysis proceeds by allowing the crack length to increase by specified constant small increments for each subsequent finite element run. The analytical procedure is illustrated schematically in Fig. 7.
Preliminary analysis and validation of the procedure
Consider Fig. 5. Following the analytical procedure described above and illustrated in Fig. 7, for each crack length the displacements dx anddy in the horizontal and vertical directions, respectively, of the edge node were ob-tained from the output results of each finite element run. The strain energySwas then determined from the relationship:
(
)
S=1 Hdx + Vdy 2
1
2( ) , (3)
The energy release rate G could then be determined from:
G=dS da/ , (4)
Fig. 6.Schematic illustration of the secant modulusE.
where: a is the crack length and dS is the infinitesimal change in strain energy corresponding to an infinitesimal change da in crack length. An interpolation was thus performed for each value of G using the values ofS for consecutive runs at different crack lengths,a. Finally, the modulus(K) of the stress intensity factor was determined from:
K=s pa= GE. (5)
As pointed out by Aluko and Chandler (2004), for mixed mode problems the relationship betweenK,KIandKIIis given by:
(
)
K= KI2+KII2
1 2
, (6)
where:KIandKIIare the mode I (opening mode) and mode II (sliding mode) stress intensity factors, respectively.
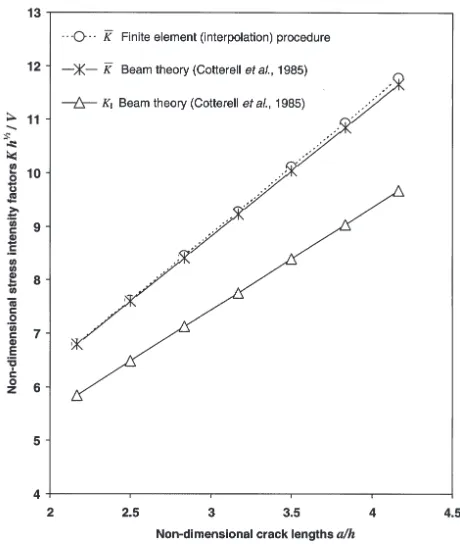
To check the validity of the finite element (inter-polation) procedure used, a simple analysis was carried out for a long crack (a/h> 2) propagating under the influence of a constant vertical loadVapplied at the blade tip (Fig. 8).
Stress intensity factor (K) values were determined using Eqs (3), (4) and (5). SinceH= 0, the termHdxon the right hand side of Eq. (3) vanishes. The stress intensity factors thus determined were compared with the analytical solutions (predicted values) obtained from the relationships proposed by Cotterell et al. (1985). For the case considered, the modulusKof the applied stress intensity factor is given by (Cotterellet al., 1985):
Kh
V a h
1 2
=1.50 2.44 ( / ) ,+ (7)
and the mode I stress intensity factorKIis given by:
K h
V a h
I
1.68 1.92
1 2
= + ( / ) . (8)
The predicted values and the finite element values ofK are presented on a non-dimensional plot as a function of the crack lengthain Fig. 9. The predicted values ofKIare also shown. The figure shows very good agreement between the finite element values and the predicted values. This indica-tes the validity of the finite element (interpolation)
proce-dure used. Using the interpolation proceproce-dure, a preliminary analysis of the brittle fracture soil cutting problem (Figs 5 and 7) was carried out to examine the pattern ofKfor load ratiosV/Hof 0.5, 0.2 and 0.05.
Complete stress intensity factor solutions
It has been pointed out that the soil cutting loads are of mixed mode and Aluko and Chandler (2004, 2006) have shown that the material property that governs brittle fracture by crack opening and propagation is the mode I stress inten-sity factorKIcsof the soil. Knowledge of the pattern of the mode I applied stress intensity factorKIin soil cutting is thus required as this will enhance the estimation of soil forces when used in conjunction with experimentally determined values ofKIcs. In order to obtain the stress intensity factors for mode I and mode II separately a PAFEC subroutine, the CRACK.TIPmodule, was used. This computes the separate values ofKIandKIIfrom the displacements obtained in the finite element analysis (Henshell, 1984). Using the CRACK.TIPmodule procedure, load ratios (V/H) within the range 0.1-0.8, which represent different blade configura-tions, were analysed. For each load ratio, several finite element runs were carried out using the incremental crack length method described earlier and stress intensity factor solutions were obtained forKI,KIIandK.
Fig. 8.Long crack (a/h > 2) propagation under a constant vertical loadV.
Fig. 9.Comparison of stress intensity factors for long cracks (a/h> 2).
RESULTS AND DISCUSSION
Stress intensity factor solutions
The results of the preliminary analysis carried out using the interpolation procedure are shown in Fig. 10. For the practical range of crack lengths considered, K initially decreases as the crack grows forV/Hratios of 0.5 and 0.2. Kreaches a minimum at some crack length which represents the point of transition from short to long crack behaviour. Beyond this crack lengthKstarts to increase approaching a linear relationship asa/hbecomes large. This implies that the applied force gradually increases up to a peak value at the
transition point. The applied force then falls off with further crack extension. For aV/Hof 0.05,K is seen to decrease monotonically and, within the practical range of crack lengths considered, no transition point occurs. This suggests that the applied force continues to increase as the crack grows. The implication of this will subsequently be discus-sed in the light of the pattern ofKI.
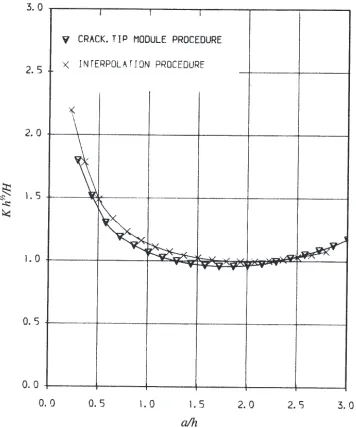
Figure 11 shows a typical comparison of the stress intensity factorsKobtained using theCRACK.TIPmodule and those obtained using Eqs (3), (4) and (5) (interpolation procedure) for an arbitrarily chosen load ratioV/Hof 0.2. The figure shows very good agreement between the two curves ofK, the slight difference being attributed to the interpolation procedure used in the first method.
Typical examples of the stress intensity factor solutions obtained using theCRACK.TIPmodule procedure are shown in Fig. 12. As expected,Kgenerally exhibits the same trends in Fig. 12 as earlier seen in Fig. 10 and a transition point, from short to long crack behaviour, can be identified for each load ratioV/H. The peakforceapplied at this point,
corresponding toK, will be denotedHand the corresponding crack length and resultant force,aandP, respectively. As the load ratio increases,Hdecreases. This implies that a blade configuration that induces a higher ratio of vertical to horizontal cutting forces requires less draft to cause soil failure by brittle fracture. In general, for load ratiosV/Hfrom 0.15 to 0.8,KIinitially decreases to a minimum and then subsequently increases rapidly untilKalmost entirely com-prisesKIie KII@0. This agrees with the analysis by Cotterell et al. (1985) of a long crack propagating parallel to the free surface.KIIis seen to decrease gradually at first and then rapidly, until it attains a value of approximately zero for long
Fig. 10.Preliminary curves of the modulusKof the applied stress intensity factor for short and long crack regimes: a –V/H= 0.5, b – V/H =0.2, c –V/H =0.05.
crack behaviour. Its main effect on the developing crack is to affect the direction of the crack path by either causing an intra-flexion or causing the crack to turn off towards the free surface (Cotterell et al., 1985). The crack length at the transition point of theKIcurve will be denotedaIand the cor-responding peak force,HI. The resultant force correspon-ding toaIwill be denotedPI.
For low load ratios (V/H£0.15), the pattern ofKIin the initial stages of crack growth suggests the absence of any significant crack opening. As pointed out above, in the absence of any significant crack opening tendency, if the apparently increasing applied force becomes sufficient to overcome the shear strength of the soil, shear failure rather than brittle fracture may occur. This agrees with the findings
of Aluko and Chandler (2004) who analysed Eq. (1) and reported the existence of a limiting value of V/H below which brittle fracture ceases and the failure mechanism changes to shear.
Interpretation and analysis of peak force values
K h
H N
I
I I
1 2
= , (9)
and using the energy criterion, the soil forces can be determined from the relationship:
Kh
H N
1 2
= , (10)
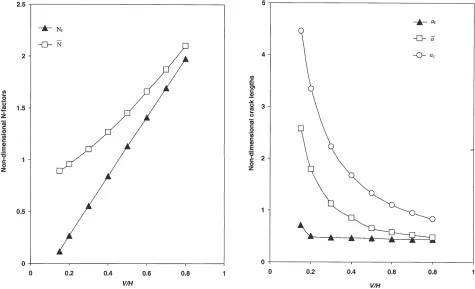
where: NI and N are constants obtained from the non-dimensional plots of Fig. 12.NIandN will be termed the N-factors. The variation of the N-factors can be represented on a non-dimensional plot for various load ratios as shown in Fig. 13. IfKIcsis known, then for a particularV/H,HIandH can be determined first by obtainingNIandNfrom Fig. 13, and then using Eqs (9) and (10). The transition crack lengths aIandaare represented on a non-dimensional plot (Fig. 14) as functions of the ratio of applied loads V/H. Values of critical crack lengthacpredicted using the equation (Aluko and Chandler, 2004):
a Hh
V
c=
2
3 , (11)
are also plotted in Fig. 14. It can be seen thatacis greater thanaby a constant factor of 2 over the range of load ratios indicated whilst little or no change occurs in the value ofaI.
Brittle fracture force estimation
It has been pointed out (Aluko and Chandler, 2004, 2006) that the two major inputs required for the estimation of brittle fracture cutting forces are the soil critical stress intensity factor KIcsand the ratio V/Hof the vertical and horizontal components, respectively, of the applied cutting forceP(Fig. 1). As a first approximation, input values of V/H for the present brittle fracture force prediction were empirically determined from published V/H versus rake angle curves (Aluko and Seig, 2000). Furthermore, KIcs values were obtained from the data published by Aluko and Chandler (2006).
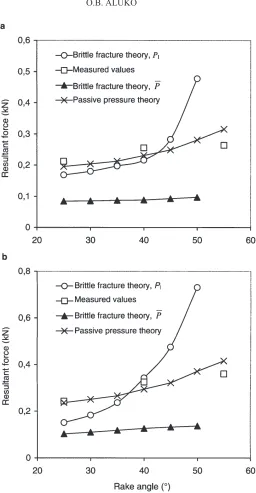
Using thedirect mode Iandenergycriteria discussed above, brittle fracture force prediction was carried out for soil and blade conditions corresponding to the experimental conditions previously reported by Aluko and Seig (2000). In Fig. 15, measured (Aluko and Seig, 2000) and predicted (passive pressure theory and brittle fracture theory) resultant soil cutting forces are compared for polished blades in sandy loam and clay loam soils. It can be seen that, in general, brittle fracture force prediction using the energy criterion (Eq. (10)) produces greatly underestimated values in comparison with the experimentally measured forces. For example, in Fig. 15a the predicted resultant forces Pare approximately between 39 and 43% of the measured forces.
However, when the direct mode I criterion is used, the predicted brittle fracture forces PI show reasonable agreement with the measured forces for a limited range of rake angles. For most soils, the predicted resultant forcePI initially increases gradually as the rake angle increases. At some rake angle, the pattern changes drastically and PI rapidly increases to very high values. This trend in the curves ofPI(Fig. 15) is a consequence of lowV/Hvalues as the rake angle is increased.
failure would occur for a 45° raked blade. The theoretical failure transition rake angle would be about 43°. This agrees with previously published (Aluko and Seig, 2000) experi-mental results for polished blades in the sandy loam soil. For the clay loam soil (Fig. 15b), on the other hand, the theore-tical failure transition rake angleiefrom brittle fracture to shear failure can be seen to be about 37°. However, during soil cutting experiments with polished blades in this clay loam soil (Aluko, 1988; Aluko and Seig, 2000), cutting with a 40° raked blade produced brittle fracture whilst cutting with a 55° raked blade produced shear failure. This suggests that specifying a limited failure transition rake angle (orV/H) range may be more appropriate in the application of the minimal energycriterion to failure type prediction rather than an abrupt failure transition rake angle value.
CONCLUSIONS
1. The finite element method has been used successfully to resolve the major limitation of the brittle fracture theory developed by Aluko and Chandler (2004), namely the de-duction of short crack behaviour under mixed mode loading. Consequently, for load ratiosV/H³0.15, there is a smooth transition from short to long crack behaviour rather than an abrupt change in the level of the applied stress intensity factor.
2. The present further development of the brittle fracture model leads to two possible interpretations for estimating peak soil cutting forces. These have been termed thedirect mode Icriterion and theenergycriterion. Whilst theenergy criterion significantly underpredicts the resultant force, the direct mode I criterion gives reasonable force estimates compared to measured values over a limited range of low rake angles. The model demonstrates that at low values of V/H, the cutting force required for brittle fracture becomes very large. In practical terms, this is brought about by changes in blade configuration.
3. Based on the comparison of predicted forces from both passive pressure theory and the brittle fracture model, a minimal energy criterion is proposed which provides a way of predicting the expected failure mechanism in a given situation.
4. At present, only empirical methods are available for the determination ofV/H, which is a major input to the model.
REFERENCES
Aluko O.B., 1988.Brittle fracture in soil cutting. Ph.D. Thesis, University of Newcastle upon Tyne, UK.
Aluko O.B. and Chandler H.W., 2004. Characterisation and modelling of brittle fracture in two-dimensional soil cutting. Biosys. Eng., 88(3), 369-381.
Aluko O.B. and Chandler H.W., 2006.A fracture strength para-meter for brittle agricultural soils. Biosys. Eng., 93(2), 245-252. Aluko O.B. and Seig D.A., 2000.An experimental investigation
of the characteristics of and conditions for brittle fracture in two-dimensional soil cutting. Soil Till. Res., 57, 143-157. Anonymous, 1990.Plaxis – Finite Element Code for Soils and
Rock Plasticity. Version 3. Balkema Press, Rotterdam, the Netherlands.
Bofinger H.E., 1970. The Measurement of the Tensile Properties of Soil-Cement. RRL Report LR 365, Ministry of Transport Press, Berkshire, Australia.
Chi L. and Kushwaha R.L., 1987.Three-dimensional finite ele-ment analysis of soil failure under a narrow tillage tool. ASAE Paper No. 88-1582, St. Joseph, MI, USA.
Chi L. and Kushwaha R.L., 1989.Finite element analysis of for-ces on a plane soil cutting blade. Can. Agric. Eng., 31, 135-140. Coleman G.E. and Perumpral J.V., 1974.The finite element
analy-sis of soil compaction. Transactions of the ASAE, 17, 856-860. Cotterell B., Kamminga J., and Dickson F.P.,1985. The essential
mechanics of conchoidal flaking. Int. J. Fracture, 29, 205-221. Fielke J.M., 1999. Finite element modelling of the interaction of the cutting edge of tillage implements with soil. J. Agric. Eng. Res., 74, 91-101.
Henshell R.D., 1984. PAFEC Theory Manual. PAFEC Press, Nottingham, UK.
Liu Yan and Hou Zhi-Min, 1985.Three dimensional nonlinear finite element analysis of soil cutting by narrow blades. Proc. Int. Conf. Soil Dynamics, Auburn, AL, USA, 2, 322-337. Perumpral J.V., Liljedahl J.B., and Perloff W.H., 1971.The
finite element method for predicting stress distribution and soil deformation under a tractive device. Transactions of the ASAE, 14(6), 1184-1188.
Raper R.L. and Erbach D.C., 1990.Prediction of soil stresses using the finite element method. Transactions of the ASAE, 33(3), 725-730.
Seig D.A., 1985.Soil compactability. Ph.D. Thesis, Institute of Technology, Cranfield, UK.
Yong R.N., Fattah E.A., 1976. Prediction of wheel-soil inter-action and performance using the finite element method. J. Terramechanics, 13, 227-240.
Yong R.N. and Hanna A.W., 1977. Finite element analysis of plane soil cutting. J. Terramechanics, 14(3), 103-125. Zienkewicz O.C., 1971.The Finite Element Method in