TECHNICAL NOTE
EFFECTS OF SALINITY, pH AND TEMPERATURE ON CMC
POLYMER AND XC POLYMER PERFORMANCE
M. K. Ghassem Alaskari* and Reza Nickdel Teymoori
Department of Petroleum Engineering, Petroleum University of Technology P.O. Box 63431, Ahwaz, Iran
[email protected] - [email protected]
*Corresponding Author
(Received: April 27, 2007 – Accepted in Revised Form: September 13, 2007)
Abstract The rheological and filtration properties of drilling mud under down-hole conditions may
be very different from those measured at ambient pressures and temperatures at the surface. This
paper presents the results of an experimental investigation into the temperature and salinity and pH effects on drilling mud rheological and filtration properties. Results are given from tests on water base mud containing CMC polymer and XC polymer. Drilling fluid was investigated at three different temperatures (21.1°C, 48.9°C, 80°C) containing 8.165Kg/bbl bentonite. The drilling mud salinities in this study were fresh water (Ahwaz water: ppm: 400, Hardness: 120), 2000 ppm, 4000 ppm, 8000 ppm and 40000 ppm. It was found that pH of drilling mud should be kept at range of 8-10, because increasing pH of drilling mud will increase its rheological properties. The salinity and temperature effects show that as the salinity and temperature of drilling mud are increased the effectiveness of polymers in drilling mud will decreased. Moreover, they have a negative effect on filtration properties of drilling mud. In suspensions of sodium montmorillonite that are well dispersed and have low gel
strength, both plastic viscosityand yield point decrease with increasing temperature.
Keywords Salinity, pH, Temperature, CMC, XC, Polymers, Drilling Fluid
ﻩﺪﻴﮑﭼ
ﻼﻣﺎـﮐﯽﻫﺎـﮔﯽﻫﺎﮕﺸـﻳﺎﻣﺯﺁﻂﻳﺍﺮـﺷﺭﺩﻥﺁﺕﺎﻴﺻﻮﺼﺧﺎﺑﯼﺭﺎﻔﺣﻝﺎﻴﺳﯽﮑﻳﮊﻮﻟﻮﺋﺭﺕﺎﻴﺻﻮﺼﺧﺮﻴﺛﺎﺗ "
ﺖﺳﺍﺕﻭﺎﻔﺘﻣ .
ﯼﺭﻮﺷ،ﺕﺭﺍﺮﺣﺮﻴﺛﺎﺗﺖﺤﺗﯼﺭﺎﻔﺣﻝﺎﻴﺳﺐﻴﮐﺮﺗﯼﺭﺎﺘﻓﺭﺮﻴﻴﻐﺗﺪﻧﻭﺭﯽﺳﺭﺮﺑﻪﺑﻪﻟﺎﻘﻣﻦﻳﺍﺭﺩ
،
pH
ﻭ
ﻢﻳﺍﻪﺘﺧﺍﺩﺮﭘﯽﮑﻳﮊﻮﻟﻮﺋﺭﺕﺎﻴﺻﻮﺼﺧ .
ﯼﻭﺭﺎﻫﺶﻳﺎﻣﺯﺁﯼﺮﺳﮏﻳﺯﺍﻩﺪﻣﺁﺖﺳﺪﺑﺞﻳﺎﺘﻧ ﻩﺪـﺷﻪﺘﺧﺎـﺳﯽﺑﺁﻪﻳﺎﭘﻞﮔ
ﺖﺳﺍﻩﺪﺷﻞﻴﻠﺤﺗﻪﻟﺎﻘﻣﻦﻳﺍﺭﺩ .
ﺭﺩﺶﻳﺎﻣﺯﺁﯼﺮﺳﻭﺩﺱﺎﺳﺍﺮﺑﯼﺭﺎﻔﺣﻊﻳﺎﻣ ﯼﺎﻫﺎﻣﺩ
۱ / ۲۱ ﻭ ۸۰ ﻪﺟﺭﺩ ﺩﺍﺮﮔﯽﺘﻧﺎﺳ
ﯼﺍﺭﺍﺩ ۱۶۵ / ۸
Kg/bbl
ﻡﺮﮔﻮﻠﻴﮐ ﺖﺳﺍﻩﺩﻮﺑﻪﮑﺸﺑﺮﻫﺭﺩﺖﻳﺎﻧﻮﺘﻨﺑ .
ﺐـﻴﺗﺮﺘﺑﯼﺭﺎـﻔﺣﻝﺎﻴـﺳﯼﺍﺮـﺑﻩﺪﺷﻩﺩﺎﻔﺘﺳﺍﺏﺁ
ﯼﺭﻮﺷﺎﺑﺯﺍﻮﻫﺍﺏﺁ ۴۰۰
ﯽﺘﺨـﺳﻭﻡﺍﯽﭘﯽﭘ ۱۲۰
، ۲۰۰۰ ، ۴۰۰۰ ، ۸۰۰۰ ، ۴۰۰۰۰
ﺖـﺳﺍﻩﺩﻮـﺑ .
ﻭﯽـﺳﺭﺮﺑﺞﻳﺎـﺘﻧ
ﻪﮐﺩﻮﻤﻧﺺﺨﺸﻣﺎﻫﺶﻳﺎﻣﺯﺁ
pH
ﻦﻴﺑﺪﻳﺎﺑﯼﺭﺎﻔﺣﻝﺎﻴﺳ ۸
ﺎﺗ ۱۰ ﺶﻳﺍﺰﻓﺍﺍﺮﻳﺯﺪﺷﺎﺑ
pH
ﺭﺎﺘﻓﺭﺮﻴﻴﻐﺗﺶﻳﺍﺰﻓﺍﺚﻋﺎﺑ
ﻞﮔﯽﮑﻳﮊﻮﻟﻮﺋﺭ ﺩﻮﺷﯽﻣ
. ﺶﻳﺎﻣﺯﺁﻩﻭﻼﻌﺑ ﯼﺎﻫﺮﻤﻴﻠﭘﺮﻴﺛﺎﺗﺕﺭﺍﺮﺣﻪﺟﺭﺩﻭﯼﺭﻮﺷﺶﻳﺍﺰﻓﺍﺎﺑﻪﮐﺩﺍﺩﻥﺎﺸﻧﺎﻫ
CMC
ﻭ
XC
ﺶﻫﺎﮐ ﯽﻣ ﺪﺑﺎﻳ . ﻥﺍﻭﺭﺕﺎﻴﺻﻮﺼﺧﯼﻭﺭﯽﻔﻨﻣﺮﻴﺛﺎﺗﻪﮐﺪﻳﺩﺮﮔﺺﺨﺸﻣﺹﻮﺼﺨﺑ ﺰـﻴﻧﯼﺭﺎـﻔﺣﻝﺎﻴﺳﯼﻭﺭ
ﺖـﻣﻭﺎﻘﻣﺎـﺑﻩﺍﺮـﻤﻫﯼﺭﺎـﻔﺣﻝﺎﻴﺳﺭﺩﺭﺍﺩﻢﻳﺪﺳﺖﻴﻧﻮﻳﺭﻮﻣﺖﻧﻮﻣﯽﻧﺎﮐﺩﻮﺟﻭﻭﺕﺭﺍﺮﺣﺶﻳﺍﺰﻓﺍﺎﺑﯽﻓﺮﻃﺯﺍﺩﺭﺍﺩ ﻥﺍﺮﮔﻢﮐﯽﻟﮊ ﯽﻣﺶﻫﺎﮐﺍﺭﯼﻭﺭ
ﺪﻫﺩ .
1. INTRODUCTION
The control of the flow properties and the filtration rate of drilling fluids in deep drilling operations are important aspects of drilling fluid technology. Low viscosities are desirable in the interest of efficient hydraulic horsepower utilization; low filtration rates imply thin filter cakes, which are desirable in
order that annular clearances be restricted to a minimal extent.
upset by temperature-induced effects such as changes in adsorption phenomena and solubility. This study compares viscometric and filtration properties of a water base mud treated with sodium carboxymethyl cellulose (CMC) and XC polymer at room temperature and 80°C.
2. CLAY PARTICLE LINKING PROCESSES
Clay is largely responsible for a mud’s thixotropic and gel-forming characters. To understand and control rheological changes in drilling fluids, the clay particle linking processes must be understood, According to van Olphen, plate-like particles have two different surfaces: the flat-face surface that normally is negatively charged and the edge surface that may be charged positively. These particles can associate in three different ways: face-to-face, edge-to-face or edge-to-edge. The linking of particles in these different fashions may proceed simultaneously, or one type or another may predominate [1].
Face-to-face association (aggregation) merely leads to the formation of thicker plates. This decreases the number of particles and causes a decrease in viscosity, Dispersion, the reverse of aggregation, leads to a greater number of particles and to higher viscosities.
Edge-to-edge or edge-to-face association is a flocculation process that leads to the formation of a “house-of-cards” structure. This also causes an increase in viscosity. Certain chemicals added to mud neutralize the edge charge, with the result that particles no longer associate to-edge or edge-to-face so the mud deflocculates.
2.1. Description of Equipment and
Materials
Hamilton Beach was used for mixingthe drilling mud materials. It has three rates for mixing; the medium rate for the drilling mud mixing was used here.
For high temperature tests, the mud sample was poured into some special cells and then the cells were put into the rolling oven (from Magcobar Company) for about 120 minutes. After that stage, the samples were tested.
Rheological properties were measured by using
Fan Viscometer (Model 35 SA). For high temperature testing the Heating Cup Viscometer was used. Pumping water from Water Bath equipment (from NESLAB Company, See Figure 4) into the heating cup viscometer kept the drilling fluid temperature constant during the rheological testing. HTHP Filter Press was used to obtain the API water loss volume.
The clay type in the experiments was Sodium Montmorillonite. Salt water-based mud was prepared through a pre-hydrate method. The first step for constructing salt-water base mud was mixing bentonite, water and some times soda ash and caustic soda. After preparing brine water, it is mixed with the initial mud.
High-viscous CMC and Low-viscous CMC and XC-polymer were tested at different salinities, Concentrations and temperatures.
At ambient temperature, two types of starch polymers were also tested (Green starch and corn starch) to obtain a comparative diagram for these polymers.
2.2. Sample Preparation
8.165 Kg/bblbentonite was mixed by Hamilton beach for about 10 minutes. Since the base mud is constructed from Ahwaz water (Hardness: 120 mg/l), therefore Soda ash was added to all suspensions for controlling the Ca2+ cations. Its concentration was constant and was
measured according to the following formula: [2]
mg/l (Ca2+concentration) x F
w x 0.000928 (1)
After 10 minutes, the polymer was added into the suspension to mix for about 15 minutes.
For high-salinity tests, the prepared brine was added into the suspension just after the first period. The following formula is applied in the laboratory to reach such value of salt concentration:
Vbrine = (ppm1×Vmud×ρmud)/((ppm2-ppm1)×ρbrine)
(2)
3. RESULTS AND DISCUSSION
3.1. Effects of Polymer Concentration on
Drilling Mud Properties
The viscosity ofdrilling mud largely depends on the number of solid particles in the mud and the shape of them. Hence, adding polymers with any concentrations and complex structures will increase the amount of the viscosity of drilling mud. Moreover, they will form long molecule chains that will cause an increase in drilling mud viscosity.
At high salinity that Montmorillonite platelets tend to flocculate, addition of polymer has also another effect. Polymers can form a sealing layer around the clay platelets that will inhibit cations to substitute between clay platelets.
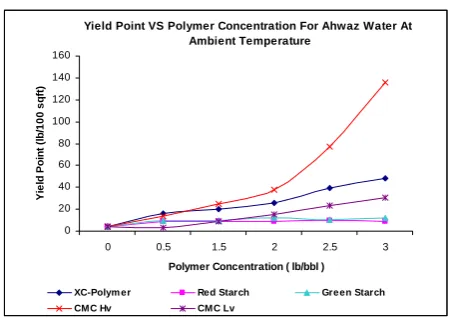
CMC Lv. and CMC Hv. have the same chemical structure. Both have a carboxymethyl group on their structure, but CMC Hv. has a higher D.P. (Degree of polymerization) rather than CMC Lv. It causes CMC Hv. to exert higher viscosity than CMC Lv. It is true for plastic viscosity, yield point and gel strength [4].
Starch polymers are non-ionic or slightly anionic; due to this property, the polymer chain of starch will be shorter than anionic polymers such as CMC Hv. or CMC Lv. In addition, the hydration of starch at fresh water is less than anionic polymers. Because of these reasons starch has a lower viscosity (Apparent and Plastic viscosity) and thixotropic property (Yield Point and Gel Strength) than CMC. [4].
As Figures 1 through 4 shows at low concentration of polymers, there is little difference between rheological properties of different polymers. But at high concentration this difference will be clearer. It is due to the polymers structures, meaning the long chain polymers will make more viscous fluid than the short types at the same concentration. So the difference between them will become more obvious at high concentrations.
As Figure 5 shows, API Water Loss graph of XC-Polymer is approximately the same as that of Green starch. In spit of the weakness of XC-Polymer on filtration properties, this polymer is very effective for improving the rheological properties of mud. CMC Polymers are more effective for controlling fluid loss of drilling mud in comparison with others.
Apparent Viscosity VS Polymer Concentration For Ahwaz Water At Ambient Temperature
0 20 40 60 80 100 120
0 0.5 1.5 2 2.5 3
Polymer Concentration ( lb/bbl )
A
p
p
a
re
nt
V
is
c
os
it
y
(
c
p
)
XC-Polym er Green Starch Red Starch CMC Hv CMC Lv
Figure 1. Apparent viscosity versus various polymers concentrations.
Plastic Viscosity VS Polymer Concentration For Ahwaz Water base Mud At Ambient Temperature
0 5 10 15 20 25 30 35 40
0 0.5 1.5 2 2.5 3 polymer Concentration ( lb/bbl )
P
las
ti
c V
isc
o
s
it
y
(
c
p
)
XC-Polym er Red Starch Green Starch CMC Hv CMC Lv
Figure 2. Plastic viscosity versus various polymers concentrations.
Yield Point VS Polymer Concentration For Ahwaz Water At Ambient Temperature
0 20 40 60 80 100 120 140 160
0 0.5 1.5 2 2.5 3
Polymer Concentration ( lb/bbl )
Y
iel
d
P
o
in
t (
lb
/10
0 sq
ft
)
XC-Polym er Red Starch Green Starch CMC Hv CMC Lv
3.2. The effect of Salinity on Drilling Mud
Properties
With
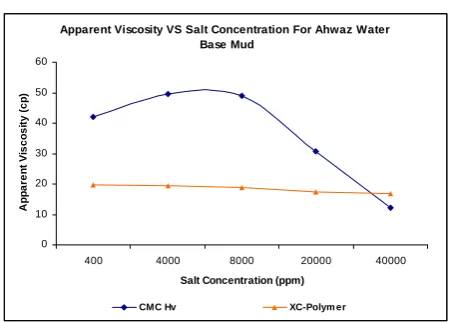
the addition of NaCl, the double layer of the clay particles is compressed enhancing flocculation of the suspension. In other words, the separation between the clay platelets was reduced with increasing concentration of salt. It will decrease the viscosity of drilling fluid. When a polymer is added to water, the cations (usually Na+) release from the polymer chain andleave behind a negatively charged site. The polymer is now anionic and free in hydrate water. As the polymer hydrates the water, the envelope surrounding the polymer increases in size and along with it viscosity increases. With the presence of salt the availability of water is limited and polymer cannot hydrate and expand easily. It means that hydrogen bonding is not formed between the polymer chains and water molecules; therefore the gel strength of this fluid will become negligible [4].
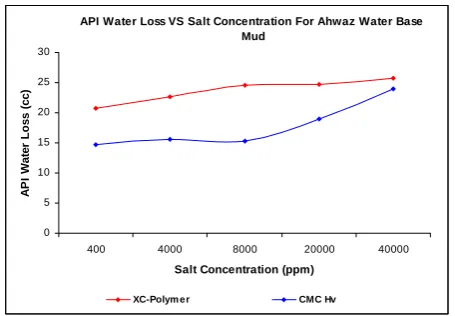
Figures 6 through 8 show the Plastic Viscosity Versus Polymers Concentrations (CMC Polymers and XC-Polymer) in various drilling muds with different salinities. As these figures show plastic viscosity of drilling mud at 400 ppm (Ahwaz water salinity) and 8000 ppm are close to each other. But at high salinities the plastic viscosity values decreased sharply. It is also true for the yield point and Gel Strength. (See Figures 8 through 13). Another effect of salinity is increasing filtrate volume of drilling mud. It is probably due to the sticking of clay platelets together, in other words the hydration of freshwater clays decreases rapidly with increasing concentrations of the salts.
Figures 6 and 10 show apparent viscosity as a function of polymer concentration at different drilling mud salinities.
3.3. Effect of Temperature on Drilling Mud
Properties
The effect of high temperatures onmontmorillonite suspensions can be attributed to the complicated interplay of several causes, among which the following are prominent: [5]
• Reduction of the degree of hydration of the counter ions,
• Changes in the electrical double-layer thickness,
• Increased thermal energy of the clay micelles,
Gel Strength 10 Min VS Polymer Concentration in Ahwaz Water Base Mud At Ambient Condition
0 20 40 60 80 100 120
0 0.5 1 2 3 4
Polymer Concentration (lb/bbl)
G
e
l
1
0
M
in
(
lb
/10
0 sq
ft
)
CMC Lv CMC Hv Green Starch Corn Starch
Figure 4. Gel strength 10 min versus various polymers concentrations.
API Water Loss VS Polymer Concentration ForAhwaz Water At Ambient Temperature
0 5 10 15 20 25 30 35
0 0.5 1.5 2 2.5 3
Polymer Concentration ( lb/bbl )
A
P
I W
a
te
r L
o
s
s
(c
c
)
XC-Polym er Red Starch Green Starch CMC Hv CMC Lv
Figure 5. Api water loss versus various polymers concentrations.
Apparent Viscosity VS Salt Concentration For Ahwaz Water Base Mud
0 10 20 30 40 50 60
400 4000 8000 20000 40000
Salt Concentration (ppm)
A
p
pa
re
nt
V
is
c
o
s
it
y
(
c
p)
CMC Hv XC-Polym er
Yield Point VS Salt Concentration For Ahwaz Water Base Mud
0 10 20 30 40 50 60 70
400 4000 8000 20000 40000
Salt Concentration (ppm)
Y
iel
d
P
o
in
t (
lb
/10
0 s
q
ft
)
XC-Polym er CMC Hv
Figure 7. Yield point versus salinity for two muds containing CMC Hv and XC-polymer.
Gel 10 Sec VS Salt Concentration For Ahwaz Water Base Mud
0 5 10 15 20 25 30
400 4000 8000 20000 40000
Salt Concentration (ppm)
G
e
l
10
S
e
c
(
lb
/10
0 s
q
ft
)
XC-Polym er CMC Hv
Figure 8. Gel strength 10 Sec versus salinity for two muds containing CMS Hv and XC-polymer.
API Water Loss VS Salt Concentration For Ahwaz Water Base Mud
0 5 10 15 20 25 30
400 4000 8000 20000 40000 Salt Concentration (ppm)
A
P
I W
a
ter
L
o
s
s (cc
)
XC-Polym er CMC Hv
Figure 9. API water loss versus salinity for two muds
containing CMC Hv and XC-polymer at 80˚C.
Apparent Viscosity VS CMC Hv Concentration
0 10 20 30 40 50 60 70 80
0 0.5 1 1.5 2 2.5
Polymer Concentration ( lb/bbl )
A
ppa
re
nt
V
is
c
os
it
y
(
c
p)
Am bient Tem perature 80 ˚C
Figure 10. Apparent viscosity versus CMC Hv concentration at different temperatures.
Plastic Viscosity VS CMC Lv Concentration For Ahwaz Water base mud
0 5 10 15 20 25
0 0.5 1.5 2 2.5 3 Polymer Concentration ( lb/bbl )
P
last
ic
V
isc
o
s
it
y
(
c
p
)
80 ˚C Am bient Tem perature
Figure 11. Plastic viscosity versus CMC Lv concentration at different temperatures.
Yield Point VS CMC Hv Concentration
0 20 40 60 80 100 120
0 0.5 1 1.5 2 2.5
Polymer Concentration ( lb/bbl )
Y
iel
d
P
o
in
t (
lb
/10
0 sq
ft
)
Am bient Tem perature 80 ˚C
• Reduction of the viscosity of the suspending medium and increasing dispersion of associated clay micelles.
All these processes take place simultaneously, and an interpretation of the observed results is possible only in those cases where some of the effects are predominant, so that they can be identified.
Figures 10 through 14 show the effects of temperature on Rheological and Filtration properties of drilling mud for CMC Hv and CMC Lv and XC-Polymer.
The effect of increasing temperatures on the dispersed suspensions of sodium montmorillonite can be explained by a simple weakening of the strength of the bonds between particles by thermal energy, this effect explains the decrease in Yield Point. The plastic viscosity also decreases at higher temperatures for all sodium montmorillonite suspensions. This is probably because of a partial destruction of the hydration shell [6]. This is another factor that should be considered is decreasing viscosity of the base mud with increasing temperature. In Figures 10 through 14 apparent viscosity of drilling mud at an ambient temperature and 80°C are compared. As can be seen increasing temperature caused a significant decrease in the apparent viscosity of drilling mud. Figure 18 compare API water loss volume of drilling mud as a function of polymer concentration at two different temperatures (ambient temperature and 80°C).
Increasing temperature will lead to a decrease in the viscosity of the liquid phase of drilling mud that in turn will increase fluid loss volume if all other factors remain constant. Another reason of increasing fluid loss due to increasing temperatures are breaking bonds between polymer chains and also at very high temperatures thermal degradation of polymers.
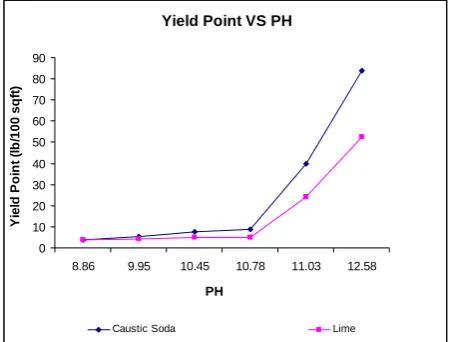
3.4. Effect of pH on Drilling Mud Properties
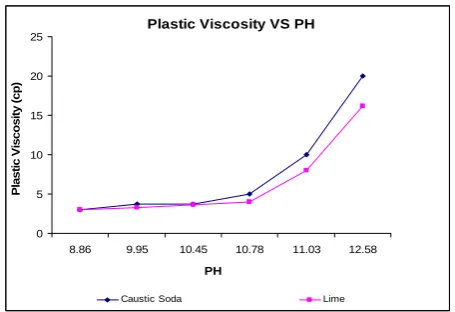
Caustic soda and lime were used for increasing pH of drilling mud. Therefore, comparative diagrams were created for these two additives.
As Figures 15 through 17 show, Rheological Properties (Plastic viscosity, Apparent Viscosity, Yield Point and Gel strength) of drilling mud will increase gradually until pH = 10 but it has a sharp
Gel 10 Sec VS CMC Hv Concentration
0 5 10 15 20 25 30 35
0 0.5 1 1.5 2 2.5
Polymer Concentration ( lb/bbl )
G
e
l 10 S
e
c
(
lb
/1
00 sq
ft
)
Am bient Tem perature 80 ˚C
Figure 13. Gel strength 10 sec versus CMC Hv concentration at different temperatures.
API Water Loss VS XC-Polymer Concentration For 8000 ppm Water Base Mud At Different Temperatures
0 20 40 60 80 100 120
0 0.5 1 1.5 2 2.5
Polymer Concentration ( lb/bbl )
A
P
I W
a
te
r L
o
ss (
c
c)
Am bient tem perature 80
Figure 14. API water loss versus XC-polymer concentration at different temperatures.
Plastic Viscosity VS PH
0 5 10 15 20 25
8.86 9.95 10.45 10.78 11.03 12.58
PH
P
las
tic V
isc
o
s
ity
(c
p)
Caustic Soda Lime
increase after this point. It will confirm dispersion of clay minerals at high pH values.
Therefore, adding Caustic soda is more effective than Lime for increasing the viscosity of drilling mud. It is due to the existence of Divalent cations such as Ca2+ in lime and Monovalent
cations such as Na+ in Caustic Soda. Existence of
cations will increase the attractive force between platelets. Monovalent cations give rise to a lesser attractive force and allow more water to penetrate between the platelets than divalent cations [2]. So platelets will be dispersed well, while adding Caustic Soda and consequently rheological properties of the mud is more efficient than the adding of lime.
Yield point is a measurement of the electro-chemical or attractive forces in a fluid at dynamic conditions, but Gel strength in this measurement are at static condition. Therefore increasing caustic soda and lime concentrations will lead to an increase in Yield Point and Gel Strength of drilling mud.
Figure 18, confirms that increasing pH will lead to a decrease in the API water loss volume. It is probably due to increasing viscosity of drilling mud.
4. CONCLUSIONS
The initial aim of this paper was the interpretation and analyzing of the Drilling mud behavior in different situations (Such as: Salinity, pH, Temperature and polymer concentration) and comparison of their effect on mud properties. Some significant results that have been seen during this study are:
• CMC Hv had considerable effect on filtration control and a little increase in its concentration caused a considerable growth at mud viscosity. • Increasing pH of drilling mud will increase
rheological properties (Plastic viscosity, apparent viscosity, Yield Point and Gel Strength) of drilling mud. It is probably due to increasing flocculation of sodium Montmorillonit (clay) platelets as a result of increasing cation concentration in mud.
• Caustic soda (NaOH) is more effective than
Yield Point VS PH
0 10 20 30 40 50 60 70 80 90
8.86 9.95 10.45 10.78 11.03 12.58 PH
Y
ie
ld
P
o
in
t (
lb
/1
00 sqf
t)
Caustic Soda Lime
Figure 16. Yield point versus pH.
Gel St. 10 Min VS PH
0 5 10 15 20 25 30 35 40 45 50
8.86 9.95 10.45 10.78 11.03 12.58
PH
Ge
l 1
0
Mi
n
Caustic Soda Lime
Figure 17. Gel strength 10 min versus pH.
API Water Loss VS PH For Different Mud Compositions at Ambient Temperature
0 2 4 6 8 10 12 14
9.46 9.87 10.85 11.4 12.56
PH
A
P
I W
a
te
r L
o
s
s
(c
c
)
Mud Containing 1.035 lb/bbl CMC Lv Mud Containing 0.5 lb/bbl CMC Hv Mud Containing 3 lb/bbl Green Starch Mud Containing 3 lb/bbl Corn Starch
lime (CaOH) for increasing viscosity of drilling mud.
• XC-polymer is not a strong fluid loss controller like CMC polymers, but it has significant effect on viscosity of drilling mud.
• Salinity has a considerable effect on rheological and filtration properties of drilling mud, especially when ppm of mud is above 10000.
• Effect of salinity on XC-polymer is negligible in comparison with the other polymers (CMC Hv, CMC Lv, Green starch and Corn starch). • Under the same conditions (In the case of
salinity and temperature) as the polymer concentration increased, the difference between their performances also gets more striking. For example at low concentrations of polymer, the difference between curves is negligible but with increasing polymer concentration, the difference will get more striking.
• Salinity and temperature have negative effects on filtration properties of drilling mud. Meaning that as the salinity and temperature of drilling mud increase, the filtrate volume of drilling mud that will penetrate into the formation will increase.
• As the salinity and temperature of drilling mud are increased the effectiveness of polymers in the drilling mud will decreased.
In suspensions of sodium montmorillonite that are well dispersed and have low gel strength, both Plastic viscosity and Yield Point decrease with increasing temperature.
5. NOMENCLATURE
Fw The fractional % of water from retort.
Vbrine Volume of required brine, cc.
Vmud Volume of mud, cc.
ρmud Mud density, Gr/Cm3.
ρbrine Brine density, Gr/Cm3.
ppm1 Target salt concentration of mud, ppm.
ppm2 Initial salt concentration of brine, ppm.
6. ACKNOWLEDGMENTS
The author wishes to express his appreciation to Petroleum University of Technology of Iran for the opportunities that were given to him for doing this research.
The cooperation of Professor M. K. Ghassem Alaskari for guiding the researcher and sharing his wealth of experience and knowledge to further his education is also greatly appreciated.
7. REFERENCES
1. Annis, M. R., “High-Temperature Flow Properties of
Water-Based Drilling Fluids”, JPT, (August 1967),
1074-1080.
2. Al-Marhoun, M. A. and Rahman, S. S., “Optimizing the
Properties of water-based Polymer Drilling Fluids for
Penetrating Formations with Electrolyte Influx”, Erdol
Erdgas, (August 1988), 318-323.
3. Neff, J. M., “Compositional, environmental fates, and
biological effects of water based drilling muds and cuttings discharged”, Petroleum Environmental Research Forum (PERF) and API, (January 2005).
4. Fink, J. K., “Oil Field Chemicals”, Gulf Professional
Pub., Amsterdam; Boston; (2003), 495.
5. Nickdel Teymoori, R., “Laboratory Investigation of
Rheological Properties of Water Based Drilling Muds”, M. S. Thesis, Petroleum University of Technology, Ahwaz, Iran, (April 2007).
6. Hiller, K. H., “Rheological Measurements on Clay
Suspensions and Drilling Fluids at High Temperature