Please cite this article as: M. AlimohammadiArdekani, H. Hoseininasab, H. khademizare, M. Fakhrzad, A Robust Two-stage Data Envelopment Analysis Model for Measuring Efficiency: Considering Iranian Electricity Power Production and Distribution Processes, International Journal of Engineering (IJE), TRANSACTIONS B: Applications Vol. 29, No. 5, (May 2016) 646-653
International Journal of Engineering
J o u r n a l H o m e p a g e : w w w . i j e . i rA Robust Two-stage Data Envelopment Analysis Model for Measuring Efficiency:
Considering Iranian Electricity Power Production and Distribution Processes
M. Alimohammadi Ardekani*, H. Hoseininasab, H. khademizare, M. Fakhrzad
Department of industrial engineering, Yazd university, Yazd-Iran
P A P E R I N F O
Paper history:
Received 28 October 2015
Received in revised form 07 January 2016 Accepted 28 January 2016
Keywords:
Two-stage Data Envelopment Analysis Efficiency
Robust Optimization Uncertainty
A B S T R A C T
This paper presents a new robust two-stage Data Envelopment Analysis (DEA) for efficiency evaluation of the electricity power production and distribution companies. DEA has been widely used for benchmarking the electricity companies. Traditional studies in DEA consider systems as a whole when measuring the efficiency, ignoring the operation of individual processes within a system. To tackle this issue, many works, aptly labeled Network DEA (NDEA), have been done to decompose the decision making units (DMU) overall efficiency. The two-stage DEA model is a special variation which evaluates the efficiency of the DMUs having a two-stage internal structure. In two-stage DEA model initial inputs are used to make intermediate outputs and in the next Sub-process, intermediate outputs are transformed to the final output. Conventional two stage data envelopment analysis (DEA) models require the exact data of inputs or outputs. However, in many real world applications this simple assumption does not hold. Robust optimization technique has been introduced for entering perturbation in the mathematical programming problem such as two-stage DEA. This paper adopts this concept with the existing two-stage DEA model. The implementation of the proposed method of this paper is applied for ranking different electricity power production and distribution companies in Iran.
doi: 10.5829/idosi.ije.2016.29.05b.08
1. INTRODUCTION1
Data envelopment analysis (DEA), developed by Charnes et al., is a tool for relative efficiency assessment of decision making units (DMUs) such as hospitals, bank, insurance companies, firms, R&D organizations and others [1].
In many cases, DMUs may have internal or network structures; see for example, Färe and Grosskopf [2], Castelli et al., [3], and Tone et al., [4].
Traditional DEA models appraisal efficiency, just according to inputs and outputs, regardless of internal structure of DMUs. That's why the conventional models are unable to identify the causes and sources of inefficiency within the DMUs [5].
1*
Corresponding Author Email: [email protected] (M. alimohammadi)
To measure the efficiency of complex network system effectively, several researchers have attempted to get into the inside of the ‘‘black box’’ by paying attention to the internal structure of the DMUs (see example Lewis & Sexton [5]; Prieto & Zofio [6]; Avkiran & McCrystal [7]; Hahn et al., [8]; Tone & Tsutsui, [9]; Cook et al., [10]; Wei & Chang [11]; etc.).
Those approaches are called ‘‘Network DEA models’’ which consider the decision making unites as composed by several stages and every stage has own inputs and outputs, and related by intermediate measures [12].
By far, there are a number of network DEA models that have been proposed for efficiency measurement in network structures systems.
are developed into the intermediate outputs and in the next Sub-process, intermediate outputs are transformed to the final output [13, 14]. Two- stage DEA models can decompose overall efficiency of decision making units in to the efficiency of each stage [15, 16].
Practically, there are many cases we face with perturbation in the input, output or intermediate output data while the original two-stage DEA assumes the measuring of input/output or intermediate outputs with full accuracy. In a survey study on some benchmark problems, Ben-Tal and Nemirovski [17] showed that with even a small noise on parameters, optimal solution may become infeasible solutions for some optimization programming problems.
Robust optimization has received much attention as a new approach for modeling uncertainty in data. Robust optimization is developed based on studies of Ben-Tal and Nemirovski [17-19], El-Ghaoui and Lebret [20], Bertsimas and Sim [21-23] and Bertsimas, Pachamanova, and Sim [24]. In robust optimization approaches we are looking for near-optimal solutions that with high probability are feasible in uncertainty situations.
Soyster [25] in 1973 presented a simple robust approach. He supposed the vectors of the constraint are changing in an ellipsoidal uncertainty sets.
Falk conducted more researches into inexact linear programs to follow this idea [26]. Ben-Tal and Nemirovski [17] and El-Ghaoui and Lebret [20] proposed a new model for uncertain data based on ellipsoidal uncertainty sets.
Bertsimas and Sim [22] proposed a new approach in robust optimization which preserve the class of problems under analysis. Their model was based on polyhedral uncertainty sets.
It is concluded that by applying this approach the classification of the original problem can be preserved. Therefore, the Bertsimas approach provides better results when the number of constraints and variables increase in the DEA model [27].
In this paper, we propose a general method for network efficiency estimation with the case study of Regional Electricity Company of Iran with uncertain data. In this research, we apply Bertsimas (BR) approaches to develop robust two-stage DEA model. In electricity power production and distribution system, we are faced with some cases where it is necessary to consider perturbation. Proposed model can handle the perturbation problems. The method is applied for Iranian Regional Electricity Company and the results are compared with traditional methods. This paper is organized as follows. We first present Two-stage DEA model based on Kao [16] survey in section 2. In section 3, robust two-stage DEA with uncertain data are discussed. The proposed two-stage DEA are solved using some actual data to show validity in section 4. Finally, the conclusion remarks of the paper are given in
Section 5 to summarize the contribution of the paper in Section 6.
2. TWO-STAGE DEA MODEL
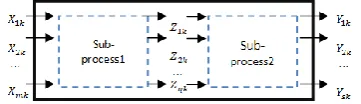
DEA is an ideal approach to measure the performance of various systems with multiple inputs and outputs [28, 29]. Suppose a production process is composed of a series of two sub-processes as showed in Figure 1. The whole process uses inputs Xik, i 1,...,mto produce outputs Yrk, r1,...,s . As opposed to the
traditional one-stage production process, here the production process is composed of two sub-processes within termediate products Zpk, p 1,..., q. Moreover; the intermediate products Zpk are the outputs of stage 1 as well as the inputs of stage 2.
The way to calculate the overall efficiencyEk , taking into account the series relationship of the two sub-processes, is as follows [16]:
1 1 1 1 1 1 1 1 max /
s.t. / 1, 1,..., ,
/ 1, 1,..., ,
/ 1, 1,..., ,
, , , 1,..
s m
k r rk i ik
r i
s m
r rj i ij
r i
q m
p pj i ij
p i
q s
r rj p pj
r p
r i p
E u Y X
u Y X j n w Z X j n u Y w Z j n u w r
., ; 1,..., ; 1,..., .
s i m p q
(1)
Model (1) is a linear fractional program which can be transformed into the following linear program:
1 1 1 1 1 1 1 1 max
. . 1,
0, 1,..., ,
0, 1,..., ,
0, 1,..., ,
, , , 1,..., ;
1,..., ; 1,..., . s
k r rk
r m
i ik i
s m
r rj i ij
r i
q m
p pj i ij
p i
q s
r rj p pj
r p
r i p
E u Y
s t X
u Y X j n
w Z X j n
u Y w Z j n
u w r s
i m p q
(2)
Multipliers ur,
i and wp are virtual multipliers and εis a small non-Archimedean number which is imposed to prevent any input/output and intermediate output factor from being ignored in calculating the efficiency.
After the optimal multipliers are solved, the efficiencies are obtained subsequently as follows:
* 1 * *
1 1 1
2 * *
1 1
, / ,
and /
s q m
k r r rk k p p pk i i ik s
q k r rk p p pk
r
E u Y E w Z X
E u Y w Z
(3)Obviously, we have 1 2
* .
k k k
E E E
3. ROBUST TWO-STAGE DEA BASED ON BERTSIMAS (BR) APPROACH
The two-stage DEA model does not allow any uncertainty in input/output and intermediate output vectors. However, in several cases in the real world, there is noise and perturbation in data and developing two-stage DEA model is inevitable. The robust optimization (RO) has become a popular to handle the effects of uncertainty in the data. Although, the classical approach to deal with uncertainty is stochastic programming (SP), in this paper, RO based on Bertsimas and Sim [22] approach is used as an alternative for sensitivity analysis and stochastic programming. For better understanding of the robust structure developed by Bertsimas and Sim [22], consider the following LP problem:
max . , cx s t Ax b x X (4)
Bertsimas and sim showed that the the robust formulation of LP problem (4) is obtained as follows,
(5)
In this approach
i
J represents the set of coefficient in row i which are subjected to uncertainty and
i
pand
ij
q
are new robustness variables. In this model,ˆ
ij
a denotes the precision of the estimate
a
ijandi takes value in the interval [0,n]. This parameter is not necessarily integer and for every constraint i is defined to adjust the robustness of the proposed method against the level of conservatism of the solution. If we seti
= 0 , it means there is no protection against uncertainty. For i= n, the ith constraint of the problem is protected against all possible uncertainty and for other vlaues interval [0,n] ,
the decision maker consider a trade-off between the protection level of the constraint and the conservation degree of the solution.
The multipliers in the objective function of two-stage DEA (model 2) are output variables. So, the objective function is also subject to uncertainty. To consider this issue in robust model, we added new constraint
1
z 0
s r rk r
u Y
, to the two-stage DEA andrewrite the model (2) as follows:
1
1
1 1
1 1
max z
. . z 0
1,
0, 1,..., ,
0, 1,..., ,
k s r rk r m i ik i s m
r rj i ij
r i
q m
p pj i ij
p i
E
s t u Y
X
u Y X j n
w Z X j n
1 10, 1,..., ,
, , , 1,..., ; 1,..., ; 1,..., . q
s
r rj p pj
r p
r i p
u Y w Z j n
u w r s i m p q
(6)
where,
z
is the efficiency of DMU under consideration. Now we could consider the robust two-stage DEA approach based on Bertsimas and Sim as follows,1
1
1 1
max
. . 1,
z 0,
0, 1,..., ,
i i m i ik i s
r rk k k rk
r j J
s m
r rj i ij j j rj
r i j J
p pj i ij j z
s t X
u Y p q
u Y X p q j n
w Z X
1 1 1 10, 1,..., ,
0, 1,..., ,
, , i i i q m j pj
p i j J
q s
r rj p pj j j rj pj
r p j J j J
j rj rj r i j pj pj p
p q j n
u Y w Z p q q j n p q eY y r j J
p q eZ y p j
, , r, , , , , , 0
i j pj pj p i j rj rj r i
r r r p p p j j j rj r p pj
J p q eZ y p j J p q eY y r j J
y u y y w y p p p p q y y q
, ,
, , , 1,..., ; 1,..., ; 1,..., .
i r i p
r p j J u w r s i m p q
(7)
Due to the existence 1 1, m i ik i X
in model 2, we justconsidered outputs and intermediate outputs as uncertain parameters and perturbation in input data cause the robust model to become infeasible. The proposed robust model is based on input oriented two-stage DEA model. If the perturbation and noise were in input data, decision maker should use output orientated two-stage DEA model.
max . :
i
ˆ ,
j
l
, , 0 ,
i
ij j i i ij i
j j J
i ij ij j i
j j j
j j j
i ij j i
cx s t
a x p q b
p q a y i j J
y x y
x u
p q y i j J
In Problem (7), it is sufficient to choose i at least equal to:
1
1 (1 ) ,
i ei n
(8)
where,
e
iis the most probability of the constrainti
violation andn
is the sources of uncertainty for each constraintand is the cumulative distribution of the standard Gaussian variable [24].Problem (7) can be solved using any ordinary linear programming packages, e.g. Lindo, Gams, etc.
The robust counterpart proposed by Bertsimas et al. [22] is linear optimization problems. In other word, the Bertsimas approach preserves the classification of the original problem, e.g., the robust counterpart of a linear programming problem such as two-stage DEA remains a linear programming problem.
4. CASE STUDY: EVALUATION OF ELECTRICITY POWER PRODUCTION AND DISTRIBUTION NETWORKS
Electrical power is an initial infra structure of most industries, services, and productions. The electrical power has an important role in economic development and improvement of people’s lives. In this section, the proposed approach is used in order to evaluate the performance of electricity power production and distribution networks in Iran. The case study consists of 14 production and distribution networks. The evaluation is accomplished based on data in 2014.
Electrical networks consist a production stage (i.e., power plants) and a distribution stage (i.e., regional electricity companies). In the production stage, power plants usually consume fuels such as fuel oil, gas oil and natural gas and produce electricity. In the distribution stage, the output of production stage (i.e., the electricity power) is assumed as an input for regional electricity companies. In distribution stage, some companies may act as transfer or and just distribute the electricity power to other neighboring companies, distributing companies, and other consumer sections (i.e., agriculture, housing, industries and etc.).
On the other hand, there are several regional electricity companies in our study. Some of them have both stages (i.e., electricity generation and electricity distribution). Some other just has electricity distribution. The first companies use the parts of electricity generated in their region and the redundant part of electricity power are transmitting to adjacent states which have no generation stage. This process yields a complicated network structure as depicted in Figure 2.
In this research, we have focused on 14 homogenous production and distribution networks. Values of the input and output are collected from detailed reports of
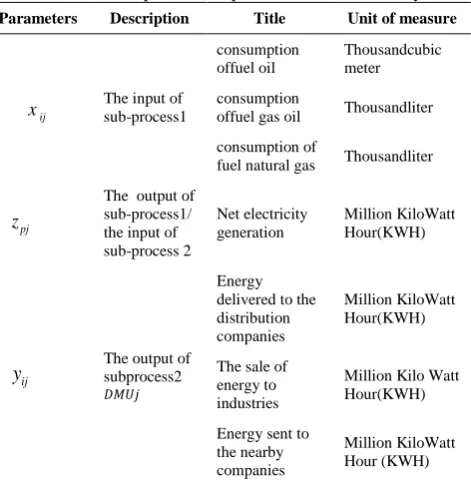
Iran’s electricity power generation and energy balances in 2014. The inputs and outputs of case study and their unit presented in Table 1.
5. RESULTS
In order to demonstrate the performance of the proposed robust two- stage DEA model of this paper, the information of 14 companies for Iranian regional electric companies are used and an efficiency measure and rank are calculated for each company in 2014. The model is solved without considering any uncertainty in inputs and outputs. The results of two- stage DEA model for 2014 are shown in Table 2. As observed, in terms of technical efficiency for two- stage DEA in 2014, DMU2, DMU11and DMU3 with overall efficiency ratings equal to 1, 0.945 and 0.848 show the efficient frontier. Other companies obtained efficiency ratings below one, ranging from a minimum of 0.208 (DMU 1) to 0.840 (DMU 14), making them technically inefficient. The mean overall technical efficiency score is 0.643.
Figure 2. Conceptual model of Electrical production and distribution stages
TABLE 1. Inputs and outputs used in the case study
Parameters Description Title Unit of measure
ij
x The input of sub-process1
consumption offuel oil
Thousandcubic meter
consumption
offuel gas oil Thousandliter
consumption of
fuel natural gas Thousandliter
pj
z
The output of sub-process1/ the input of sub-process 2
Net electricity generation
Million KiloWatt Hour(KWH)
ij
y The output of subprocess2
Energy delivered to the distribution companies
Million KiloWatt Hour(KWH)
The sale of energy to industries
Million Kilo Watt Hour(KWH)
Energy sent to the nearby companies
Million KiloWatt Hour (KWH)
1. The cost of Consumption fuel oil
2. The cost of Consumption fuel gas oil 3. The cost of Consumption fuel natural gas
Power plants
Regional electricit y compani
es
1. Energy delivered to the distribution companies
2. The sale of energy to industries
3. Energy sent to the nearby companies Net
According to the Table 2, DMU2; DMU4; DMU7; DMU9; DMU11; DMU12, have achieved the highest rank in the production stage and DMU1 has achieved the worst rank.In distribution stage, DMU2; DMU3 and DMU6 have achieved the highest rank and DMU8 has achieved the worst rank.Despite DMU4 and DMU7 have achieved the highest rank in the production stage, these units were not in efficient frontier in distribution stage, so, they are placed in a poor situation in the overall process.
DMU5 and DMU6 have achieved a good rank in the distribution stage, but because of this unit were not efficient in production stage; so, these units are not efficient in the overall process as well. DMU2 has achieved the highest rank in the production stage, distribution stage and overall process stage.
DMU1; DMU3; DMU6 and DMU13 in distribution stage act better than production stage.
Next, we use the robust two-stage DEA model to study the effects of the uncertainty on ranking of different DMUs. For applying the robust two-stage DEA models, since in this case number of outputs and intermediate measure is equal to 4, then
is set equal to 4 for all constraints.Also, the perturbations
e
i are set to 0.05 and 0.10, respectively. The value of 4 implies that the system is protected against 100% of the uncertain parameters taking their worst-case value.TABLE 2. The results of two-stage DEA models in 2014
DMU P.
process
Rank D.
process Rank O.
process Rank
DMU1 0.455 9 0.456 11 0.208 14
DMU2 1.000 1 1.000 1 1.000 1
DMU3 0.848 5 1.000 1 0.848 3
DMU4 1.000 1 0.506 9 0.506 11
DMU5 0.534 8 0.505 10 0.269 13
DMU6 0.774 7 1.000 1 0.774 5
DMU7 1.000 1 0.569 8 0.569 9
DMU8 0.955 3 0.392 12 0.374 12
DMU9 1.000 1 0.693 6 0.693 7
DMU10 0.889 4 0.637 7 0.567 10
DMU11 1.000 1 0.945 2 0.945 2
DMU12 1.000 1 0.759 5 0.759 6
DMU13 0.775 6 0.838 4 0.649 8
DMU14 0.973 2 0.863 3 0.840 4
Mean 0.872 - 0.726 - 0.643 -
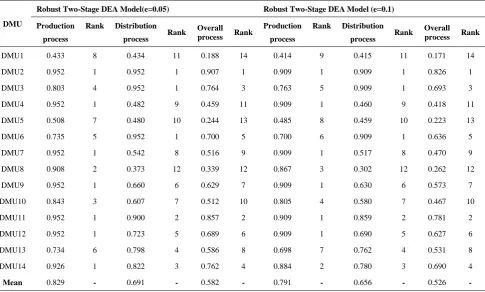
Table 3 summarizes the results of the implementation of our robust model. The results are examined in two different scenarios of e=0.05 and e=0.1.
.
TABLE 3. The results of robust two-stage DEA models
DMU
Robust Two-Stage DEA Model(e=0.05) Robust Two-Stage DEA Model (e=0.1)
Production
process
Rank Distribution
process Rank
Overall
process Rank
Production
process
Rank Distribution
process Rank
Overall
process Rank
DMU1 0.433 8 0.434 11 0.188 14 0.414 9 0.415 11 0.171 14
DMU2 0.952 1 0.952 1 0.907 1 0.909 1 0.909 1 0.826 1
DMU3 0.803 4 0.952 1 0.764 3 0.763 5 0.909 1 0.693 3
DMU4 0.952 1 0.482 9 0.459 11 0.909 1 0.460 9 0.418 11
DMU5 0.508 7 0.480 10 0.244 13 0.485 8 0.459 10 0.223 13
DMU6 0.735 5 0.952 1 0.700 5 0.700 6 0.909 1 0.636 5
DMU7 0.952 1 0.542 8 0.516 9 0.909 1 0.517 8 0.470 9
DMU8 0.908 2 0.373 12 0.339 12 0.867 3 0.302 12 0.262 12
DMU9 0.952 1 0.660 6 0.629 7 0.909 1 0.630 6 0.573 7
DMU10 0.843 3 0.607 7 0.512 10 0.805 4 0.580 7 0.467 10
DMU11 0.952 1 0.900 2 0.857 2 0.909 1 0.859 2 0.781 2
DMU12 0.952 1 0.723 5 0.689 6 0.909 1 0.690 5 0.627 6
DMU13 0.734 6 0.798 4 0.586 8 0.698 7 0.762 4 0.531 8
DMU14 0.926 1 0.822 3 0.762 4 0.884 2 0.780 3 0.690 4
-As we observe, the result of model (7) in Table 3 demonstrate that, for example, when the perturbation is considered to be 0.05, the efficiency of production process ranges from a minimum of 0.433 to 0.952.
Also the result illustrate that the efficiency of distribution process and overall process ranges from 0.373 to 0.952 and 0.188 to 0.907, respectively.
Figures 3, 4 and 5 show a Comparison of efficiency results by traditional Two-stage DEA model and Robust Two-stage DEA model for production, distribution and overall process, respectively.
Figure 3. Comparison of production process efficiency by traditional Two-stage DEA model and Robust Two-stage DEA model.
Figure 4. Comparison of distribution process efficiency by traditional Two-stage DEA model and Robust Two-stage DEA model
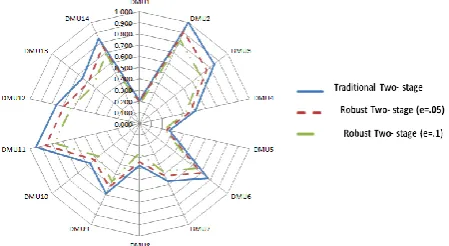
Figure 5. Comparison of Overall process efficiency by traditional Two-stage DEA model and Robust Two-stage DEA model.
By applying different perturbations, the results indicate that, as the perturbation increases from 0.05 to 0.1, the mean of efficiency of production process decreases from 0.829 to 0.791. We can see the same results for distribution process and overall process for different perturbation in robust models. Also, the result demonstrates that when we considered perturbation and as we increased the perturbation in data, the efficiency rankings of decision-making units also have changed. For example in traditional Two-stage DEA model, the ranking of DMU6 and DMU13 in production process are 7 and 6, respectively, while for e=0.05, the ranking of DMU6 and DMU13 in production process changed to 5 and 6 and for e=0.1 changed to 6 and 7, respectively. Similar changes can be observed in distribution process and overall process.
6. CONCLUSION
Performance evaluation of DMUs with network structure is a complex and challenging issue and during recent years, the attention of many researchers has been attracted to this problem. A network consists of multiple processes which are linked together, and efficiency and inefficiency in a stage affect the efficiency and inefficiency in entire network. Also, evaluating the efficiency with uncertain data will lead to a more complex problem. In this paper, we proposed a robust two-stage DEA model in order to evaluate the efficiency of the electrical networks in Iran. The proposed model can handle the uncertainty in outputs and intermediate outputs data without the need to identify the data distribution function. The performance of the proposed method is shown using the data from 14 electric companies in Iran. The results indicate that when the uncertainty level is more, the efficiency scores are smaller. Consideration of perturbation in data and applying robust two stage data envelopment analysis model can be more reliable for efficiency estimating and ranking strategies.
7. REFERENCES
1. Cooper, W.W., Seiford, L.M. and Zhu, J., "Data envelopment analysis: History, models, and interpretations, Springer, (2011). 2. Fare, R. and Grosskopf, S., "Productivity and intermediate
products: A frontier approach", Economics Letters, Vol. 50, No. 1, (1996), 65-70.
3. Castelli, L., Pesenti, R. and Ukovich, W., "DEA-like models for the efficiency evaluation of hierarchically structured units",
European Journal of Operational Research, Vol. 154, No. 2, (2004), 465-476.
5. Lewis, H.F. and Sexton, T.R., "Network DEA: Efficiency analysis of organizations with complex internal structure",
Computers & Operations Research, Vol. 31, No. 9, (2004), 1365-1410.
6. Prieto, A.M. and Zofío, J.L., "Network DEA efficiency in input– output models: With an application to oecd countries",
European Journal of Operational Research, Vol. 178, No. 1, (2007), 292-304.
7. Avkiran, N.K. and McCrystal, A., "Sensitivity analysis of network DEA: Nsbm versus nram", Applied Mathematics and Computation, Vol. 218, No. 22, (2012), 11226-11239. 8. Hahn, J.-S., Kim, D.-K., Kim, H.-C. and Lee, C., "Efficiency
analysis on bus companies in seoul city using a network DEA model", KSCE Journal of Civil Engineering, Vol. 17, No. 6, (2013), 1480-1488.
9. Tone, K. and Tsutsui, M., "An epsilon-based measure of efficiency in DEA–a third pole of technical efficiency",
European Journal of Operational Research, Vol. 207, No. 3, (2010), 1554-1563.
10. Cook, W.D., Zhu, J., Bi, G. and Yang, F., "Network DEA: Additive efficiency decomposition", European Journal of Operational Research, Vol. 207, No. 2, (2010), 1122-1129. 11. Wei, Q. and Chang, T.-S., "Optimal system design
series-network DEA models", Journal of the Operational Research Society, Vol. 62, No. 6, (2011), 1109-1119.
12. Mirhedayatian, S.M., Azadi, M. and Saen, R.F., "A novel network data envelopment analysis model for evaluating green supply chain management", International Journal of Production Economics, Vol. 147, (2014), 544-554.
13. Chen, Y. and Zhu, J., "Measuring information technology's indirect impact on firm performance", Information Technology and Management, Vol. 5, No. 1-2, (2004), 9-22.
14. Chen, Y., Cook, W.D., Li, N. and Zhu, J., "Additive efficiency decomposition in two-stage DEA", European Journal of Operational Research, Vol. 196, No. 3, (2009), 1170-1176. 15. Kao, C., "Efficiency decomposition in network data
envelopment analysis: A relational model", European Journal of Operational Research, Vol. 192, No. 3, (2009), 949-962. 16. Kao, C. and Hwang, S.-N., "Efficiency decomposition in
two-stage data envelopment analysis: An application to non-life insurance companies in taiwan", European Journal of Operational Research, Vol. 185, No. 1, (2008), 418-429.
17. Ben-Tal, A. and Nemirovski, A., "Robust solutions of linear programming problems contaminated with uncertain data",
Mathematical Programming, Vol. 88, No. 3, (2000), 411-424. 18. Ben-Tal, A. and Nemirovski, A., "Robust convex optimization",
Mathematics of Operations Research, Vol. 23, No. 4, (1998), 769-805.
19. Ben-Tal, A. and Nemirovski, A., "Robust solutions of uncertain linear programs", Operations Research Letters, Vol. 25, No. 1, (1999), 1-13.
20. EI-Ghaoui, L. and Lebret, H., "Robust solutions to least-square problems to uncertain data matrices", Sima Journal on Matrix Analysis and Applications, Vol. 18, (1997), 1035-1064. 21. Bertsimas, D. and Sim, M., "Robust discrete optimization and
network flows", Mathematical Programming, Vol. 98, No. 1-3, (2003), 49-71.
22. Bertsimas, D. and Sim, M., "The price of robustness",
Operations Research, Vol. 52, No. 1, (2004), 35-53.
23. Bertsimas, D. and Sim, M., "Tractable approximations to robust conic optimization problems", Mathematical Programming, Vol. 107, No. 1-2, (2006), 5-36.
24. Bertsimas, D., Pachamanova, D. and Sim, M., "Robust linear optimization under general norms", Operations Research Letters, Vol. 32, No. 6, (2004), 510-516.
25. Soyster, A., "Convex programming with set-inclusive constraints and applications to inexact linear programming",
Operations Research, Vol. 21, No. 5, (1973), 1154-1157. 26. Sadjadi, S.J., Omrani, H., Abdollahzadeh, S., Alinaghian, M.
and Mohammadi, H., "A robust super-efficiency data envelopment analysis model for ranking of provincial gas companies in iran", Expert Systems with Applications, Vol. 38, No. 9, (2011), 10875-10881.
27. Gharakhani, M., Kazemi, I. and Haji, H., "A robust DEA model for measuring the relative efficiency of iranian high schools",
Management Science Letters, Vol. 1, No. 3, (2011), 389-404. 28. Torabi, S. and Shokr, I., "A common weight data envelopment
analysis approach for material selection", International Journal of Engineering-Transactions C: Aspects, Vol. 28, No. 6, (2015), 913-921.
A Robust Two-stage Data Envelopment Analysis Model for Measuring Efficiency:
Considering Iranian Electricity Power Production and Distribution Processes
M. Alimohammadi Ardekani, H. Hoseininasab, H. khademizare, M. Fakhrzad
Department of industrial engineering, Yazd university, Yazd-Iran
P A P E R I N F O
Paper history:
Received 28 October 2015
Received in revised form 07 January 2016 Accepted 28 January 2016
Keywords:
Two-stage Data Envelopment Analysis Efficiency
Robust Optimization Uncertainty
هديكچ
ششًپ لیلحت راًتسا دیدج لدم کی ٍلامم هیا (یاَ ٌداد ی
DEA ي دیلًت یاُتکرش ییاراک یبایزرا یارب ار یا ٍلحرم يد )
.دیامو یم ٍئارا قرب غیزًت DEA
رارل ٌدافتسا درًم قرب یاُتکرش رد یا ٌدرتسگ ترًص ٍب یياک ٍىیُب لدم کی ناًىػ ٍب
یتىس یاُلدم .تسا ٍتفرگ DEA
،ییاراک یبایزرا رد ي ٌدرک ٌاگو یلک ترًص ٍب اَ متسیس ٍب ٌدیداو ار یلخاد یاَدىیآرف
یا ٍکبش یاُلدم ،لکشم هیا ٍب ندمآ كئاف یارب .دوریگ یم DEA
یاَدحاي یلک ییاراک ٍلیسي هیدب ات دىتفای شرتسگ
یا ٍکبش یاُلدم عاًوا زا یکی ،یا ٍلحرم يد یاَ لدم .دادرارل ٍیسجت درًم ناًتب ار یریگ میمصت DEA
نآ رد ٍک ٌدًب
خ ٍب ٍیليا یاَ یديري یجيرخ ي طساي یاَ یجير
یتىس یاُلدم .دوًش یم لیدبت ییاُو یاُیجيرخ ٍب سیو طساي یاَ
DEA هیا یؼلاي یایود رد ٍک تسا یلاح رد هیا .دوراد اَ یجيرخ ي اَ یديري یارب كیلد یاَ ٌداد ٍب زایو یا ٍلحرم يد
وا ندًمو رًظىم یارب راًتسا یزاس ٍىیُب یاُشير .ددرگ یمو كمحم ٌداس ضرف یاَ یسیر ٍماورب رد اَ ٌداد رد فارح
دىوام یضایر DEA
.دوا ٌدش ٍئارا یا ٍلحرميد راًتسا لدم ٍلامم هیا
DEA یداُىشیپ لدم .تسا ٌداد ٍؼسًت ار یا ٍکبش
.تسا ٍتفرگ رارل ٌدافتسا درًم ناریا رًشک یاُتسا قرب غیزًت ي دیلًت یاُتکرش یبایزرا یارب ٍلامم هیا