The efficiency of modified powdered activated carbon for removal of
ammonia nitrogen from aqueous solution: a process optimization using RSM
(Response Surface Methodology), adsorption isotherm and kinetic study
Hatam Godini1, Abdollah Dargahi2, Leila Tabandeh3, Mitra Mohammadi3, Yaser Vaziri2, Mir Mohammad Hoseini Ahagh4, Kiomars Sharafi3, Zahra Jalilian3,
1. Department of Environmental Health Engineering, School of Public Health, Alborz University of Medical Sciences, Karaj, Iran
2. Ph.D student of Environmental Health Engineering, School of Public Health, Hamadan University of Medical Sciences, Hamadan, Iran
3. Department of Environmental Health Engineering, School of Public Health, Social Development and Health Promotion Research Center, Kermanshah University of Medical sciences, Kermanshah, Iran
4. Department of Public Health, Khalkhal School of Medicine, Ardabil University of Medical sciences, Ardabil, Iran
Date of submission:20 Jul 2017,Date of acceptance:06 Nov 2017 ABSTRACT
The objective of this study was to determine the performance of modified commercial powdered activated carbon (MCPAC) in removal of ammonia from aqueous solution. The effects of adsorbent dosage (0.5–1.5 g/L), ammonia concentration (100–200 mg/L), pH (3 to 9) and contact time (2 to 120 min) were examined. In this study, experiments were performed based on Response Surface Methodology (RSM). The adsorption isotherm was evaluated using Freundlich and Langmuir models. Kinetics study was analyzed using pseudo first order, pseudo second order and particle penetration kinetic models. By increasing adsorbent dosage, pH and contact time, the removal efficiency increased. According to CCD results, the MCPAC was fitted to a quadratic equation. Also, ammonia adsorption for MCPAC followed the Langmuir (R2 = 0.9831) isotherm model. The
maximum adsorption capacity for MCPAC was 40.323 mg/g. The analysis of adsorption kinetic for MCPAC indicated that ammonia adsorption was well fitted by the pseudo second order kinetic model. As thus, we concluded that MCPAC could be considered as an appropriate and economical alternative adsorbent for water and wastewater treatment due to its high ammonia adsorption capacity.
Keywords:modified activated carbon; ammonia; RSM; aqueous solution; adsorption isotherm
Introduction
Nowadays, industrial and agricultural activities have been increasing, which subsequently leads to discharge of various types of organic and inorganic contaminants into the environment and receiving water. Accordingly, conserving the environment and public health in societies has become a notable challenge.1
Ammonia can have negative impacts on aquatic ecosystems and on public health of
Zahra Jalilian [email protected]
Citation:Godini H, Dargahi A, Tabandeh L, Mohammadi M, Vaziri Y, Hoseini Ahagh M, et al. The efficiency of modified powdered activated carbon for removal of ammonia nitrogen from aqueous solution: a process optimization using RSM
societies.2 Considerable amounts of ammonia
could get into streams as a result of activities like those of the steel industry, fertilizers, refineries, food production factories and glass industries, and are estimated at approximately 45 million tons per year.3,4Thus, elimination or
reduction of ammonia in the receiving environment is necessary. Conventional wastewater treatment plants cannot afford environmental discharge standards. Particularly when notable amounts of wastewater have been discharged into receiving waters, it turns out to be a substantial concern.1 So far, various
carbon has been known to be an effective technology for removal of organic and inorganic contaminants. Recently, application of modified activated carbon has been increased, and satisfactory results have been obtained.8
Adsorption process has been increasingly employed compared to other techniques due to its characteristics such as design flexibility, simple operation and low cost.9,10 Several
methods have been studied by different chemical agents to develop surface-modified activated carbon to add functional groups and porosity on modified activated carbon which, compared to the unmodified type, has been improved.10In a study by Marcano et al. entitled
“Improved Synthesis of Graphene Oxide,” the results showed that modified graphene has high efficiency in removing contaminants. Marcano et al. applied the agents sulfuric acid/ sodium nitrate/ sodium permanganate simultaneously to improve and reinforce graphite electrodes (adding functional groups). This small change in the procedure made the production of highly oxidized GO in a single reaction vessel significantly more practical, compared to other methods.9So far, these three chemicals have not
been used simultaneously to modify the activated carbon, and the removal of ammonia nitrogen by the above-mentioned modified activated carbon has not yet been investigated. Therefore, chemical agents such as sulfuric acid, sodium nitrate and potassium permanganate were used simultaneously to improve powdered activated carbon and to remove ammonia nitrogen from aqueous environments.
In the present study, RSM was applied to analyze and optimize the effect of different variables, including adsorbent dosage, contact time, adsorbate concentration and pH, on ammonia nitrogen removal from aqueous solution. Process optimization by RSM demonstrated the effect of operating variables and also the interactive effects of independent variables on response. Adsorption isotherm was evaluated using Langmuir and Freundlich isotherm models and kinetic study was performed to analyze the adsorption kinetics model.
Materials and Methods ARMA multivariate models
This experimental study was conducted in batch mode and the potential of modified commercial powdered activated carbon (MCPAC) with H2SO4, NaNO3and KMnO4for
removal of ammonia nitrogen from aqueous solution was studied in a pilot scale.
All chemicals and reagents were purchased with a purity of 99.99% from Merck Co., Germany. It should be noted that the deionized water which was procured in a laboratory was used to prepare the desired standard solutions. The commercial powdered activated carbon was purchased from Merck Co., Germany, with code 102183.
Preparation of MCPAC
At first, 5 g of powdered activated carbon was weighted and 69 ml of H2SO4and 1.5 g of
NaNO3 were added to solution. Then, 9 g of
KMnO4 was added to solution slowly and
volume was increased to 500 cc. Temperature was kept below 20 ºC in this step. Then, the solution was heated to 35 ºC and was stirred on magnetic shaker for 7 h. Afterward the solution was cooled to room temperature and furthermore, 400 ml of ice and 3 ml of hydrogen peroxide (30%) were added into the prepared solution. The solution was centrifuged at 4,000 rpm for 4 h. Finally, the supernatant was taken from the solution slowly and remaining solid was washed with 200 ml of distilled water, 200 ml of 30% hydrochloric acid and 200 ml of ethanol. Then, the samples were dried and the prepared solution was sieved (80 mesh). It must be noted that every stage of sampling, storage and the experimentation was carried out based on standard method for water and wastewater examination.11
Determination of adsorbent’s characteristics
transmission spectra, X-ray fluorescence (XRF), and pHzpc.
The system operation
This study was performed at pH: 3, 6, 9 for determination of optimum pH of adsorbent. In order to determine the effect of contact time and pH on ammonia nitrogen removal by MCPAC, the adsorbent dosage of 1.5 g, constant concentration of ammonia nitrogen of l50 mg/L, and contact times of 5, 10, 20, 30, 60, 90 and 120 min were examined. In the next step, in order to determine the effect of adsorbent dosage, the different doses of MCPAC (0.5–1.5 g) were analyzed for removal of initial ammonia nitrogen concentration of 150 mg/L. It should be considered that in alkaline pH a small part of ammonia nitrogen evaporates as NH3.
Therefore, to achieve the amount of pure adsorption, the control samples were analyzed by different concentration of 50, 100 and 200 mg/L and pH: 9 to distinguish the amount of volatile ammonia from the adsorbate amount.
Experimental design and mathematical modeling
In this study, the experiments were designed based on the central composite design (CCD) and analyzed by response surface methodology (RSM) which provided proper statistical tools to design and analyze experiments for process optimization.
A model in the form of Eq. (1) was presented in order to fit the experimental data by optimization. The relationship between response, input and quadratic equation model to predict the optimal variables was identified through the following equation:
Y=β0+ βiXi+ βjXj+ βiiXi2 + βjjXj2 + βijXiXj+…
(1) where Y, i, j, β, X are process response, linear coefficient, quadratic coefficient, regression coefficient and coded independent variables, respectively.12 In the present work, CCD was
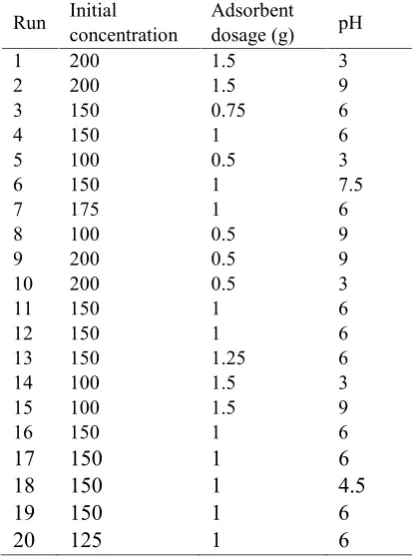
applied to study three different factors, i.e., initial ammonia nitrogen concentration, adsorbent dosage and solution pH. Accordingly, Twenty experiment runs were designed. The
designs consisted of five levels ( − 0.5, − 1, 0, +1, +0.5) with five repetition points in the surface (Table 1). The obtained results, based on CCD, were analyzed by analysis of variance (ANOVA). The results can be demonstrated by 3-Dimensional plots with regard to simultaneous effect of independent variables on the responses as well.
Table 1. Experimental condition designed by Design Expert software
Run Initialconcentration Adsorbentdosage (g) pH
1 200 1.5 3
2 200 1.5 9
3 150 0.75 6
4 150 1 6
5 100 0.5 3
6 150 1 7.5
7 175 1 6
8 100 0.5 9
9 200 0.5 9
10 200 0.5 3
11 150 1 6
12 150 1 6
13 150 1.25 6
14 100 1.5 3
15 100 1.5 9
16 150 1 6
17 150 1 6
18 150 1 4.5
19 150 1 6
20 125 1 6
Determination of adsorption isotherm
Adsorption isotherm of modified activated carbon at eight initial ammonia concentrations of 50–300 mg/L and contact time of 2–120 min were fitted to Langmuir and Freundlich isotherm models. Accordingly, the adsorption of
activated carbon was compared by presented models
and analyzed by the adsorbent efficiency.13
Determination of kinetic reaction
adsorbant components was determined and the adsorption rate using modified activated carbon
was analyzed.
Results and Discussion
FTIR, SEM and XRF analysis
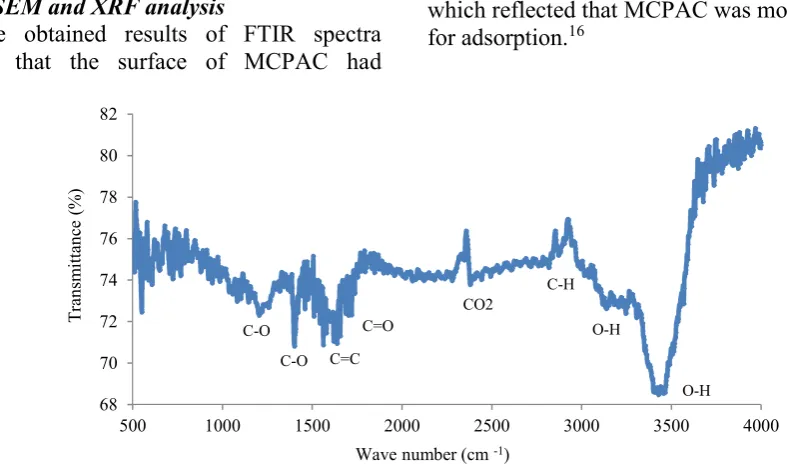
The obtained results of FTIR spectra showed that the surface of MCPAC had
different functional groups. The peaks showed in Fig. 1 for MCPAC are related to C-O groups, carbonyl, CO2, hydroxyl and carboxyl.15
According to FTIR spectra, the modified activated carbon showed the lower transmission which reflected that MCPAC was more capable for adsorption.16
Fig. 1. FTIR spectra of MCPAC
SEM images were employed aiming to observe the surface physical morphology of the adsorbent with magnification of 600, 1,500 and 3,000 (Fig. 2). As is demonstrated, based on the SEM images, noticeable changes appeared in the number of pores at adsorbent surface after modification of powdered commercial activated carbon.
Fig. 2. SEM micrographs (3000X) of MCPAC
Table 2 shows XRF analysis which was performed for MCPAC in order to determine the
chemical compound of adsorbent. The obtained results indicate that the adsorbent, in addition to main composition, has different amounts of other chemical compounds.
Table 2. XRF analysis the MCPAC
Compound Element MCPAC (%) Loss on ignition Carbon 83.02
MgO Magnesium 0.921
3
O
2
Al Aluminum
-2
SiO Silicon 0.9767
5
O
2
P Phosphorus
-3
SO Sulfur 13.66
Cl Chlorine 0.1257
O
2
K Potassium 1.033
CaO Calcium 0.1201
2
TiO Titanium 0.014
MnO Manganese 0.04417
3
O
2
Fe Iron 0.061
Determination of pHZPC
The results of the experiment show that pHZPCwas 5.6 for MCPAC. The results of pHZPC
are shown in Fig. 3.
C-O
C-O C=C
C=O CO2
C-H O-H
O-H
68 70 72 74 76 78 80 82
500 1000 1500 2000 2500 3000 3500 4000
Tra
ns
m
itt
an
ce
(%
)
gg
Fig. 3. The initial solution pH against the final pH in order to determination the pHzpcMCPAC Statistical analysis
According to CCD, the different factors such as adsorbent dosage (A), adsorbate dosage (B), and solution pH (C) were coded. The results
show that maximum ammonia nitrogen removal efficiency by MCPAC was accomplished at 97.08%. The maximum adsorption capacity of ammonia nitrogen by MCPAC reached 79.04 mg/g. The result of model prediction was 79.8 mg/g, which verified the validity and reliability of analysis. In the present study, the degree polynomial models was used for data fitting. The results of variance analysis show that ammonia nitrogen removal efficiency by MCPAC was fitted to quadratic equation.
Also, regression equation, proper model for ammonia nitrogen removal, correlation coefficient (R2), reliability and validity,
standard deviation andP-value are presented in Table 3.
Table 3. ANOVA results for the equation of the Design Expert for MCPAC
Modified equation with significant terms Type ofmodel R2 Adeq.
precision Standarddeviation P-value 91.55+3.43A-5.154B+ 2.545C-5.101B2+0.357AB+
0.587AC+0.58BC Quadratic 0.997 91.299 0.38 <0.05
Effect of adsorbent dosage and adsorbate concentration at different pH
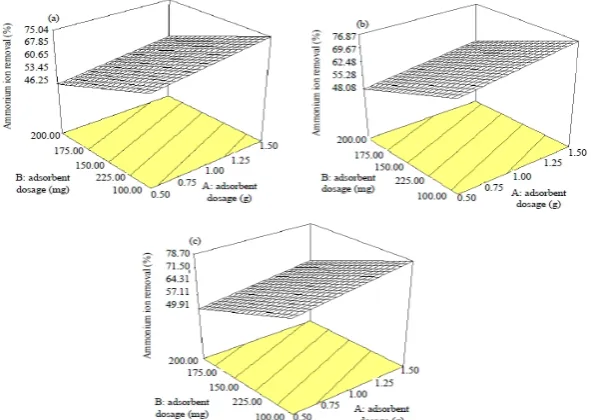
Figure 4 shows the simultaneous effect of adsorbent dosage and adsorbate concentration on ammonia nitrogen removal efficiency at different pH (3-9) using MCPAC. The results
show that by increase of adsorbent dosage and reduction of adsorbate concentration, ammonia nitrogen removal increased. Also, based on Figs. 4 and 5, ammonia removal increased by increasing pH from 3-9.
Fig. 4. Response surface plot for ammonia nitrogen removal by MCPAC at different pH: a) pH= 3, b) pH= 6 and c) pH=9
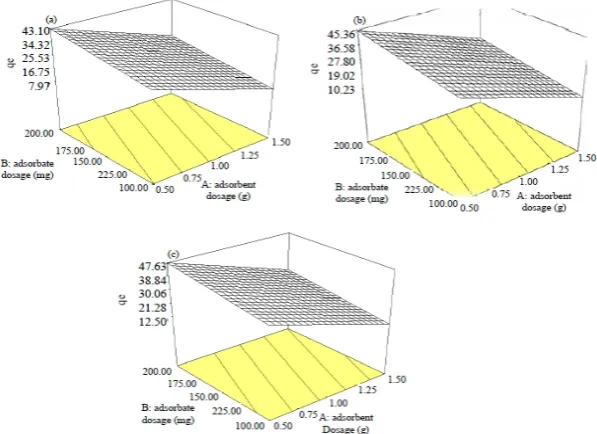
Figure 5 shows the simultaneous effect of
adsorbent dosage and adsorbate concentration on adsorption capacity of ammonia nitrogen byMCPAC at different pH of 3-9. It was observed
y = 1.3906x + 1.3513 R² = 0.9462
0 2 4 6 8 10 12 14
2 4 6 8 10 12
Fi
na
l p
H
0 20 40 60 80 100
0 20 40 60 80 100 120 140
Re
m
ov
al
e
ffi
ci
en
cy
(%
)
Contact time (min)
pH=3 pH=6 pH=9
that by reducing the adsorbent dosage and
increasing the adsorbate concentration, the adsorption capacity of ammonia nitrogen wasincreased.
Fig. 5. Response surface plot for adsorption capacity of ammonia nitrogen by MCPAC at different pH: a) pH= 3, b) pH= 6 and c) pH=9
Effect of solution pH
The simultaneous effect of pH (3, 6 and 9) at different contact times (from 2–120 min), constant concentration of 200 mg/L, and adsorbent dosage of 1.5 g for MCPAC are demonstrated. As can be seen in Fig. 6, the removal efficiency increased when pH increased from 3–9. Therefore, pH: 9 was determined as optimum pH. Our investigation showed that ammonia removal efficiency increased by increase of solution pH. It was related to adsorbent surface that had negative charge at a higher pH than pHzpc, with regard to
the fact that ammonia has been categorized in cationic compounds which create the electrostatic attraction force between adsorbent and targeted contaminant. So, as a result, the removal efficiency was increased. Lesser pH than pHzpcled to increase of the positive charge
at adsorbent surface which created the repulsive force between adsorbent and the cationic contaminant which subsequently reduced the ammonia removal efficiency. In the present study, the isoelectric point (pHzpc) for MCPAC
was 5.6. This finding is consistent with findings of the study by Zhu et al., who investigated the
removal of NH4D-N from aqueous solution by
using activated carbon derived from rice husk.3
Zheng et al. studied rapid and wide pH-independent ammonium removal using a composite hydrogel with three-dimensional networks and maximum adsorption capacity was observed at pH 4–8.15 Effect of Na+
-impregnated activated carbon on the adsorption of NH4+-N from aqueous solution was studied
by Shi et al., and their results showed that the optimum NH4-N removal efficiency was
accomplished at neutral pH.2
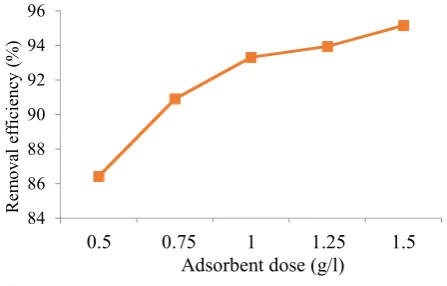
Effect of adsorbent dosage
The obtained results of variant adsorbent dosages on efficiency of ammonia removal by MCPAC demonstrated that nitrogen removal efficiency was increased when the adsorbent dosage increased for MCPAC (Fig. 7). Also, adsorbent dosage of 1.5 g was determined as optimum adsorbent dosage for MCPAC. It has also been found that by increasing the adsorbent dosage, the adsorption capacity decreases, which leads to increase in the efficiency of ammonia removal by MCPAC. By increasing the adsorbent dosage from 0.5–1.5 g/L, adsorption capacity decreased from 79.024 to 30.219 for MCPAC. The increment of adsorbent dosages reflected on the increment of adsorption surface which enhanced the access of contaminant molecules to adsorbate sites over the adsorbent surface that caused the increase of removal efficiency. On the other hand, increasing the adsorbent dosage means faster adsorption of contaminant from solution and decreases the contaminant concentration in the solution. This causes the reduction of available molecules to create the maximum surface coverage that then leads to reduction of the adsorbate contaminant per unit weight of adsorbent. This trend demonstrates that the adsorbate particles over the adsorbent surface with remaining molecules in the solution lead to closing of adsorbent internal pores or cause the accumulation and integration of adsorbent particles, which subsequently leads to decrease in the active sites for adsorption.17 It was also
found that the increase in ammonia removal efficiency was remarkably faster when the adsorbent dosage increased from 0.5–1 g/L, and by increasing the adsorbent dosage from 1–1.5 g/L, the increase of removal efficiency continued with a slower trend.
This means that adsorption occurs faster in adsorbent surfaces at higher adsorbent dosages which leads to decrease of adsorbate in solution compared to lower adsorbent dosages.4 These
findings are identical to the results of the study by Zhu et al. for the removal of NH4D-N from
aqueous solution by using the activated carbons derived from rice husk. The results of Zhu et al.
showed that the removal efficiency of ammonia nitrogen increases significantly by increasing the adsorbent dosage from 0.2–2 g, which reflected that removal efficiency increases from 10.12% to 48.12%.3Also, the results of Hussain
et al. on the physico-chemical method for ammonia removal from synthetic wastewater using limestone and GAC in batch and column studies showed that increasing the adsorbent dosage is related to the increment of contact time and, as a result, the removal efficiency increases.18
Fig. 7. Effect of adsorbent dosage onefficiency ofammonia nitrogen removal (initial ammonianitrogen concentration of 150 mg/L, contact time of 120 min and pH=9)
Effect of ammonia nitrogen concentration
Figure 8 shows the effect of initial ammonia nitrogen concentration on removal efficiency by MCPAC. As can be seen by increasing the ammonia nitrogen concentration from 50 to 300 mg/L, the removal efficiency was then decreased. The maximum removal efficiency was accomplished to 100% by MCPAC. Also, investigation showed that there is little difference in removal efficiency by MCPAC at low concentrations, while as the initial concentration increased, the difference in removal efficiency increased.
The results found that removal efficiency decreased from 90.94% to 52.69% by MCPAC when ammonia nitrogen concentration increased from 50–300 mg/L at constant conditions of other variables, which reflects the fact that adsorption is strongly dependent upon initial concentrations of the solution. The adsorption capacity increased by increasing the
84 86 88 90 92 94 96
0/5 0/75 1 1/25 1/5
Re
m
ov
al
e
ffi
ci
en
cy
(%
)
Adsorbent dose (g/l)
0.5 0.75 1 1.25 1.5
contaminant concentration.19 Because the
adsorbent has specific and limited adsorption sites, more adsorption sites are available at low concentration and subsequently faster adsorption occurred and led to increase of removal efficiency. But, at higher concentrations, by increase of the adsorbate on the adsorbent surface, the adsorption sites over the surface were saturated and, as a result, they reduced the removal efficiency. Adsorption capacity increased by increasing the initial ammonia nitrogen concentration, which may be attributed to interaction between the adsorbent and adsorbate contaminant.19,20 Lebedynets et
al. studied the adsorption of ammonium ions onto a natural zeolite and their results revealed that the adsorbate ammonium ion increased by decreasing the initial concentration and adsorbate volume as well.21
Fig. 8. Effect of initial ammonianitrogen concentration on removal efficiency (adsorbent dosage of 1.5 g, contact time of 120 min and pH= 9)
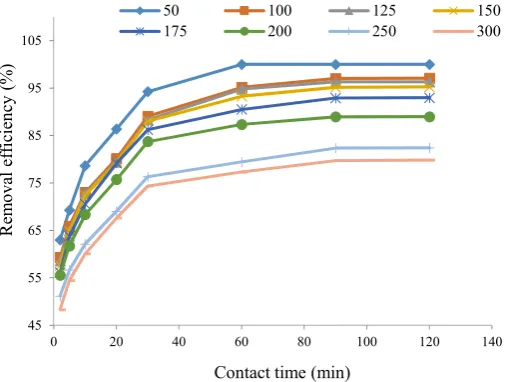
Effect of contact time
Figure 9 shows the effect of contact time on ammonia nitrogen removal efficiency by MCPAC. The results show that by increasing contact time from 2–120 min at different ammonia concentrations, the removal efficiency increased. At beginning of adsorption reactions, due to numerous adsorption sites and notable difference between concentrations of adsorbate material in the solution and the amount of adsorbate material over the adsorbent surface, the removal efficiency increased.16 Over time,
the increasing trend of ammonia removal has continued by moderate slope which may be related to a contaminant layer over the surface. Also, over time, it was becoming difficult to occupy the remaining surface sites because there was a type of repulsion between adsorbed molecules and soluble molecules. The obtained results show that in the first 60 min, more than 80% of ammonia nitrogen was removed by modified adsorbent. Based on experimental results, the adsorption was not much changed after 120 min. In this situation, the adsorbate ammonia nitrogen over the surface was equal to amount of ammonia nitrogen in aqueous solution. So, adsorption equilibrium time was attained in 120 min of contact time. Results of the study of Zabochnicka et al.
Fig. 9. Effect of contact time on efficiency of ammonia nitrogen removal (initial ammonia nitrogen concentration of 50-300 mg/L, adsorbent dosage of 1.5 g and pH=9)
45 55 65 75 85 95 105
0 20 40 60 80 100 120 140
Re
m
ov
al
e
ffi
ci
en
cy
(%
)
Contact time (min)
50 100 125 150
175 200 250 300
75 80 85 90 95 100
0 100 200 300
Re
m
ov
al
e
ff
ic
ie
nc
y
(%
)
regarding the removal of ammonia by clinoptilolite show that by increasing contact time the removal efficiency improved and the adsorption equilibrium was determined at 180 min.22Lebedynets et al.studied the adsorption of
ammonium ions onto a natural zeolite and found that the removal efficiency did not change after 24 h.21 Contradictions in the
findings of the present work with other researches may also be related to structural differences of adsorbent and chemical compounds. But most publications about ammonia removal using various adsorbents have admitted that removal of ammonia nitrogen increases when contact time increases.
Adsorption isotherms
The regression coefficient values were determined for ammonia nitrogen adsorption using the MCPAC by the Langmuir and
Freundlich isotherm models (Table 4). The value of regression coefficient showed that MCPAC followed the Langmuir (R2 = 0.98)
isotherm model.
Table 4. Parameter value of Langmuir and Freundlich isotherm model for MCPAC
Adsorption kinetics
The correlation coefficient values based on different kinetic models (pseudo first order, pseudo second order and particle penetration) demonstrated that the ammonia nitrogen removal by MCPAC followed the second order adsorption kinetic model. The calculated parameters from the kinetic models are presented in Table 5.
Table 5. The calculated parameters of pseudo-first order, pseudo-second order and particle penetration according to adsorbent type for MCPAC
Particle penetration Pseudo-second order Pseudo-first order
2
R kp R2 qe(mg/g) K2 R2 qe(mg/g) K1
0.8599 1.1664 0.9997 30.40 0.0124 0.8543 9.23 0.042
The obtained results from the linear regression coefficient for pseudo first order, pseudo second order and particle penetration for MCPAC found that adsorption kinetic followed the pseudo second order kinetic model.
This means that the adsorption process depends on the adsorbate concentration, because the pseudo second order kinetic model has been established based on adsorption capacity.23 So,
it can be concluded that most of the adsorption in MCPAC takes place through chemical adsorption on the layer over the surface. The results of the present study are consistent with the results of studies from Arslan24, Zhu3 and
also Zheng.25
Conclusion
The results of this study reveal that ammonia nitrogen removal efficiency is more satisfying at alkaline pH for MCPAC. It was observed that the adsorption equilibrium was attained with 120 min of contact time. Also, efficiency of ammonia nitrogen removal
increased by increasing adsorbent dosage and reducing initial ammonia nitrogen concentration. The adsorption isotherm and kinetic study of ammonia nitrogen showed that MCPAC followed the Langmuir isotherm. The kinetic study of adsorbent followed the pseudo second order kinetic model. Also, the results of the central composite design showed that MCPAC was fitted to the quadratic equation, and that the prediction of the model and the experimental findings were in close agreement. It was concluded that MCPAC can be considered as an appropriate and economical alternative for water and wastewater treatment due to the high adsorption capacity of MCPAC.
Acknowledgment
The authors would like to acknowledge the financial support of the Lorestan University of Medical Sciences.
References
1. Xu C, Han H, Jia S, Zhao Q. Influence of phenol on ammonia removal in an intermittent aeration
Freundlich Langmuir
2
R n kf R2 b qe(mg/g)
bioreactor treating biologically pretreated coal
gasification wastewater. Journal of
Environmental Sciences 2016;43:99-105. 2. Naseri S, Heibati B, A Asadi, Golestanifar H,
Dargahi A. Performance Evaluation of Modified Pumice on Removal Nitrate From Aqueous Solution: Kinetic Studies and Adsorption Isotherm. Toloo-e-Behdasht 2013;12(1): 143-154.
3. Zhu K, Fu H, Zhang J, Lv X, Tang J, Xu X.
Studies on removal of NH4+-N from aqueous
solution by using the activated carbons derived from rice husk. Biomass and bioenergy 2012;43:18-25.
4. Guo J, Xu WS, Chen YL, Lua AC. Adsorption of
NH3 onto activated carbon prepared from palm
shells impregnated with H2SO4. Journal of
colloid and interface science 2005;281(2):285-290.
5. Huang L, Li L, Dong W, Liu Y, Hou H. Removal of ammonia by OH radical in aqueous phase.
Environmental science & technology
2008;42(21):8070-8075.
6. Cao Z, Wen D, Chen H, Wang J. Simultaneous Removal of COD and Ammonia Nitrogen Using a Novel Electro-Oxidation Reactor: A Technical and Economic Feasibility Study. International
Journal Of Electrochemical Science
2016;11(5):4018-4026.
7. Duan H-Z, Zeng H-Y, Xiao H-M, Chen C-R, Xiao G-F, Zhao Q. Optimization of ammonia
nitrogen removal by SO42− intercalated
hydrotalcite using response surface
methodology. RSC Advances 2016;6(54):48329-35.
8. Halim AA, Latif MT, Ithnin A. Ammonia removal from aqueous solution using organic acid modified activated carbon. World Applied Sciences Journal 2013;24(1):1-6.
9. Marcano D.C, Kosynkin DV, Berlin JM, Sinitskii A, Sun Z, Slesarev A, et al. Improved Synthesis of Graphene Oxide. ACS Nano. 2010; 4(8): 4806–4814.
10. Anisuzzaman S, Joseph CG, Taufiq-Yap Y, Krishnaiah D, Tay V. Modification of commercial activated carbon for the removal of 2, 4-dichlorophenol from simulated wastewater. Journal of King Saud University-Science 2015;27(4):318-330.
11. Federation WE, Association APH. Standard methods for the examination of water and wastewater. American Public Health Association (APHA): Washington, DC, USA. 2005.
12. Dargahi A, Mohammadi M, Amirian F, Karami A, Almasi A. Phenol removal from oil refinery wastewater using anaerobic stabilization pond modeling and process optimization using
response surface methodology (RSM).
Desalination and Water Treatment 2017;87:199-208.
13. Fu J, Chen Z, Wang M, Liu S, Zhang J, Zhang J, et al. Adsorption of methylene blue by a
high-efficiency adsorbent (polydopamine
microspheres): kinetics, isotherm,
thermodynamics and mechanism analysis. Chem Eng J 2015;259:53-61.
14. Ghaedi M, Ansari A, Habibi M, Asghari A. Removal of malachite green from aqueous solution by zinc oxide nanoparticle loaded on activated carbon: kinetics and isotherm study. Journal of Industrial and Engineering Chemistry 2014;20(1):17-28.
15. Zheng Y, Xie Y, Wang A. Rapid and wide pH-independent ammonium-nitrogen removal using a composite hydrogel with three-dimensional networks. Chem Eng J 2012;179:90-98.
16. Kumar PS, Ramalingam S, Sathishkumar K. Removal of methylene blue dye from aqueous solution by activated carbon prepared from cashew nut shell as a new low-cost adsorbent. Korean Journal of Chemical Engineering 2011;28(1):149-155.
17. Nasuha N, Hameed B, Din ATM. Rejected tea as a potential low-cost adsorbent for the removal of methylene blue. J Hazar Mater 2010;175(1-3):126-132.
18. Hussain S, Aziz HA, Isa MH, Adlan MN, Asaari FA. Physico-chemical method for ammonia removal from synthetic wastewater using limestone and GAC in batch and column studies. Bioresource Technology 2007;98(4):874-880. 19. Wu J, Yu H-Q. Biosorption of 2,
4-dichlorophenol from aqueous solution by
Phanerochaete chrysosporium biomass:
Isotherms, kinetics and thermodynamics. J Hazar Mater 2006;137(1):498-508.
20. Deng H, Lu J, Li G, Zhang G, Wang X. Adsorption of methylene blue on adsorbent materials produced from cotton stalk. Chem Eng J 2011;172(1):326-334.
21. Lebedynets M, Sprynskyy M, Sakhnyuk I, Zbytniewski R, Golembiewski R, Buszewski B. Adsorption of ammonium ions onto a natural zeolite: transcarpathian clinoptilolite. Adsorpt. Sci. Technol 2004;22(9):731-741.
of ammonia by clinoptilolite. Global NEST Journal 2010;12(3):256-261.
23. Gobi K, Mashitah M, Vadivelu V. Adsorptive removal of Methylene Blue using novel adsorbent from palm oil mill effluent waste activated sludge: Equilibrium, thermodynamics
and kinetic studies. Chem Eng J
2011;171(3):1246-1252.
24. Arslan A, Veli S. Zeolite 13X for adsorption of
ammonium ions from aqueous solutions and hen slaughterhouse wastewaters. Journal of the Taiwan institute of chemical engineers 2012;43(3):393-398.