*Corresponding author: Yousif Elnour Yagoub
State Key Laboratory of Cryospheric Sciences/Tian Shan Glaciological Station, Northwest Institute of Eco-Environment and Resources, CAS, 320 Donggang West Road, Lanzhou, 730000, China
ISSN: 0976-3031
Research Article
MONITORING OF DROUGHT IN QINGHAI PROVINCE BY USING STANDARDIZED
PRECIPITATION INDEX (SPI)
Yousif Elnour Yagoub
1,2,3*, Zhongqin Li¹., Omer Said Musa²., Muhammad Naveed Anjum
4.,
Zhang Bo³ and Feiteng Wang¹
1
State Key Laboratory of Cryospheric Sciences/Tian Shan Glaciological Station, Northwest Institute of
Eco-Environment and Resources, CAS, 320 Donggang West Road, Lanzhou, 730000, China
2
University of Khartoum, Faculty of Forestry, Department of Forest Protection and Conservation, Code
13314, Shambat, Sudan
3
Northwest Normal University, College of Geography and Environmental Science, Anning Road,
Lanzhou 730000, P. R. China
4
Division of Hydrology Water-Land Resources, Northwest Institute of Eco-Environment and Resources,
CAS, 320 Donggang West Road, Lanzhou, 730000, China
DOI: http://dx.doi.org/10.24327/ijrsr.2017.0805.0286
ARTICLE INFO ABSTRACT
In this study, we investigate the drought pattern in Qinghai Province for the period between 1961 and 2013. Utilizing the monthly precipitation data of 32 stations and adopting the Standardized Precipitation Index (SPI), we explore the possible drought events in Qinghai Province over the past 53 years. We find a high frequency of drought in the Qinghai Province (on the basis of 12-month SPI index) in 1962, 1966-1967, 1970, 1973, 1986, 1992-1993, 1996 and 2001-2004. We demonstrate that some areas in the eastern Qinghai (including Mangya, Lenghu, Xiaozaohuo, Dachaidan, Ge’ermu, Wudaoliang, Nuomuhong and Tuoyuohe) are changing from humid to drought climate. On the other hand, most of the eastern part of Qinghai Province is changing to humid environment. We demonstrate that the drought is persistently occurring in Qinghai Province with prolonged periods. The degree order of seasonal-SPI drought index in Qinghai Province is: maximum in summer followed by autumn, spring and winter. Findings of this study have significant implications for setting up adaptation and mitigation strategies related to forest and natural resources.
INTRODUCTION
The drought can be defined on the basis of two indicators: (a) environmental indicators (b) water resources indicators (Mawdsley et al., 1994). Drought index is the basis for arid climate research and to measure the extent of the drought in a region (Piara, 2014). Both global climate change and anthropogenic activities are the main driving forces of terrestrial ecosystems (Field, 2001). With the increase in climate warming and intensified anthropogenic activities over the last century (Raupach et al., 2013), socioeconomic drivers are beginning to overwhelm the great forces of nature for some selected processes regionally or even on the global scale (Erb
et al., 2009). Drought is among the major meteorological and
environmental problems facing humanity (Zhang J. et al 2012). Causes and concepts of climate change divided the theories that explain climate change phenomenon into three categories: extraterrestrial, terrestrial, and oceanic and atmospheric changes (Mustafa 2007). Due to the monsoon climate interacted with the complicated geographical landscapes, severe droughts of high frequency are among the most devastating natural disasters in China. According to statistics, the drought affected areas and drought damaged areas have greatly increased in the past 50 years (Wang et al., 2012). Drought has especially affected the agricultural areas over northern China (Wang et al., 2011). Drought indices are continuous functions of rainfall and/or temperature, river
International Journal of
Recent Scientific
Research
International Journal of Recent Scientific Research
Vol. 8, Issue, 5, pp. 17120-17124, May, 2017
Copyright © Yousif Elnour Yagoub et al, 2017, this is an open-access article distributed under the terms of the Creative Commons Attribution License, which permits unrestricted use, distribution and reproduction in any medium, provided the original work is properly cited.
Article History:
Received 18th February, 2017 Received in revised form 10th March, 2017
Accepted 06th April, 2017
Published online 28th May, 2017
DOI: 10.24327/IJRSR
Key Words:
Climate change, Meteorological drought, SPI index, Qinghai Province
discharge or other measurable hydro-meteorological variables, commonly used to quantify the definition of drought (Thornthwaite, 1948). Effective Drought Index (EDI-Byun) and the Reconnaissance Drought Index RDI (Tsakiris et al., 2007) and Standardized precipitation index (SPI) are commonly used for drought analysis. Among them, SPI is more widely used index because of simple calculation and having multiple time scales (Mckee et al. 1993). The world's arid areas are mainly distributed in most parts of Asia, most of the Australia, most of the Africa, western North America and western South America. Among them China drought is particularly prominent, involving a very wide range, mainly in the north-west and northeast regions. And in China, Qinghai Province, located in the dry arid areas of north-west China, is prominent because of more frequent and severe droughts.
MATERIAL AND METHODS
Study area
Qinghai Province has a large variety of ecosystem types, from sub-tropical rain forest in southeast to alpine desert in the north-west. Among all types of land cover vegetation, alpine grassland is the dominant ecosystem, combined cover an area of 715823.8 km2, extending from latitude of 31° 40' - 39° 30' N and longitude of 89° 25 ' - 103° 04' E and altitude 1721 - 8500 m (Figure 1). In addition Table 1 shows the longitude and latitude, altitude and annual precipitation of meteorological stations in Qinghai Province.
Standard Precipitation Index (SPI)
Monthly precipitation records of all available stations in the Qinghai Province were obtained from China meteorological data service (http://data.cma.gov.cn) for the period of 53 years (1961 to 2013). The SPI index was developed by McKee et al. (1993). Details about the SPI index computation can be found in several papers including McKee et al., (1993, 1995), Guttman, (1999) and Khalili et al. (2011). SPI is a simple calculation based on the concept that precipitation deficits over varying periods or time scales. SPI index values based on long-term precipitation may change up to 24 months are not reliable (McKee et al., 1993). The index calculation is simple, consider only the precipitation factor, and having multiple time scales, typically have 1, 3, 12, 24, 36 and 48 months equal time scales. Table 2 shows the threshold values of drought for the normal standardized Pa.
RESULT AND DISCUSSIONS
Variation of the annual precipitation
Figure 2 shows the variations of precipitation anomaly in Qinghai Province over the period of 53 years (1961-2013). We find obvious fluctuations in positive and negative anomalies. The annual distribution of precipitation anomalies is negative in 1962, 1991, 1992, and 200-2002. The annual precipitation negative anomaly corresponding years are mainly dry drought disaster years in Qinghai Province. A continuous series of positive precipitation anomalies is revealed during 2003 - 2013.
Figure 1 The distribution of meteorological stations in Qinghai Province
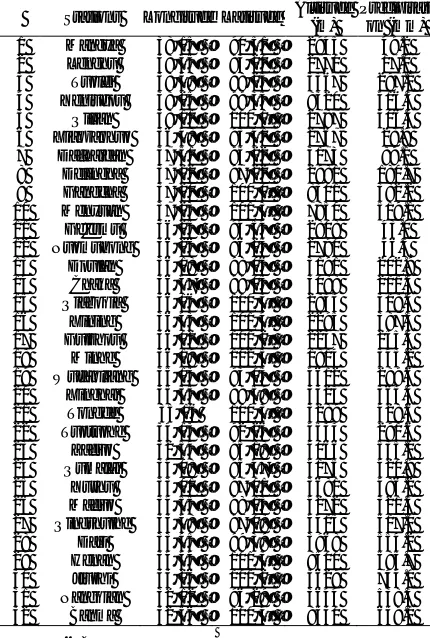
Table 1 The Longitude and latitude, altitude and annual precipitation of meteorological stations in Qinghai
Province
Stations Longitude Latitude Altitude (m)
Precipitati on (mm)
1 Mangya 38°15´ 90°51´ 2945 49.2
2 Lenghu 38°45´ 93°20´ 2770 17.0
3 Tuolei 38°48´ 98°25´ 3367 297.1
4 Yeniugou 38°25´ 99°35´ 8320 416.3
5 Qilian 38°11´ 100°1´ 2787 406.5
6 Xiaozaohuo 36°48´ 93°41´ 2767 28.9
7 Dachaidan 37°51´ 95°22´ 3173 89.1
8 Delingha 37°22´ 97°22´ 2981 180.7
9 Gangcha 37°20´ 100°0´ 8301 382.2
10 Menyuan 37°23´ 101°3´ 7850 519.1
11 Ge'ermu 36°25´ 94°54´ 2808 43.0
12 Nuomuhong 36°26´ 96°25´ 2790 46.5
13 Doulan 36°18´ 98°06´ 3191 202.9
14 Chaka 36°47´ 99°05´ 3088 211.3
15 Qiaboqia 36°16´ 100°3´ 2835 318.3
16 Xining 36°43´ 101°4´ 2295 387.3
17 Guizhou 36°02´ 101°2´ 2237 255.5
18 Minhe 36°19´ 102°5´ 1814 345.2
19 Wudaoliang 35°13´ 93°05´ 4612 289.6
20 Xinghai 35°35´ 99°59´ 3323 365.3
21 Tongde 35°16 100°3´ 3289 428.6
22 Tuotuohe 34°13´ 92°26´ 4533 291.6
23 Zaduo 32°54´ 95°18´ 4066 535.0
24 Qumalai 34°08´ 95°47´ 4175 420.9
25 Yushu 33°01´ 97°01´ 3681 486.2
26 Maduo 34°55´ 98°13´ 4272 321.5
27 Qingshuihe 33°48´ 97°08´ 4415 517.0
28 Dari 33°45´ 99°39´ 3968 554.2
29 Henan 34°44´ 101°3´ 8500 585.7
30 Jiuzhi 33°26´ 101°2´ 3629 744.0
31 Nangqian 32°12´ 96°29´ 3644 538.3
32 Banma 32°56´ 100°4´ 8530 659.0
Table 2 Classification criteria of drought indices in Qinghai Province
Drought category SPI
1 No drought < -0.5
2 Mild drought -0.5 ~-1.0
3 Moderate drought -1.0 ~-1.5
4 Severe drought -1.5 ~ -2.0
5 Extreme drought > -2
Note: Refer to Khalili et al., (2011) and Wang Q. et al., (2015)
17122 |
P a g e
Figure 3 shows the SPI values in the Qinghai Province. SPI is calculated at time scales of 1, 3, 12, 24, 36 and 48-month over the period of 1961 to 2013. Because of shorter temporal scale, a greater frequency of SPI index series is obtained. SPI 12-month shows a high frequency of drought in: 1962, 1966-1967, 1970, 1973, 1986, 1992-1993, 1996 and 2001-2004. 24-month shows the high frequency of drought in 1963-1964, 1966-1967, 1970, 1973, 1979-1981, 1992-1993, 1995-1997 and 2002-2004. A 36-month shows a high frequency of drought in 1965-1966, 1969-1971, 1979-1981, 1993, 1996-1998 and 2003-2004. 48-month shows a high frequency of drought in 1964-1966, 1970, 1980, 996-1998, 2002-2004. The last eight years (from 2006 to 2013) shows no drought condition based on SPI values.
Drought frequency spatial variation
Figure 4 shows the frequency distribution of seasonal and annual-SPI of a total drought category in Qinghai Province during 1961-2013. The high frequency of annual-SPI drought is obtained in Lenghu, Qilian, Delingha, Chaka, Doulan, Qiaboqia, Tongde and Qingshuihe. The high frequency of annual-SPI of mild drought in: Lenghu, Wudaoliang, Delingha, Doulan, Chaka and Qiaboqia; moderate drought in: Dachaidan, Nuomuhong, Zaduo, Dari, Tongde, Guizhou and Henan; severe drought in: Xiaozaohuo, Delingha, Yushu, Xinghai, Gangcha and Xining; and extreme drought in: Xiaozaohuo, Tongde, Qumalai, Yushu, Nangqian, Maduo, Dari and Banma.
Drought trends and mutation detection
Figure 5 shows the trends of annual SPI in Qinghai Province. The annual-SPI forward curve (UF curve) shows that the drought trend was not significant in the 1960s to the 1990s in Qinghai Province which alternating wet and dry cycles; after the 1990s, drought aggravated north-west of Qinghai Province.
Figure 3 SPI index values on 1, 3, 12, 24, 36 and 48-month time scale in Qinghai Province during1961 - 2013
The UF curve is 0.05 % significant level line. The annual-SPI UF curve shows that nearly Qinghai Province in 2000s drought trend is not significant, 2004 is the beginning of mutation detection of the humid.
Actual comparison of SPI drought index in high drought periods
Figure 6 shows the monitoring of SPI drought index in 1962, 1991 and 2001, the actual comparison of SPI index in highest drought periods to monitor the degree of drought in Qinghai Province. The 1962-SPI shows the extreme drought in Maduo, Menyuan and Jiuzhi; severe drought in Xiaozaohuo, Delingha,
Minhe and Xining; moderate drought in Tuolei, Yeniugou, Qilian, Gangcha, Chaka, Guizhou and Dari; and mild drought in Xining, Tongde and Henan. There is no drought look same as 1962-SPEI in the most of middle, southwest and south part. The 1991-SPI drought index shows the extreme drought in Xiaozaohuo, Guizhou; severe drought in Lenghu, Xinghai, Henan and Jiuzhi; Moderate drought in Dachaidan, Ge’ermu and Qiaboqia; and mild drought in Chaka and Xining. The 2001-SPI index shows that the extreme drought in Mangya; severe drought in Xiaozaohuo, Qingshuihe, Banma and Gangcha; Moderate drought in Dachaidan and Minhe; Mild drought in Lenghu, Zaduo, Ge’ermu, Nuomuhong, Maduo, Dari and Henan.
CONCLUSIONS
Drought indices, designed to provide a concise overall picture of droughts, are often derived from massive amounts of hydro-climatic data and are used for making decisions for water resources management and water allocations for mitigating the impact of droughts. In recent years, Qinghai Province is observing intensified climate warming and decrease of precipitation. Frequent trends in arid zone are affecting the region more widely, the economic losses caused by drought is also growing. These situations highlight the need to take comprehensive measures.
This study is focusing in Qinghai Province, using inputs and outputs of SPI index to characterize drought type, severity, and duration, which can assist in identifying appropriate adaptation strategies to minimize the impacts of drought to the agriculture and water sector. This work has a unique contribution for achieving a drought index, which can identify meteorological drought by simply overlaying the maps of the drought index. The use of quantitative SPI for drought management reduces the subjective preferences of decision makers. The SPI is good for the assessment of drought of grassland, wildlife life-threatening and indirect economic losses of grassland ecosystems far beyond the direct economic loss.
This study recommended adapting and mitigating the drought periods: improving livelihoods, agro-ecosystem resilience, agricultural productivity and the provision of environmental services. In addition, we recommended more additional investigations on crops suitable for the Qinghai Province during drought should be carried out for more accurate information, which can be used for crop modeling of appropriate agricultural and water management during drought. Further studies on drought prediction using future climate scenarios in Qinghai Province, using methods presented in this study, will be part of the future direction of this study.
Acknowledgments
The present research is supported by the National Natural Science Foundation of China (Grant no 41471058 and 41641003), the NSFC project (grant number: 91425303), and the SKLCS funding (SKLCS-ZZ-2017).
References
Erb, K.H., 2009. Analyzing the global human appropriation of net primary production-processes, trajectories, implications: an introduction. Ecol. Econ. 69 (2), 250-259.
Figure 5 Interannual variation and Mann-Kendall test of SPI drought index in Qinghai Province during 1961-2013
17124 |
P a g e
Field, C., 2001. Global change. Sharing the garden Science. 294 (5551), 2490-2491.
Guttman, N. B., 1999. Accepting the standardized precipitation index: a calculation algorithm. J of Water Resource Assoc. 35, 311-322.
Khalili, D., Farnoud, T., Jamshidi, H., Kamgar-Haghighi, A.A., and Zand-Parsa, S., 2011. Comparability analyses of the SPI and RDI meteorological drought indices in different climatic zones. Water Resour Manage. 25, 1737-1757.
Mawdsley, J., Petts, G. and Walker, S., 1994. Assessment of drought severity, BHS Occasional Paper, British Hydrological Society.
McKee, T.B., Doesken, N.J. and Kleist, J., 1995. Drought monitoring with multiple time scales. Paper Presented at 9th Conference on Applied Climatology. American Meteorological Society, Dallas, Texas.
McKee, T.B., Doesken, N. J. and Kleist, J., 1993. The relationship of drought frequency and duration to time scales. In: Proc. 8th Conf on Appl Climatol, 17-22 January, Am Meteorol Soc, Mass, 179-184.
Mustafa, M.A., 2007. Desertification processes. Desertification and desert cultivation studies institute (DADCSI) and UNESCO chair on desertification studies, University of Khartoum, press.
Piara, Singh, Nedumaran, and Traore, 2014. Quantifying potential benefits of drought and heat tolerance in rainy
season sorghum for adapting to climate change.
Agricultural and forest meteorology. 185, 37-48.
Raupach, M.R., Quéré C.L., Peters, G.P., Canadell, J.G., 2013. Anthropogenic CO2 emis-sions. Nat. Clim. Change. 3 (7), 603-604.
Thornthwaite, C.W, 1948. An approach toward a rational classification of climate. Geogr Rev 38:55-94.
Tsakiris G. and Vangelis H., 2004. Towards a drought watch system based on spatial SPI. Water Resources Management. 18 (1), 1-12.
Wang, A.H., Lettenmaier, D.P. and Sheffield, J., 2011. Soil moisture drought in China, 1950-2006. Journal of Climate. 24, 3257-3271.
Wang, Q., Li F., Liu B., and Hu L., 2015. Variation in Drought and Its Response to Climate Warming in Qinghai Plateau in Recent 50 Years. ARID ZONE RESEARCH. 32, (1).
Wang, X. J., Zhang J. Y., Shamsuddin S., Amgad E., He, R. M., Bao Z. X. and Ali M., 2012. Water resources management strategy for adaptation to droughts in China. Mitigat. Adaptat. Strategies Global Change 17 (8), 923-937.
Zhang, J., Liu, X., and Yu, C., 2012. Analysis on distribution and variation of drought in Hebei Province. Arid Zone Research. 29 (1), 4l-46.
*******
How to cite this article:
Yousif Elnour Yagoub et al.2017, Monitoring of Drought In Qinghai Province By Using Standardized Precipitation Index (SPI).