International Journal of Engineering
J o u r n a l H o m e p a g e : w w w . i j e . i r
Micro-modeling of Masonry Infilled RC Moment Resisting Frames to Investigate
Arrangement of Compressive Diagonal Struts
M.A. Rahemia, A.A. Tasnimib*, A. Sarvghad-Moghadam a
a Structural Engineering Research Center, International Institute of Earthquake Engineering and Seismology (IIEES), Tehran, Iran b Faculty of Civil and Environmental Engineering, Tarbiat Modares University, Tehran, Iran
P A P E R I N F O
Paper history:
Received 19August2013
Receivedin revised form04 December2013 Accepted 12 December 2013
Keywords: Masonry Infill Panels Micro-modeling Nonlinear Analysis Finite Element Model
A B S T R A C T
Accurate modeling of masonry has been a major concern of the researchers in the past decades. Besides reinforced and unreinforced masonry buildings, masonry elements can be found in frame structures as infill panels which function as partitions and/or external walls.During an earthquake these elements act as structural elements and impose a large degree of nonlinearity on the behavior of framing system. In this study, a micro-modeling procedure is proposed utilizing finite element analysis to model masonry infilled reinforced concrete moment resisting frames (RCMRFs). After calibration using material tests and standard masonry components, the model will be used to predict the behavioral parameters and failure mode of this type of structures. It will be shown that the proposed procedure is substantially successful in estimation of the stiffness and strength and can simulate the failure mode of the infilled RCMRFs tested under semi dynamic lateral loading. Finally, the process of formation and arrangement of compressive struts in different stages of lateral loading in the infill wall will be discussed. As a result, it will be concluded that the proposed modeling strategy can be used as a means to better recognize the seismic behavior of such structures. The developed strategy can also be used to propose new simplified models or precise existing ones such as equivalent diagonal strut model.
doi:10.5829/idosi.ije.2014.27.06c.05
NOTATIONS
c0 Initial interface cohesion Knn Normal stiffness of the interface per unit area E Young's modulus Kss Tangential stiffness of the interface per unit area
ft Tensile strength (the stress at which the crack is created and starts to open) δ The dilatancy shear slip degradation coefficient
' c
f Compressive strength of concrete ε Total strain
fm Compressive strength of mortar εp The strain at which maximum stress occurs in concrete fyL Yield stress of longitudinal reinforcement Φ0 Initial interface friction coefficient
fuL Ultimate stress of longitudinal reinforcement Φr Residual interface friction coefficient fyT Yield stress of transverse reinforcement κ Plastic strain
fuT Ultimate stress of transverse reinforcement κp The plastic strain at which maximum compressive stress occurs in interface
Gfc Fracture energy in compression n Poisson’s ratio I
f
G Mode-I fracture energy σ Normal stress
II f
G Mode-II fracture energy σc Compressive stress
h Crack bandwidth σt: Tensile stress
1. INTRODUCTION
Accurate modeling of masonry infill walls has been a major concern of the researchers in the recent past decades owing to the fact that the infilled frame structures are very common in some parts of the world and on the other hand infill walls are very vulnerable to even moderate earthquakes. Generally there are two distinct approaches to model masonry assemblages [1-3]; modeling and macro-modeling. The micro-modeling is a comprehensive representation of masonry in which all parts of the masonry including units, mortar, and unit/mortar interface are modeled explicitly (detailed micro-modeling). Both units and mortar have linear as well as nonlinear material properties and the interface elements serve as a potential crack/slip [1]. Sometimes a micro-model is adopted by eliminating the mortar layers and expanding the masonry units in a way that the geometry is untouched (simplified micro-modeling).
The present work is focused on the detailed micro-modeling of masonry infilled reinforced concrete moment resisting frames (RCMRFs). It is evident from experimental observations [4-6] that these structures exhibit a highly non-linear inelastic behavior and the most important factors contributing to the nonlinear behavior of infilled frames arise from material nonlinearity [7]. These factors can be summarized as following:
· Infill Panel: cracking and crushing of the masonry, stiffness and strength degradation.
· Surrounding Frame: cracking of the concrete, yielding of the reinforcing bars, local bond slip.
· Panel-Frame Interfaces: degradation of the bond-friction mechanism, variation of the contact length. The only approach that can fully account for all of the nonlinear effects mentioned above and proximately predict the failure mode of the infilled frame is micro-modeling in which each medium is individually modeled and can entail appropriate constitutive models to reproduce the inherent nonlinearity involved.
Some researchers have adopted micro-modeling approach to study the complex behavior of the masonry infilled RCMRFs. Rots [8] studied the detailed brick-joint interaction by modeling bricks with continuum elements and modeling mortar joints with discontinued interface elements in analysis of masonry prisms. Lotfi and Shing [9] developed a dilatant interface constitutive model capable of simulating the initiation and propagation of interface fracture under combined normal and shear stresses in both tension-shear and compression-shear regions which was capable of simulating the dilatancy which is often observed in experiments. They modeled masonry units with smeared-crack elements.
Lourenço and Rots [10] developed an interface elastoplastic constitutive model for the analysis of unreinforced masonry structures in which both masonry units and mortar joints were discretized aiming at a rational unit-joint model able to describe cracking, slip, and crushing of the material. They used their interface model as a simplified micro-modeling tool to analyze masonry shear-walls and showed that their model was capable of accurately predicting the experimental collapse load as well as behavior of the walls. Mehrabi and Shing [11] used a smeared-crack finite element model to model the behavior of concrete in the RCMRFs and masonry units based on the experiments performed by Mehrabi [12] on concrete masonry infilled RCMRFs.
A cohesive interface model to simulate the behavior of mortar joints between masonry units as well as the behavior of the frame-to-panel interface and a smeared-crack finite element formulation was developed by Al-Chaar and Mehrabi [13]. The interface model was able to account for the shearing, residual shear strength, and opening and closing of joints under cyclic shear loads. The proposed model was calibrated using simple material tests and was used to model two of the masonry infilled RCMRFs tested by Mehrabi [12] through detailed micro-modeling approach. The results showed good capabilities for modeling and predicting load-carrying capacity and failure mechanisms for masonry infilled frames, but the presented report lacked enough details about the finite element modeling geometry used to model mortar and masonry/frame interface elements.
Stavridis and Shing [14] combined discrete and smeared-crack approach to investigate the behavior of masonry-infilled non-ductile RC frames. They developed a cohesive crack interface model and used it to model dominant cracks in concrete as well as masonry mortar joints and improved a smeared-crack model to model diffused cracking and crushing in concrete and masonry units. Koutromanos et al.[15] modified this model to account for cyclic crack opening and closing, reversible shear dilatation, and joint compaction to be used under cyclic as well as time-history lateral loading. They showed that the modified method could accurately reproduce the load-displacement response, crack patterns, and failure mechanisms of the infilled frames under dynamic loading conditions.
element constitutive models used in this study are as following:
· a cohesive interface model to simulate the behavior of mortar joints between masonry units and the behavior of frame-to-panel interface
· a smeared-crack finite element formulation to model the concrete in RCMRF and masonry units.
The implemented interface model is capable of accounting for the shearing, residual shear strength, tension softening, combined cracking-shearing-crushing, and crack dilatancy.In the followings, first the general aspects of the used constitutive models are discussed. The models are calibrated using material tests performed by Mehrabi [12]. Then, the basics of the finite element modeling for RCMRF, masonry units, and mortar layers are presented to evaluate the capabilities of the proposed method. For this purpose two of the infilled masonry RCMRFs tested by Mehrabi [12] are modeled and analyzed using DIANA [16] software. Finally, the process of formation of diagonal struts in the infill wall in different stages of lateral loading is investigated which is particularly beneficial in gaining a better understanding of the behavior of masonry infilled RCMRFs and can be used as a means to propose new or precise existing simplified models such as equivalent diagonal strut model.
2. CONSTITUTIVE MODELS
2. 1. Smeared-crack Model The smeared-crack concept, used in this study to model concrete in RCMRF and masonry units, describes a cracked solid by an equivalent anisotropic continuum with degraded material properties in the direction normal to the crack orientation. The approach, introduced by Rashid [17] starts from the notion of stress and strain and permits a description in terms of stress-strain relations. Cracking is specified as a combination of tension cut-off, tension softening, and shear retention.
The softening behavior on the constitutive level is related to the Mode-I fracture energy I
f
G through an
equivalent length or crack bandwidth denoted as h. In the present study, an exponential diagram is chosen for the tension softening of concrete in RCMRF as well as concrete masonry units (Figure 1a).
To model the compressive behavior of the concrete, the Thorenfeldt [18]model is used which is shown in Figure 1b. This model was first used for concrete by Popovics in 1973 [19], and later adapted to high strength concrete by Thorenfeldt. This model can properly regenerate the softening branch of the compressive behavior of the concrete. The effects of confinement and lateral cracking are also considered in the modeling.
2. 2. Dilatant Interface Model The modeling of geometric discontinuities like discrete cracks in concrete, joints in rock and masonry, and bond-slip layers in reinforced concrete is most conveniently done with structural interface elements. These elements relate the forces acting on the interface to the relative displacement of the two sides of the interface.
Various plasticity-based interface constitutive models have been proposed by researchers for masonry structures [9, 20, 21]. In this study, the interface material model, also known as the “Composite Interface Model”, which is appropriate to simulate fracture, frictional slip as well as crushing along the mortar joints in masonry is used. This combined cracking-shearing-crushing model is developed by Lourenço and Rots [10] and is implemented in the DIANA program. The interface model is based on multi-surface plasticity, comprising a Coulomb friction model combined with a tension cut-off and an elliptical compression cap (Figure 2a). Softening acts in all three modes and is preceded by hardening in the case of the cap mode. The yield function for the compression cap is described by a
parabolic hardening rule, followed by
parabolic/exponential softening (Figure 2b). The peak strength fm is reached at the plastic strain κp. Subsequently, the softening branch is entered, governed by the compressive fracture energy Gfc.The interface model is also capable of accounting for the dilatancy of mortar joints. The parameters involved for this purpose are the dilatancy Ψ0 at zero normal confining stress, the confining compressive stress σu at which the dilatancy becomes zero, and the dilatancy shear slip degradation coefficient δ. Note that for tensile stress a stress-independent dilatancy coefficient is assumed.
2. 3. Von Mises Plasticity For nonlinear behavior of embedded reinforcements, von Mises plasticity is used to model yielding of the reinforcement. The hardening characteristics of the steel can also be considered into account by definition of the desired hardening diagram as an input to the ;model.
(a) (b)
(a)
(b)
Figure 2. Interface model and yield function used for the analysis: (a) Plane-stress interface model [10] (b) Yield function for the compression cap [16]
(a)
(b)
Figure 3. Specimen tested by Mehrabi [12]: (a) Loading scheme, (b) Geometry and details of the specimens
3. FINITE ELEMENT IDEALIZATION
In this study, two masonry infilled RCMRFs tested by Mehrabi [12] are modeled in 2-D using finite element program DIANA [16] to demonstrate the performance and effectiveness of the micro-modeling of infilled RCMRFs. For this purpose, different 2-D structural finite element types were used for different parts of the system which are described in the followings.
3. 1. Summary of the Reference Experiment The specimens tested by Mehrabi [12] were half-scale frame models representing the interior bay at the bottom story of a prototype frame.The prototype frame was a six-story, three-bay, RCMRF with a 1372×457 mm tributary floor area at each story. Two types of frames were designed for the prototype structure with respect to the lateral loadings: one with a weak frame and weak infill nominating by WFWI, and one with a weak frame and strong infill nominating by WFSI. The WFWI specimen design was based on the assumption of a strong wind load, and the WFSI specimen design was based on the assumption of equivalent static forces for strong seismic loading. The infill panels were constructed by nominal 92×92×194 mm hollow-core and solid concrete masonry blocks to represent the WFWI and WFSI specimens, respectively. Each tested specimen was subjected to constant vertical loading and monotonically increasing lateral loading with the scheme shown in Figure 3a. The design details of the reference RCMRF (for both specimens WFWI and WFSI) are shown in Figure 3b.
3. 2. Structural Elements Since generally there is a large number of elements in micro-modeling of infilled frames, use of higher order elements often results in extensive computation times without adding too much accuracy into the overall analysis outcome. Therefore, a four-node quadrilateral isoparametric plane-stress element (Q8MEM) is used for modeling RC frames as well as masonry units which is based on linear interpolation and a 2×2 Gauss integration scheme. This element adopts a linear varying normal strain and a constant shear strain over the element area.
For modeling mortar joints, a four-node 2-D interface element (L8IF) is used. This element is an interface element between two lines in a two-dimensional configuration and is based on linear interpolation using 3-point Newton-Cotes integration scheme. This interface element is selected to describe the interface behavior in terms of a relation between the normal and shear tractions and the normal and shear relative displacements across the interface.
displacement field of the structural elements. This implies perfect bond between the reinforcement and the surrounding material. Mehrabi and Shing [11] demonstrated that the use of bond-slip elements between concrete and reinforcement at nodal points has a minimal effect on modeling the behavior of infilled frames. Hence, the use of bond-slip elements for reinforcement does not seem necessary. So in the present study reinforcements in RC frame are modeled using bonded linear two-node BAR elements.
3. 3. Loading Plate and Top Loading Beam To apply lateral and vertical loads to the infilled frame, Mehrabi [13] used steel loading plates at each end of the RC beam and a steel top loading beam as shown in Figure 3a. Since the lateral load in the experiment was applied as a monotonic compressive load, only the left loading plate is modeled in the finite element model using the same Q8MEM elements but with the elastic properties of steel. The top loading beam is modeled with two-node L7BEN beam element using linear-elastic material with steel properties.
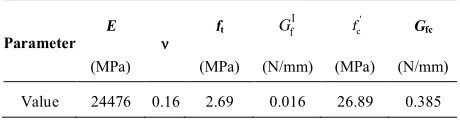
3. 4. RC Frame Model The bounding RCMRF and the longitudinal reinforcement bars were modeled using appropriate elements mentioned in chapter 2. To account for the confinement effects of the lateral reinforcements on the compressive behavior of the concrete, all ties in the columns and the beam were also explicitly modeled with the aforementioned BAR elements but since the foundation remains elastic in the loading procedure, the ties in the foundation were not modeled. The material properties used in the process of the modeling of concrete in RCMRF (as input values for the smeared-crack model) are summarized in Table 1. The description of each parameter can be found in Notation section at the end of the article. All of the values in this table except for the first mode and compressive fracture energies ( I
f
G and Gfc, respectively)
are borrowed from reported values by Mehrabi [12]. The tensile strength of concrete ft is assumed to be 10%
of its compressive strength fc¢. To deduce the values of
I f
G and Gfc there is a need to have data from detailed
tension and compression tests on concrete which were not available. In the absence of such data, the values of these parameters have to be determined indirectly by trial and error in the calibration process or by use of common values recommended in the literature. The latter solution was preferred in this study. Besides, a series of sensitivity analyses performed on different parameters showed that the compressive fracture energy and tensile fracture energy of the bounding RC frame have a small effect on the overall behavior of the RCMRFs.
Reinforcement bars of the frame were modeled with elastic-hardening plastic, two-node discrete bar
elements. The material properties used to model the longitudinal and transverse reinforcement are summarized in Table 2. These values are the same as the values reported by Mehrabi [12].
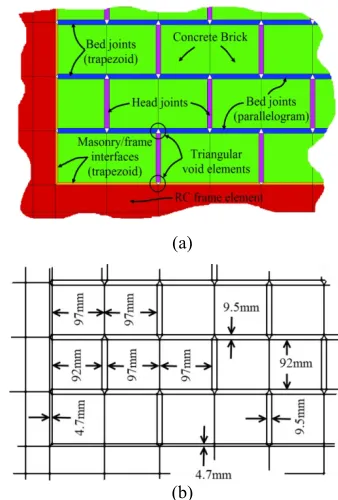
3. 5. Inill Panel Model For modeling masonry units and mortar bed and head joints and joints between the infill and the bounding frame appropriate elements were used as described in section 2. Rotating smeared-crack constitutive model for modeling the concrete and dilatant interface model for modeling the mortar joints were utilized, as described previously. The finite element mesh is shown in Figure 4. The thickness of the head and bed joints is 9.5 mm while the thickness of the horizontal and vertical joints at the interface between masonry wall and RC frame along the circumference of the wall is 4.7 mm.Since the concrete bricks are placed in masonry infill wall with Stretcher (Running) bond pattern, the head joints coincide with the middle of the bricks, forcing the mesh of the bricks to be divided in two for the consistency of using four-node elements for bricks.
TABLE 1. Material properties for modeling concrete in RCMRF
Parameter E n ft
I f
G '
c
f Gfc
(MPa) (MPa) (N/mm) (MPa) (N/mm)
Value 24476 0.16 2.69 0.016 26.89 0.385
TABLE 2. Material properties for modeling reinforcements in RCMRF
Parameter E
n fyL fuL fyT fuT
(MPa) (MPa) (MPa) (MPa) (MPa)
Value 206000 0.30 482.6 551.6 367.5 449.5
On the other hand, these fictitious joints are zero-thickness which makes it impossible to join them to the head and bed joints at the intersection points due to the chosen finite element types. To solve this problem, the bed joint interface element under each brick is divided into two quadrilateral interface elements (parallelogram or trapezoid) and a triangular space is left empty at the intersection of bed and head joints (Figure 5a). The same solution is applied to the intersection of the head and bed joints with circumferential interface elements. The dimensions of the different parts of the masonry wall are shown in Figure 5b.
4. NUMERICAL VERIFICATION
4. 1. Interface Model The capability of the interface model is validated by the results of the direct shear tests conducted on mortar joints by Mehrabi [12]. The constitutive model has been implemented in a one-dimensional four-node 2-D interface element. For the calibration of the model, data from at least three shear tests conducted under different levels of normal stresses are required. In these tests, the concrete blocks were 92×92×194 mm in size, and the mortar had a cement:lime:sand ratio of 1:0.5:4.5 by volume. It is desirable to have data from a tension test and a shear test on mortar joints to deduce the values of I
f
G and II f G .
However, in the absence of data from such tests, the values of these parameters for mortar material are obtained by trial and error in the calibration process. Since the behavior of the interface in shear is supposed to be independent of its tensile behavior, controlling parameters in each case can be separately captured by trial and error. The values of the parameters obtained from the calibration are shown in Table 3. The description of each parameter can be found in the Notation section. In Figure 6, the experimental and numerical results of one of the tests for a hollow concrete block specimen under a normal pressure of 1.03 MPa are compared. Figure 6a shows the capability of the model to simulate the cyclic behavior of mortar joints under a constant normal pressure. In Figure 6b, the normal behavior of the interface under 1.03 MPa normal stress is shown. This normal stress is the confining stress (σu) over which the dilatancy is
supposed to be zero. After the initial elastic contraction under the normal stress, the numerical results exhibit constant normal displacement while the experiment shows further vertical contraction which is negligible in comparison to the dilatancy observed in less normal stresses.
4. 2. Masonry Prism To verify modeling of masonry blocks, two masonry prisms constructed of 3
concrete masonry blocks with 9.5 mm mortar layers tested by Mahrabi [13] were modeled.
(a)
(b)
Figure 5. Finite element specifications of the infill wall:(a) Categories and shapes of the interface elements(b) Dimensions
(a)
(b)
One of these prisms was constructed by hollow concrete blocks and the other one was made of solid blocks. Hollow blocks had a face shell thickness of 15.9 mm. Therefore, the equivalent width of mortar joint for hollow blocks was assumed to be twice the shell thickness, i.e., 31.8 mm.
An equivalent thickness of 45.7 mm for hollow blocks, including face shells and webs, was calculated based on proportion of net concrete cross-section with respect to the gross cross-sections of the block. For the prisms with solid blocks, the thickness of blocks and the width of mortar bed joints were considered to be 92 mm and 89 mm, respectively. Masonry units and mortar layers were modeled using element types and material constitutive models described in section 3. Material parameters used for modeling the concrete in hollow masonry blocks are shown in Table 4.
The compressive strength in this table is the average compressive strength of hollow masonry units with respect to the net cross-sectional area determined by material tests performed by Mehrabi [12]. The material parameters of the solid blocks were assumed to be the same as the hollow blocks except for the compressive strength of solid blocks which was chosen to be 15.86 N/mm2 as reported by Mehrabi [12]. The tensile
strength of each brick type is assumed to be 10% of its compressive strength.The use of values tabulated in Table 3 for interface parameters results in incorrect modeling of the hollow masonry prism in the sense of much lower initial stiffness and maximum stress.
Mehrabi and shing [10] also encountered this problem in their modeling process and used shear stiffness values for bed joints in analysis of infill walls which were considerably larger than those used for their verification studies for individual mortar joints. It was their conclusion that lower values calibrated according to single joint shear testing did not correspond to practical values due to the fact that deformation of the test machine had distorted the joint deformation measurements.
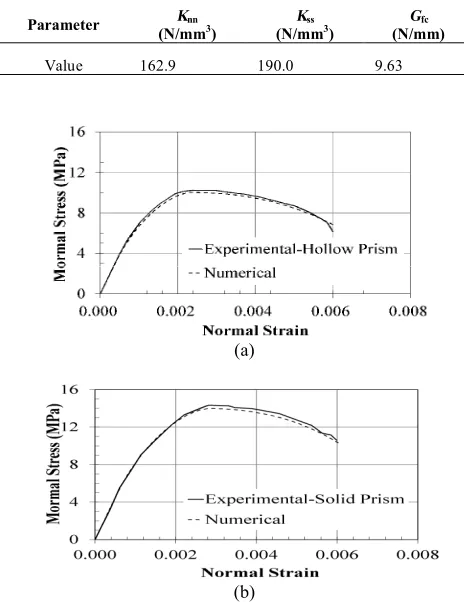
In the current study, the values in Table 5 were used for mortar joints after a calibration process and the resulting numerical curves for hollow and solid masonry prisms are shown in Figures 7(a) and 7(b), respectively. The fracture energy of mortar layer in compression Gfc
was increased to 9.63 N/mm to provide strain at maximum strength and a gradual descending branch (softening) in the normal stress-normal strain curves similar to those obtained from test results. Other parameters not mentioned in Table 5 are the same as Table 3.
The comparison of the experimental results with the results obtained by modifying the parameters of the mortar layer shows that the modeling of masonry prisms under compression is done with an acceptable degree of precision.
TABLE 4. Material properties for modeling hollow concrete masonry bricks
Parameter E n ft GfI fc' e
p Gfc
(MPa) (MPa) (N/mm) (MPa) (N/mm)
Value 13789 0.16 1.65 0.02 16.55 0.006 0.35
TABLE 5. Modified parameter values for modeling mortar in hollow and solid block masonry prisms.
Parameter Knn
(N/mm3) (N/mmKss 3) (N/mm) Gfc
Value 162.9 190.0 9.63
(a)
(b)
Figure 7. Comparison between numerical and experimental results under normal compression:(a) Hollow block masonry prism, (b) Solid block masonry prism
5. INFILLED RCMRF MODELING, RESULTS AND DISCUSSION
properties of these specimens are summarized in section 3. The failure of the first specimen is governed by shearing and slips along masonry bed joints while the failure mode of the other one having a relatively strong infill is governed by diagonal cracking of the infill and shear failure of columns. The accuracy and reliability of an analytical model for simulating the behavior of an infilled frame strongly depend on the capability of the model to predict the load-carrying capacity and failure mechanism as well as estimating the strength and deformations.
5. 1. Hollow Masonry Infilled RCMRF The finite element model of the WFWI specimen was built in DIANA [16] and the material properties of Table 2 for RCMRF and the values obtained in the verification process in section 3 for the mortar layers (Table 3) were assigned to the materials in the model. The vertical loads were applied onto columns and top beam and the lateral load was applied as displacement-control at the left side of the beam. The use of the calibrated values from Table 3 for mortar joint interfaces resulted in less initial stiffness and lateral strength of the analytical model in comparison to the experimental results. To find an agreement between analytical and experimental results, higher stiffnesses needed to be used. While analyzing infilled frames, Mehrabi [12] also encountered this problem and adjusted the normal and shear stiffnesses of mortar joints to several times those calibrated by the laboratory direct shear test results to solve this problem. Similar to the modeling of masonry prisms, the need for adjustment was attributed to the inaccuracy of interface elastic normal and shear displacements of the laboratory test.In the present analysis this made it necessary to perform a calibration study to determine the appropriate values for mortar stiffness parameters to be used in modeling of WFWI specimen.The calibration process revealed that the normal and tangential stiffnesses of the mortar layers should be increased about 8 times in order to match the initial stiffness of the infilled frame with the initial stiffness observed in the experiment, but this increase resulted in divergence of numerical solution at initial stages of the analysis (lateral displacement about 0.4 mm). This divergence occurred with the initiation of shear cracking and slip at interfaces. The continual attempts to solve the convergence problem using smaller step sizes, larger tolerances, or different available solution methods were unsuccessful. As mentioned by Al-Chaar and Mehrabi [13], the cause of the problem was concluded to be the failing of the numerical process of determining the stress on the yield surface in tension-shear or compression-shear corner zones. However, this problem did not occur in the first trial which was using the values from Table 3 due to much lower normal and tangential stiffnesses for mortar layers.To solve this problem, it was decided to keep the
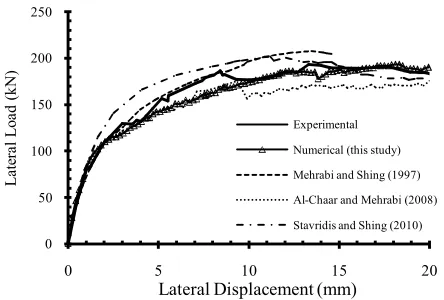
stiffnesses of the interface layers at the lower values from Table 3 (for which a good convergence is expected) and instead, increase the theoritical width of joints to provide the higher overall stiffness requiredfor obtaining agreement with the experimental results.However, to avoid the unrealistic increase in the interface strength due to the increase in its width, the parameters affecting the strength (i.e.,compressive strength, tensile strength, and cohesion) must be reduced by the same proportion the thickness is increased. Table 6 shows the actual and modified parameters (by a factor of 8) used for modeling the mortar layers. The parameters not listed in this table are kept the same as those in Table 3. Figure 8 shows the results of the analysis of WFWI specimen with the modified values and compares them with the experimental results. As it can be seen, there is a good agreement between the numerical and the experimental results in initial stiffness and maximum strength of the infilled frame. The only discrepancy is that the analytical curve cannot follow the increase in the strength of the infilled frame in displacements between 4 and 10 mm and reaches its maximum at the final stages of the analysis (about 18 mm). Moreover, the initial stiffness of the analytical curve is slightly higher than the experimental curve (about 14%) but further attempts to reduce the analytical initial stiffness by decreasing the applied factor to stiffness of the mortar layers also lead to decrease in maximum strength of the infilled frame.In Figure 8, the results of the analytical modeling of the current study are compared with the results obtained by other researcher. The key characteristic values of these curves are summarized in Table 7 including initial stiffness, secant stiffness, maximum lateral strength, and the displacement at which the maximum strength is achieved. The secant stiffness is the effective initial stiffness, which is defined as the secant stiffness between zero load and 50% of the peak load of each curve.
Figure 8. Comparison between experimental and numerical lateral load-displacement curves obtained by present and other studies, specimen WFWI.
0 50 100 150 200 250
0 5 10 15 20
L at er al L oa d (k N)
Lateral Displacement (mm)
Experimental
Numerical (this study)
Mehrabi and Shing (1997)
Al-Chaar and Mehrabi (2008)
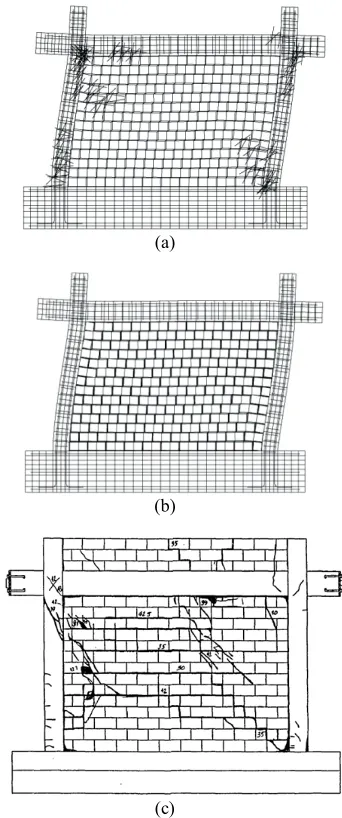
A quick survey on Figure 8 and Table 7 reveals that the current study is more successful in predicting the maximum lateral strength of the WFWI specimen than the studies performed by other researchers, but is not so accurate in estimating the initial as well as the secant stiffness of the system. Unlike the curves from Mehrabi and Shing [11] and Stavridis and Shing [14], the results of this study is almost always a lower bound estimate of the actual experimental curve and yet closer to the reality than the curve from Al-Chaar and Mehrabi [12]. Figures 9(a) and 9(b) show the crack pattern and the deformation of the mortar joints (sum of the elastic and plastic deformations) in the modeled infilled frame at displacement of 20 mm, respectively. Figure 9(c) shows the actual cracks developed in the experimental specimen at the end of the test (displacement of 40 mm). It is evident from these figures that the cracks predicted by the analysis are generally in agreement with the cracks developed at the end of the experiment.
5. 2. Solid Masonry Infilled RCMR Although the results of the modeling of WFWI specimen is in good agreement with the experimental results, it is not enough to conclude that the modeling process is acceptable because some of its parameters are determined by a method of trial and error. Since our model is now calibrated with the WFWI specimen (with weak infill wall), to demonstrate the effectiveness of the modeling procedure, this model must be used to simulate the behavior of another specimen, namely WFSI (with strong infill wall), which is only different from WFWI specimen in the type of the masonry blocks. To accomplish this goal, it is enough to change the thickness of the concrete blocks and mortar layers and to modify the compressive and tensile strengths of
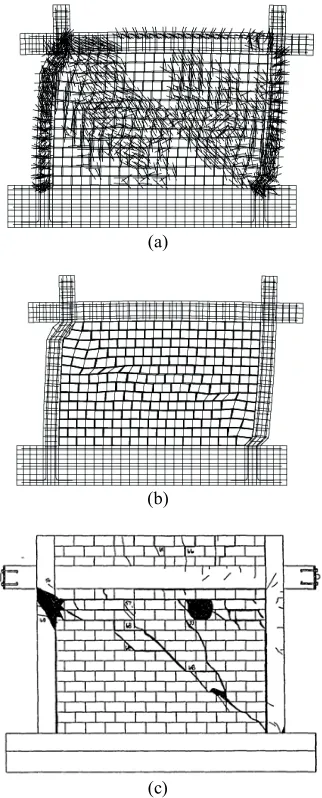
the solid concrete blocks (which are, according to Mehrabi [12] slightly lower than those of the hollow ones). The thickness and compressive strength of the masonry blocks must be changed from 45.7 mm and 16.48 MPa (the values for the hollow concrete blocks) to 92 mm and 15.59 MPa (for the solid masonry blocks), respectively. The tensile strength of the solid concrete blocks is also set to one-tenth of their compressive strength.Table 8 shows the actual and modified values for mortar layer parameters used in the modeling of WFSI specimen. The actual values are borrowed from Mehrabi [12]. The mortar used for construction of this specimen was stronger than the mortar used for WFWI specimen.The model was analyzed using the same loading scheme that was applied to the frame with weak infill. Figure 10 shows the results of the analysis of WFSI specimen. The comparison of the numerical results with the experimental results shows that the numerical curve follows the experimental curve in a general manner up to a displacement of about 18 mm, at which a sudden drop occurs in the analytical curve followed by another one about a displacement of 19 mm. These two drops are associated with the shear failure of the top end of the left (windward) column and bottom end of the right (leeward) column, respectively.
Although this is the actual failure mechanism of WFSI specimen, it does not happenduring the experiment up to the lateral displacement of about 28 mm. The crack pattern and the deformation of the mortar joints (sum of the elastic and plastic deformations) in the modeled WFSI specimen at the displacement of 20 mm and the actual cracks developed in the experimental WFSI specimen at the end of the test (displacement of 40 mm) are shown in Figure 11.
TABLE 8. Actual and modified material properties for modeling mortar joints in WFSI specimen(Modification factor is 8.)
Parameter tb
(mm)
th
(mm)
ti
(mm)
Knn
(N/mm3) (N/mmKss 3) (MPa) ft (MPa) c0 (MPa) fm
Actual value 89 76 89 60.8 76.0 0.28 0.28 13.79
Modified value 712 608 712 7.6 9.5 0.035 0.035 1.72
TABLE 9. Characteristic parameters of analytical lateral load-lateral displacement curves for WFSI specimen
Initial stiffness
(103kN/m) Secant stiffness (103kN/m) Max. lateral strength (kN) Displacement at Max. strength (mm)
Experiment 190* 108.3 291.1 7.1
Numerical study 229.8 122.6 280.3 10.8
Mehrabi and Shing (1997) 659.8 136.8 322.3 10.6
Al-Chaar and Mehrabi (2008) 271.9 120.5 265.8 10.9
Stavridis and Shing (2010) 776.5 275.9 286.6 6.0
The high density of the cracks in RCMRF and solid concrete blocks in comparison to the visible cracks in experimental specimen along with the difference between the numerical and experimental curves in displacements between 1.5 to 8.0 mm as shown in Figure 11 and also the early shear failure of the columns show the excessive damage propagation in the finite element model of WFSI specimen.
Also in Figure 10, the numerical results of the finite element analysis of WFSI specimen are compared with the results of the modeling of other researcher. As it can be seen, the best performance with respect to the general trend of the curves belongs to Al-Chaar and Mehrabi [12]. The characteristic values corresponding to different curves in Figure 10 are tabulated in Table 9. Since the recorded data by Mehrabi [12] for lateral load-lateral displacement of WFSI specimen has fluctuations at its beginning elastic part, the value for the initial stiffness of the experimental curve in this table is not exact and has been approximated to be 190×103 kN/m.
With a swift glance through Table 9, it is apparent that the current study is fairly successful in estimating the initial and secant stiffness of WFSI specimen (with an accuracy of 20%). Although the displacement at which the maximum strength is achieved is not correctly estimated, the maximum strength of the infilled frame is evaluated with an accuracy of 5%. Hence, it can be stated that the proposed modeling strategy leads to acceptable result with acceptable precision at least for the key parameters dealt with in the field of modeling masonry infilled RCMRFs.
6. DISCUSSION ON FORMATION OF COMPRESSIVE STRUTS
To show the application of the proposed micro-modeling strategy to reach a better understanding of the behavior of masonry infilled RCMRFs, the process of formation and arrangement of compressive struts in the masonry infill panel under lateral loading is discussed. To achieve this goal, the two specimens modeled in previous sections are considered. In addition, to demonstrate the ability of the method to be used in other conditions of the infill panel, another infilled RCMRF is also considered in which the infill panel is constructed with clay bricks (instead of concrete blocks) and contains a central window opening.
6. 1. Hollow Masonry Inilled RCMRF Figure 12 shows the deformed shape and compressive principal stress contours in the RCMRF and masonry wall for WFWI specimen at different stages of the lateral deformation. Figure 12a shows the model after the application of the vertical load. As it is shown in Figure 12b, along with the initiation of application of the lateral load at the upper beam level, two compressive struts are
formed in the infill wall, shown by two double sided arrows. With increase in the deformation, the compressive strut developed at the windward section of the wall tends to move down from the beam-column joint and leans against the upper part of the left column (Figure 12c). Although its compressive force rises, the width and location of the other strut does not change significantly. Finally, the struts move back together and their slope increase as the infilled frames reaches its maximum strength. At this stage, except for a narrow nearly vertical band in the middle, the whole infill wall is under compression and the struts are actually widened (Figure 12d). After this phase, the failure of the specimen occurs by shearing and slip along masonry bed joints (not shown in the figure).
(a)
(b)
(c)
Figure 10. Comparison between experimental and numerical lateral load-displacement curves obtained by present and other studies, specimen WFSI
(a)
(b)
(c)
Figure 11. Crack pattern in frame elements, concrete blocks, and mortar joints corresponding to the relevant displacement, specimen WFSI:(a) Frame elements and concrete blocks at 20 mm,(b) Total mortar joints deformation at 20 mm, (c) Crack pattern at the end of experiment at 40 mm.
(a)
(b)
(c)
(d)
Figure 12.Formation of compressive struts for WFWI specimen corresponding to various displacements: (a) zero, (b) 2 mm, (c) 10 mm, and (d) 20 mm
0 50 100 150 200 250 300 350
0.0 2.5 5.0 7.5 10.0 12.5 15.0 17.5 20.0
L
at
er
al
L
oa
d
(k
N)
(a)
(b)
(c)
(d)
(e)
(f)
Figure 13. Formation of compressive struts for WFSI specimen corresponding to various displacements: (a) zero, (b) 2 mm, (c) 6 mm, (d) 16 mm, (e) 18 mm, and (f) 20 mm
6. 2. Solid Masonry Inilled RCMRF Similar to WFWI specimen, the process of formation of the compressive struts in WFSI specimen is shown in Figure13. Figure 13a shows WFSI specimen after the application of the gravitational load. Application of the lateral displacement creates a stress field in the infill wall in which two compressive struts, although not completely recognizable, can be identified (Figure 13b). With the increase in the lateral displacement, the two struts can be distinguished clearly and similar to WFWI specimen, the left strut moves away from the beam-column joint down to the upper part of the left beam-column (Figure 13c). Due to the excessive compressive stress, solid bricks fail in the middle parts ofthe struts, forcing the struts to recede even more from each other and intersect with the adjacent frame at the middle of the columns.
At this moment, a third compressive strut, having a steeper inclination, is formed between the two old struts which pushes upward the central part of the beam (Figure 13d). The two struts at the sides of the wall vanish with the occurrence of shear failure in the two columns (Figure 13e) and finally the middle strut also disappears after the failing of the infill wall in shear (Figure 13f). Figures 12 and 13 show that replacing the infill wall with only one compressive diagonal strut does not agree with the reality and at least two struts must be used to reflect the actual situation of the infill wall in a RCMRF in equivalent diagonal strut models.
constructed with half-scale clay bricks (specifically made by half-scale casting molds) and the average thickness of the bed and head joints are about 5 and 7 mm, respectively. The 2000 1350´ mm infill wall has a thickness of 100 mm and contains a 575×575 mm window opening. The geometry and details of the specimen is shown in Figure 14a.
An axial load of about 15 percent of axial strength of columns was applied to each column by four post-tensioned vertical steel rods and afterwards the cyclic lateral load was applied via a hydraulic displacement-controlled actuator at the level of top beam. Figure 14b shows the lateral load versus lateral drift for the infilled RCMRF.
The specimen was modeled with the same micro-modeling strategy described in previous sections with appropriate material parameters obtained from material tests (when available) and literature. The only difference was the modeling of the infilled panel in which due to the bricklaying pattern, each longitudinal brick had to be divided into three parts in order to maintain the compatibility of mortar interface elements between adjacent bricks (Figure 14c).Figure 15 shows the compressive stress contours and deformed shape of the infill wall resulted from finite element analysis of the model at different lateral load stages. In Figure 15a, the infill wall after the application of vertical load on frame columns before applying the lateral loadis shown. With application of the first step of lateral load (Figure 15b and (b) point in Figure 14b), two wide diagonal compressive struts are formed in the two sides of the window opening.
(a)
(b)
(c)
Figure 14. Tested clay brick infilled RCMRF specimen:(a) Geometry and details, (b) Lateral load-drift curve,(c) Model elements for numerical analysis
(a)
(b)
(d)
(e)
(f)
(g)
Figure 15. Formation of compressive struts for tested RCMRF specimen corresponding to lateral drifts: (a) zero; (b) 0.03%; (c) 0.7%; (d) 1.7%; (e) 3.4%; (f) 4.8%; and (g) 7.5%.
At this stage, the system is behaving elastically and the stress concentration at the corners of the opening is visible in the figure. As the lateral deformation increases, the leeward diagonal strut converts into two parallel struts one of which passes beside the corner of the opening (Figure 15c) and the signs of formation of two broken, less steep struts in the top and bottom spandrel beams appear (Figure 15d). These spandrel
struts are not very strong and do not largely contribute to the lateral resistance of the infilled frame. At the drift of 1.7%, the windward diagonal strut also converts into two parallel struts. Initiating at the upper right and lower left corners of the opening, the diagonal cracks penetrate into the diagonal struts’ region and weaken them resulting in the reduction of the lateral resistance of the specimen (Figures 15e and 15f). At the end of the analysis (drift of 7.5%), due to failure of clay bricks under compression, most of the struts completely vanish and the entire vertical load transferred from the RC beam to the wall is sustained by one diagonal struts (Figure 15g).
A rapid inspection of the figures shown in this section suggests this idea that the micro-modeling of the masonry infilled RCMRFs can be used as a means to better recognize the behavior of this type of structures and help the researchers better identify the place, width, and time of formation of the compressive struts to be utilized in the macro-modeling of the masonry infilled RCMRFs. This can be particularly useful when the experimental results are limited since after calibration of the numerical model with the existing experimental data, the model can be analyzed almost without restriction to assess the effects of different parameters involved in the analysis on the global behavior of the masonry infilled RCMRFs.
7. CONCLUSION
Two appropriate constitutive models for modeling mortar and concrete in masonry infilled RC moment resisting frames (RCMRFs) were reviewed and their implementation in the DIANA finite element program was discussed. To demonstrate the possibility of micro-modeling of masonry infilled RCMRFs, a series of half-scale experiments on this type of structures performed by Mehrabi [12] was considered. Using available material tests, numerous characteristic parameters involved in the modeling process of different parts of the masonry infilled RCMRFs were partly calibrated but the lack of a complete and detailed set of tests on the masonry constituents and assemblages made it necessary to use one of the specimens as the calibration specimen to finalize some of the parameters involved. The finite element model was calibrated based on an infilled RCMRF constructed with hollow concrete blocks (WFWI specimen) and could properly regenerate its lateral behavior.
results of the experiment. It was shown that the proposed modeling strategy can acceptably estimate the key characteristic parameters of the behavior of the solid masonry infilled RCMRF including initial stiffness, secant stiffness, and maximum lateral strength. It was also shown that the proposed method can successfully simulate the failure mode of the modeled masonry infilled RCMRFs.
The formation of the compressive struts and the variations in their geometry in different stages of lateral deformation of both weak and strong masonry infilled RCMRFs as well as the clay brick infilled RCMRF tested by the authors at IIEES were discussed. It was concluded that the micro-modeling of the masonry infilled RCMRFs can serve as a means to better recognize the behavior of such structures and to propose new or precise existing simplified models such as equivalent diagonal strut model.
8. ACKNOWLEDGMENTS
The valuable cooperation of the structural laboratory of the International Institute of Earthquake Engineering & Seismology (IIEES) in carrying out the authors’
experimental study is hereby gratefully acknowledged.
9. REFERENCES
1. Lourenço, P., "Computational strategies for masonry structures", (1996).
2. Guinea, G., Hussein, G., Elices, M. and Planas, J., "Micromechanical modeling of brick-masonry fracture", Cement
and Concrete Research, Vol. 30, No. 5, (2000), 731-737.
3. Sutcliffe, D., Yu, H. and Page, A., "Lower bound limit analysis of unreinforced masonry shear walls", Computers & Structures, Vol. 79, No. 14, (2001), 1295-1312.
4. Crisafulli, F.J., "Seismic behavior of reinforced concrete structures with masonry infills", University of Canterbury, Christchurch, PhD Dissertation, (1997),
5. Zarnic, R. and Tomazevic, M., "An experimentally obtained method for evaluation of the behaviour of masonry infilled r/c frames", in 9th World Conference on Earthquake Engineering, San Francisco, USA. Vol. 6, (1984), 863-870.
6. Al-Chaar, G., Non-ductile behavior of reinforced concrete frames with masonry infill panels subjected to in-plane loading., DTIC Document.(1998)
7. Crisafulli, F., Carr, A. and Park, R., "Analytical modelling of infilled frame structures-a general review", Bulletin-New
Zealand Society for Earthquake Engineering, Vol. 33, No. 1,
(2000), 30-47.
8. Rots, J., "Numerical simulation of cracking in structural masonry", Heron, Vol. 36, No. 2, (1991), 49-63.
9. Lotfi, H.R. and Shing, P.B., "Interface model applied to fracture of masonry structures", Journal of Structural Engineering, Vol. 120, No. 1, (1994), 63-80.
10. Lourenço, P.B. and Rots, J.G., "Multisurface interface model for analysis of masonry structures", Journal of Engineering
Mechanics, Vol. 123, No. 7, (1997), 660-668.
11. Mehrabi, A.B. and Shing, P.B., "Finite element modeling of masonry-infilled rc frames", Journal of Structural
Engineering, Vol. 123, No. 5, (1997), 604-613.
12. Mehrabi, A.B., "Behavior of masonry-infilled rc frames subjected to lateral loading", University of Colorado, Boulder, PhD Dissertation,, (1994),
13. Al-Chaar, G.L. and Mehrabi, A., Constitutive models for nonlinear finite element analysis of masonry prisms and infill walls., DTIC Document.(2008)
14. Stavridis, A. and Shing, P., "Finite-element modeling of nonlinear behavior of masonry-infilled rc frames", Journal of
Structural Engineering, Vol. 136, No. 3, (2010), 285-296.
15. Koutromanos, I., Stavridis, A., Shing, P.B. and Willam, K., "Numerical modeling of masonry-infilled rc frames subjected to seismic loads", Computers & Structures, Vol. 89, No. 11, (2011), 1026-1037.
16. Bv, T.D., "Diana finite element analysis user’s manual release 9.3", Delft, The Netherlands, (2008).
17. Rashid, Y., "Ultimate strength analysis of prestressed concrete pressure vessels", Nuclear Engineering and Design, Vol. 7, No. 4, (1968), 334-344.
18. Thorenfeldt, E., Tomaszewicz, A. and Jensen, J., "Mechanical properties of high-strength concrete and application in design", in Proceedings of the Symposium “Utilization of High Strength Concrete. (1987), 149-159.
19. Popovics, S., "A numerical approach to the complete stress-strain curve of concrete", Cement and Concrete Research, Vol. 3, No. 5, (1973), 583-599.
20. Giambanco, G. and Di Gati, L., "A cohesive interface model for the structural mechanics of block masonry", Mechanics
Research Communications, Vol. 24, No. 5, (1997), 503-512.
21. Reyes, E., Gálvez, J., Casati, M., Cendón, D., Sancho, J. and Planas, J., "An embedded cohesive crack model for finite element analysis of brickwork masonry fracture", Engineering
Micro-modeling of Masonry Infilled RC Moment Resisting Frames to Investigate
Arrangement of Compressive Diagonal Struts
M. A. Rahemia, A. A. Tasnimib, A. Sarvghad-Moghadam a
a Structural Engineering Research Center, International Institute of Earthquake Engineering and Seismology (IIEES), Tehran, Iran b Faculty of Civil and Environmental Engineering, Tarbiat Modares University, Tehran, Iran
P A P E R I N F O
Paper history:
Received 19 August 2013
Received in revised form 04 December2013 Accepted 12 December 2013
Keywords: Masonry Infill Panels Micro-modeling Nonlinear Analysis Finite Element Model
هﺪﯿﮑﭼ
لﺪﻣ
ﻪﻏﺪﻏدزاﯽﮑﯾهراﻮﻤﻫﯽﯾﺎﻨﺑﺢﻟﺎﺼﻣﻖﯿﻗد يزﺎﺳ
ﻪﻫدرد ﻦﯿﻘﻘﺤﻣﯽﻠﺻايﺎﻫ
ﺖﺳاهدﻮﺑﻪﺘﺷﺬﮔيﺎﻫ
.
ردﯽﯾﺎﻨﺑيﺎﻀﻋا
نﺎﻤﺘﺧﺎﺳ
بﺎﻗ ردوﯽﻠﺻاﺮﺻﺎﻨﻋناﻮﻨﻋﻪﺑﺢﻠﺴﻣﺮﯿﻏوﺢﻠﺴﻣﯽﯾﺎﻨﺑيﺎﻫ
ندﺮﮐاﺪﺟياﺮﺑبﺎﻘﻧﺎﯿﻣناﻮﻨﻋﻪﺑﯽﻧﺎﻤﺘﺧﺎﺳيﺎﻫ
ﺎﯾوﺎﻫﺎﻀﻓ
ﯽﻣهدﺮﺑرﺎﮑﺑﯽﺟرﺎﺧيﺎﻫراﻮﯾد
دﻮﺷ . هزﺎﺳيﺎﻀﻋاﻪﺑﺎﺜﻣﻪﺑﺎﻀﻋاﻦﯾا،ﻪﻟﺰﻟزداﺪﺧرمﺎﮕﻨﻫرد
وهدﺮﮐﻞﻤﻋيا
هزﺮﻟرﺎﺘﻓر
هزﺎﺳبﺎﻗيا
ﯽﻣﯽﻄﺧﺮﯿﻏتﺪﺷﻪﺑاريا
ﺪﻨﻨﮐ .
لﺪﻣﺰﯾرشورﮏﯾ،ﺮﺿﺎﺣﻪﻌﻟﺎﻄﻣرد
ﻞﯿﻠﺤﺗزاهدﺎﻔﺘﺳاﺎﺑيزﺎﺳ
لﺪﻣرﻮﻈﻨﻣﻪﺑدوﺪﺤﻣياﺰﺟا
بﺎﻗيزﺎﺳ
ﻠﺴﻣﻦﺘﺑﯽﺸﻤﺧيﺎﻫ
نﺎﯿﻣﺢ
ﺖﺳاهﺪﺷدﺎﻬﻨﺸﯿﭘﺮﭘ
.
هدﺎﻔﺘﺳاﺎﺑلﺪﻣﯽﺠﻨﺳاوزاﺲﭘ
ﻪﻧﻮﻤﻧ يور ﺮﺑ ﺶﯾﺎﻣزآﺞﯾﺎﺘﻧ زا
ﺶﯿﭘ رﻮﻈﻨﻣ ﻪﺑ هﺪﺷ ﻪﺘﺧﺎﺳ لﺪﻣ ،ﯽﯾﺎﻨﺑ ﺢﻟﺎﺼﻣيﺎﻫﺪﺣاو وﯽﯾﺎﻨﺑ دراﺪﻧﺎﺘﺳا يﺎﻫ
ﯽﻨﯿﺑ
ﯽﮔﮋﯾو
هزﺎﺳزاعﻮﻧﻦﯾاﯽﮕﺘﺨﯿﺴﮔﻞﮑﺷويرﺎﺘﻓريﺎﻫ
راﺮﻗهدﺎﻔﺘﺳادرﻮﻣﺎﻫ
ﺖﺳاﻪﺘﻓﺮﮔ
. نﺎﺸﻧﻖﯿﻘﺤﺗﻦﯾارد ﯽﻣهداد
دﻮﺷ
ﯽﻣوهدﻮﺑﻖﻓﻮﻣهزﺎﺳﺖﻣوﺎﻘﻣوﯽﺘﺨﺳﻦﯿﻤﺨﺗرد،هﺪﺷﻪﺋاراشورﻪﮐ
بﺎﻗﯽﮕﺘﺨﺴﯿﮔﻞﮑﺷﺪﻧاﻮﺗ
ﺢﻠﺴﻣﻦﺘﺑﯽﺸﻤﺧيﺎﻫ
نﺎﯿﻣ
ﻪﯿﺒﺷﯽﮑﯿﻣﺎﻨﯾدﻪﺒﺷﯽﺒﻧﺎﺟرﺎﺑﺖﺤﺗارﺮﭘ
ﺪﻨﮐيزﺎﺳ
.
ﻞﮑﺷﺪﻧور،مﺎﺠﻧاﺮﺳ
ﮏﺘﺳديﺮﯿﮔ
راﻮﯾدﻞﺧادرد يرﺎﺸﻓيﺎﻫ
ﯽﺒﻧﺎﺟيراﺬﮔرﺎﺑ ﻒﻠﺘﺨﻣﻞﺣاﺮﻣرد هﺪﻨﻨﮐﺮﭘ
ﺖﺳاﻪﺘﻓﺮﮔ راﺮﻗﺚﺤﺑدرﻮﻣ
.
دﺮﺒﻫارﻪﮐﺪﻫد ﯽﻣنﺎﺸﻧ هﺪﻣآﺖﺳﺪﺑ ﺞﯾﺎﺘﻧ
لﺪﻣ
ﯽﻣهﺪﺷدﺎﻬﻨﺸﯿﭘيزﺎﺳ
هزﺮﻟرﺎﺘﻓرﺮﺘﻬﺑكردياﺮﺑيراﺰﺑاناﻮﻨﻋﻪﺑﺪﻧاﻮﺗ
هزﺎﺳﻦﯿﻨﭼيا
دﺎﻬﻨﺸﯿﭘياﺮﺑﻦﯿﻨﭽﻤﻫوﯽﯾﺎﻫ
لﺪﻣ
لﺪﻣﻖﯿﻗﺪﺗﺎﯾﺪﯾﺪﺟهدﺎﺳيﺎﻫ
هدﺎﻔﺘﺳادرﻮﻣلدﺎﻌﻣيﺮﻄﻗﺪﯿﻗلﺪﻣﻪﻠﻤﺟزادﻮﺟﻮﻣيﺎﻫ
دﺮﯿﮔراﺮﻗ .
doi:10.5829/idosi.ije.2014.27.06c.05
![Figure 1. Constitutive model for concrete:(a) In tension (b) In compression [16]](https://thumb-us.123doks.com/thumbv2/123dok_us/232419.2017841/3.595.315.530.603.704/figure-constitutive-model-for-concrete-tension-b-compression.webp)
![Figure 3. Specimen tested by Mehrabi [12]: (a) Loading scheme, (b) Geometry and details of the specimens](https://thumb-us.123doks.com/thumbv2/123dok_us/232419.2017841/4.595.86.259.99.339/figure-specimen-tested-mehrabi-loading-geometry-details-specimens.webp)