SUSTAINABILITY MANAGEMENT OF THE RECOMMENDED
QUALITY AND QUANTITY OF DRINKING WATER IN
MALAWI: DEVELOPING A FRAMEWORK
A thesis
by
ASUMANI N.A. UNGWE
submitted in partial fulfilment of the requirements for the award of the Doctor of
Philosophy degree
THE BUSINESS SCHOOL,
UNIVERSITY OF BOLTON
UNITED KINGDOM
TABLE OF CONTENTS
ABSTRACT ... v
ACKNOWLEDGEMENTS ... vii
LIST OF TABLES ... viii
LIST OF FIGURES ... ix
LIST OF BOXES ... x
GLOSSARY OF KEY TERMS ... xi
ABBREVIATIONS AND ACRONYMS ... xiii
CHAPTER ONE - INTRODUCTION ... 1
1. INTRODUCTION ... 1
1.1 IMPORTANCE OF SAFE DRINKING WATER SUPPLY (DWS) ... 2
1.2 THE STATE OF GLOBAL DRINKING WATER SUPPLY ... 3
1.3 DRINKING WATER SUPPLY SITUATION IN MALAWI ... 4
1.3.1 Sources of drinking water in Malawi ... 4
1.3.2 Institutional set-up for DWS in Malawi ... 5
1.3.3 DWS targets and achievements in Malawi ... 6
1.4 SUSTAINABILITY OF DWS SERVICES IN MALAWI ... 7
1.5 JUSTIFICATION FOR THIS RESEARCH... 11
1.6 PROBLEM STATEMENT ... 13
1.7 AIM AND OBJECTIVES OF THE INVESTIGATION ... 14
1.8 RESEARCH FOCUS AND BOUNDARIES ... 14
1.9 RESEARCH PERSPECTIVE ... 15
1.10 STRUCTURE OF THE THESIS ... 15
Chapter summary ... 16
CHAPTER TWO - LITERATURE REVIEW ... 17
Introduction ... 17
2.1 DRINKING WATER SUPPLY SERVICES ... 17
2.2 SUSTAINABILITY ... 18
2.3 SERVICE SUSTAINABILITY... 19
2.4 SERVICE SUSTAINABILITY FACTORS FOR DWS ... 20
2.4.1 Sustainability factors for services other than DWS services ... 21
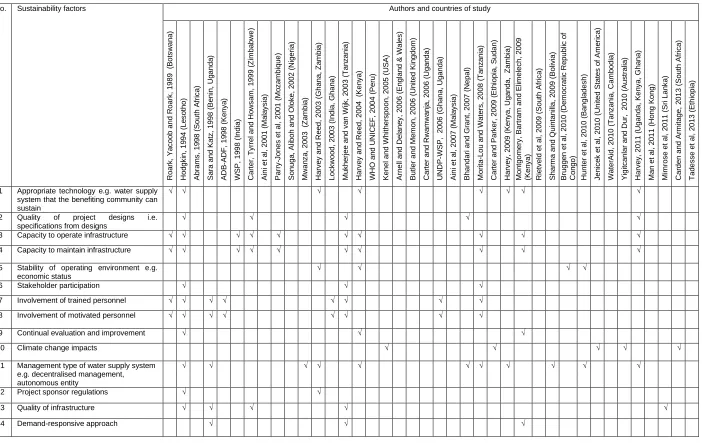
2.4.2 Sustainability factors for DWS services globally ... 22
2.4.3 Sustainability factors for DWS services in Malawi ... 27
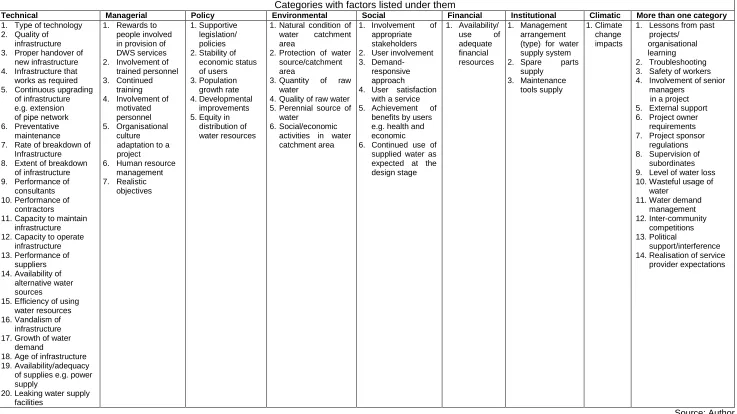
2.4.4 Combining service sustainability factors ... 27
2.5 RELATIONSHIPS AMONGST DWS SUSTAINABILITY FACTORS ... 29
2.6 RECOMMENDED FACTORS FOR SUSTAINABILITY OF DWS ... 32
2.6.1 Individual factors ... 33
2.6.2 Factors in frameworks ... 33
2.6.2.1 Framework for sustainable rural water services by WaterAid (2010) ... 33
2.6.2.2 Sustainability model of rural water supply by Masduqi et al (2009) ... 34
2.6.2.3 Sustainability snapshot by Sugden (2003) ... 35
2.6.3 Limitations of the factors recommended to be managed ... 35
2.8 RESEARCH PROPOSITION ... 39
2.9 RESEARCH QUESTIONS ... 40
Chapter summary ... 40
CHAPTER THREE - RESEARCH METHODOLOGY ... 41
Introduction ... 41
3.1 RESEARCH PROBLEM, AIM AND QUESTIONS ... 41
3.2 RESEARCH PARADIGM ... 42
3.3 RESEARCH STRATEGIES ... 43
3.4 RESEARCH DESIGN ... 46
3.4.1 Root cause analysis... 46
3.4.1.1 Data collection ... 47
3.4.1.2 Data analysis ... 47
3.4.2 Survey ... 47
3.4.2.1 Data collection ... 48
3.4.2.2 Data analysis ... 49
3.4.3 Multiple case studies ... 49
3.4.4 Cases that were studied ... 49
3.4.5 Data collection ... 58
3.4.6 Data analysis techniques ... 60
3.4.7 Data analysis protocols ... 62
3.5 RESEARCH ETHICS ... 63
Chapter summary ... 63
CHAPTER FOUR - RESEARCH FINDINGS ... 64
Introduction ... 64
4.1 SUSTAINABILITY OF DWS SERVICES IN THE CASE WSSs ... 64
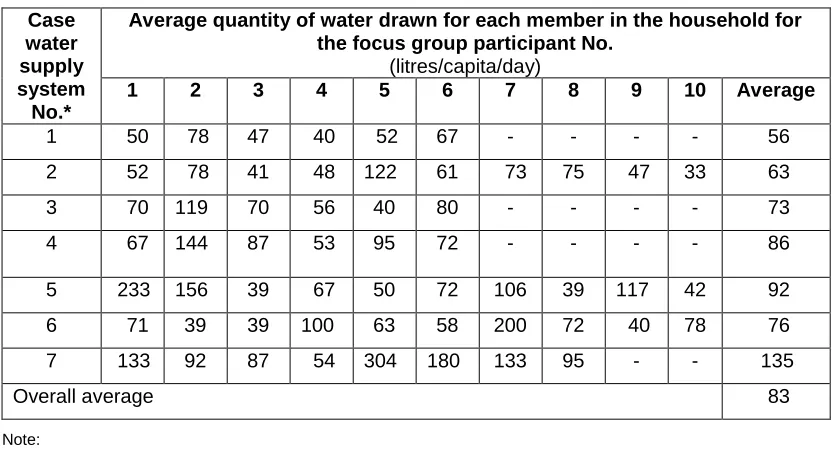
4.1.1 Quantities of water used by the consumers ... 65
4.1.2 Quality of water used by the consumers ... 69
4.2 COMBINED EFFECTS OF DWS SERVICE SUSTAINABILITY FACTORS ... 73
4.2.1 Combined effects at country level ... 75
4.2.2 Combined effects in the case WSSs ... 80
4.2.3 Combined effects that affected individual case WSSs ... 87
4.3 FACTORS, ROOT CAUSES AND STRATEGIES FOR COMBINED EFFECTS ... 90
4.3.1 Quantity of available raw water (CE1) ... 96
4.3.1.1 Factors that affected quantity of available raw water ... 96
4.3.1.2 Consequence of not managing the factors... 99
4.3.1.3 Strategy for managing quantity of available raw water ... 99
4.3.1.4 Root causes and how to manage them ... 99
4.3.2 Quality of available raw water (CE2) ... 114
4.3.2.1 Factors that affected quality of available raw water ... 114
4.3.2.2 Consequence of not managing the factors... 115
4.3.2.3 Strategy for managing quality of available raw water... 115
4.3.2.4 Root causes and how to manage them ... 116
4.3.3 Capacity of infrastructure to produce and supply adequate water (CE3) ... 119
4.3.3.1 Factors that affected production & supply of adequate water ... 119
4.3.3.2 Consequence of not managing the factors... 121
4.3.3.3 Strategy for managing production & supply of adequate water ... 121
4.3.3.4 Root causes and how to manage them ... 121
4.3.4 Capacity of infrastructure to produce safe water continually (CE4) ... 129
4.3.4.2 Consequence of not managing the factors... 130
4.3.4.3 Strategy for managing capacity to produce safe water ... 130
4.3.4.4 Root causes and how to manage them ... 130
4.3.5 Continual functioning of infrastructure as required at design stage (CE5) ... 136
4.3.5.1 Factors that affected continuity of infrastructure to function ... 136
4.3.5.2 Consequence of not managing the factors... 138
4.3.5.3 Strategy for managing continual functioning of infrastructure ... 138
4.3.5.4 Root causes and how to manage them ... 139
4.3.6 Capacity to operate the infrastructure (CE6) ... 155
4.3.6.1 Factors that affected capacity to operate the infrastructure ... 155
4.3.6.2 Consequence of not managing the factors... 156
4.3.6.3 Strategy for managing capacity to operate the infrastructure ... 157
4.3.6.4 Root causes and how to manage them ... 157
4.3.7 Realisation of service provider expectations (CE7) ... 163
4.3.7.1 Factors that affected realisation of service provider expectations ... 164
4.3.7.2 Consequence of not managing the factors... 165
4.3.7.3 Strategy for managing realisation of service provider expectations ... 165
4.3.7.4 Root causes and how to manage them ... 165
4.4 REQUIREMENTS FOR EFFECTIVE IMPLEMENTATION OF STRATEGIES ... 175
4.4.1 External support (CR1) ... 176
4.4.2 Supervision of subordinates (CR2) ... 177
4.4.3 Safety of workers (CR3) ... 179
4.4.4 Management arrangement of WSSs (CR4) ... 180
4.4.5 Use of adequate financial resources (CR5) ... 182
4.4.6 Supportive legislation/policies (CR6) ... 187
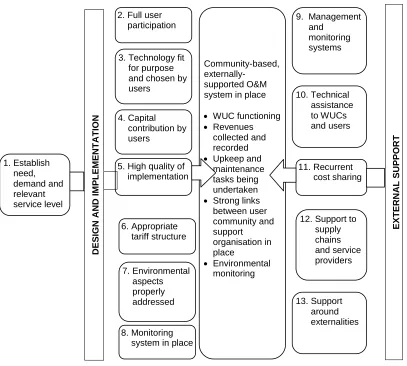
4.5 FRAMEWORK FOR SUSTAINABLE DWS SERVICES IN MALAWI ... 193
4.6 THE RECOMMENDED WAY OF USING THE DEVELOPED FRAMEWORK ... 198
Chapter summary ... 200
CHAPTER FIVE - CONCLUSIONS & RECOMMENDATIONS ... 201
Introduction ... 201
5.1 SUMMARY OF FINDINGS AND RECOMMENDATIONS ... 201
5.1.1 Sustainability of the quality and quantity of drinking water in Malawi ... 201
5.1.2 Reasons why supplied safe water does not satisfy the demand in Malawi .... 202
5.1.3 Reasons why water consumers in Malawi use unsafe water... 203
5.1.4 Repercussions of supply of inadequate and unsafe water in Malawi ... 204
5.1.5 Factors that affect sustainability of DWS services in Malawi ... 205
5.1.6 Management of root causes of sustainability failure of DWS in Malawi ... 206
5.1.7 Combined effects of the factors that affect sustainability of DWS in Malawi .. 206
5.1.8 Strategies and tactics for sustaining DWS services in Malawi... 207
5.1.9 The best way of using the framework developed in this research ... 208
5.2 ACCOMPLISHMENT OF RESEARCH OBJECTIVES AND AIM ... 209
5.3 THEORETICAL AND PRACTICAL CONTRIBUTIONS ... 212
5.3.1 Theoretical contributions ... 212
5.3.2 Practical contribution ... 214
5.4 VALIDITY OF FINDINGS ... 216
5.5 CORRECTNESS OF PROPOSITION ... 217
5.6 LIMITATIONS ... 218
5.7 FURTHER RESEARCH ... 219
REFERENCES ... 221
APPENDIX A: INSTRUMENTS USED TO COLLECT DATA ... 236
Appendix A1: Descriptive survey questionnaire ... 236
Appendix A2: One-to-one interview questionnaire ... 243
Appendix A3: Focus group discussion questions ... 249
Appendix A4: Analytical survey questionnaire ... 251
ABSTRACT
Supply of safe drinking water is well-recognised as a catalyst for improving public health
and social welfare as well as spurring economic growth. For this to be achieved, the
water used should be both adequate and safe for human consumption. However, it has
been noted that in Malawi the quality and quantity of water used by the consumers
deteriorates and decreases respectively as time passes after commissioning of the water
supply systems.
For the quality and quantity of drinking water (drinking water supply services) to be
sustainable, there is a need to manage all the factors that affect them. However, not all
the factors are currently managed. With only some of the factors being managed, not all
the aspects required for sustainability of the quality and quantity of drinking water are
maintained. It is also noted that the factors that are managed are selected based on their
popularity and perceived order of importance. As such, the factors that are managed are
not necessarily the root causes of the deterioration of the quality and quantity of the
supplied drinking water. While this is the case, it is known that for a problem to be solved
completely, there is a need to deal with its root causes. In addition, addressing of the root
causes, which are fewer than the total number of the factors that affect sustainability of
drinking water supply (DWS) services, is a simple way of managing all the factors.
Therefore, the aim of this research was to identify the root causes of sustainability failure
of DWS services in Malawi, evaluate the outcomes of managing the root causes on
sustainability of DWS services, and develop a framework for managing the identified root
causes to improve sustainability of DWS services.
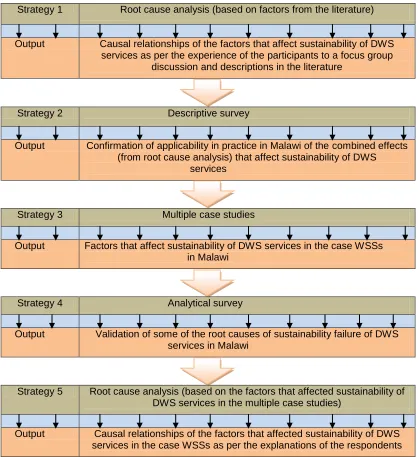
Root cause analysis, survey and multiple case studies were employed as the research
strategies for this study. Five DWS experts took part in the root cause analysis, ten water
supply systems were studied as cases while 40 respondents participated in the survey.
All the participants and the case water supply systems were from Malawi. Both
qualitative and quantitative data were collected and analysed in the study.
The findings of this research include the identification of 7 combined effects through
which various factors affect sustainability of DWS services in Malawi. The research has
also established that interaction of the factors that affect sustainability of DWS services
in Malawi is kick-started by 26 root causes. Comprehensive sets of strategies and tactics
respectively. Six critical requirements necessary for effective implementation of the
strategies and tactics have also been identified. Accordingly, an overarching framework,
with step-by-step instructions on how to improve sustainability of DWS services in
Malawi, has been developed. The theoretical contribution of this research is that there
will be increased understanding of the issues that affect sustainability of DWS services in
Malawi and other countries with similar contexts. As regards practical contribution, the
framework developed in this research - when used by the DWS practitioners, managers
and policy makers - is expected to lead to improved sustainability of DWS services in
ACKNOWLEDGEMENTS
Several people and organisations provided support and assistance for this study. I would
like to express my profound gratitude to my first supervisor, Professor Danny Morton, for
his guidance and advice throughout the research. His guidance and advice contributed a
lot to the successful completion of this research. I would also like to thank my second
supervisor, Dr Kondal Reddy Kandadi, for his immense guidance, encouragement and
support. My thanks also go to my local supervisor, Dr Emma Catherine Kishindo for her
assistance and advice.
I further thank executive managers at Northern Region Water Board for their support
without which it would not have been possible for me to pursue and complete this
course.
Special thanks go to the executives at the Ministry of Water Development and Irrigation,
Blantyre Water Board, Central Region Water Board, Northern Region Water Board and
Southern Region Water Board for allowing me to conduct case studies at some of their
water supply systems. Many thanks also go to the participants in the root cause analysis,
the respondents in the surveys, and the interviewees in the case studies for providing the
information and data that made this study possible.
Lastly, I would like to convey my heart-felt appreciation to my parents for their
encouragement which has enabled me to reach this far. I also express my gratitude to
my wife, Norrah, for her patience, support and encouragement throughout the period of
LIST OF TABLES
Table 1: Access to improved water sources worldwide ... 3
Table 2: Access to improved water sources in Sub-Saharan Africa ... 4
Table 3: Distribution of people in Malawi in 2008 per the type of water source ... 5
Table 4: Types and numbers of mostly used improved water sources in Malawi in 2014 ... 5
Table 5: Number of samples with contaminated water ... 8
Table 6: Prevalence rates of water-borne diseases in Malawi ... 8
Table 7: Number of hours that water was available in some WSSs in Malawi ... 10
Table 8: A list of sustainability factors for services other than DWS services ... 21
Table 9: A list of sustainability factors for DWS services in countries other than Malawi ... 23
Table 10: Combined list of conceptual service sustainability factors from the literature ... 28
Table 11: Factors that affect or can easily affect sustainability of DWS services in Malawi .. 31
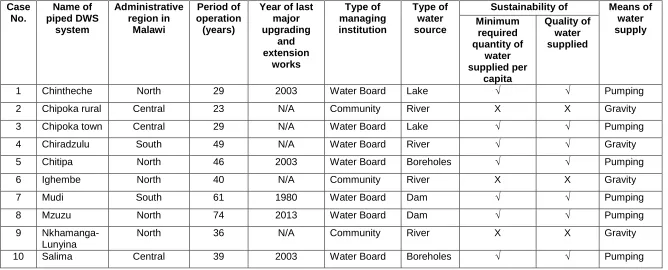
Table 12: Overview of the case WSSs for the current research ... 51
Table 13: Quantities of water that users drew from the case WSSs ... 65
Table 14: Residual chlorine in the stored water from the case WSSs ... 71
Table 15: Prevalence rates of water borne diseases in the case WSSs in 2011 ... 73
Table 16: % of respondents who identified the 7 combined effects as important ... 75
Table 17: Results of one-sample t-test on WSSs affected by the 7 combined effects ... 76
Table 18: Total scores on 7 combined effects facilitating sustainability of DWS in Malawi ... 77
Table 19: Total scores on 7 combined effects impeding sustainability of DWS in Malawi ... 77
Table 20: Results of ANOVA on how combined effects facilitated sustainability of DWS ... 78
Table 21: Results of ANOVA on how combined effects impeded sustainability of DWS ... 79
Table 22: Combined effects affecting individual case WSSs ... 87
Table 23: Water losses in the case WSSs in 2013 ... 98
Table 24: Personnel working on maintenance works in the case WSSs... 107
Table 25: Trend of rainfall in the case WSSs from 1960 to 2011 ... 113
Table 26: Population growth rates in the case WSSs between 1987 and 2008 ... 123
Table 27: Numbers of staff in the case WSSs trained in the year 2013/2014 ... 142
Table 28: Monthly salaries in the case WSSs ... 145
Table 29: The years by which the infrastructure should have been refurbished ... 148
Table 30: Personnel that operated infrastructure in the case WSSs ... 158
Table 31: Number of personnel at the head offices for the participating organisations ... 185
LIST OF FIGURES
Figure 1: Organisational structure for DWS in Malawi ... 6
Figure 2: Framework for sustainable rural water supply services ... 34
Figure 3: Overview of the strategies for this research and expected outputs ... 44
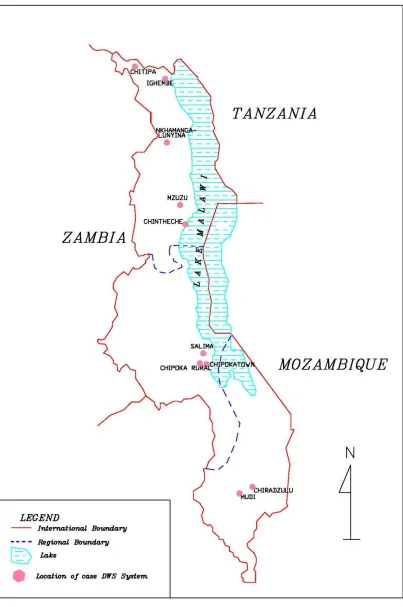
Figure 4: Map of Malawi showing locations of the case DWS systems ... 52
Figure 5: Fish-bone diagram for unsustainable DWS services... 74
Figure 6: Current reality tree for the factors that affect sustainability of DWS services ... 91
Figure 7: Relationship of the factors that affect the quantity of available raw water ... 100
Figure 8: Relationship of the factors that affect the quality of raw water ... 116
Figure 9: Relationship of the factors that affect production and supply of adequate water .. 122
Figure 10: Relationship of the factors that affect production of safe water ... 130
Figure 11: Relationship of the factors that affect continual functioning of infrastructure ... 140
Figure 12: Relationship of the factors that affect operation of the infrastructure ... 157
Figure 13: Relationship of factors that affect realisation of service provider expectations ... 166
LIST OF BOXES
Box 1: Reasons why the users drew less water from the case WSSs ... 66
Box 2: Challenges encountered because of inadequate water supply ... 67
Box 3: Challenges encountered when drawing water from other sources ... 67
Box 4: Quotations showing the frequency and period of water supply interruptions ... 70
Box 5: Substantiating the period that water was stored by the users in the case WSSs ... 71
Box 6: Quotations on use of water collected from unsafe sources ... 72
Box 7: Substantiating ‘Quantity of available raw water’ as affecting DWS services... 81
Box 8: Substantiating ‘Quality of available raw water’ as affecting DWS services ... 81
Box 9: Substantiating ‘Capacity of infrastructure to produce & supply adequate water’ ... 82
Box 10: Substantiating ‘Capacity of infrastructure to produce safe water’ ... 83
Box 11: Substantiating ‘Continuity of infrastructure to function as required’ ... 84
Box 12: Substantiating ‘Capacity to operate the infrastructure’ ... 84
Box 13: Substantiating ‘Realisation of service provider expectations’ ... 85
Box 14: Substantiating ‘WSSs affected by one combined effect are almost sustainable’ ... 88
Box 15: Substantiating ‘One combined effect can lead to unsustainable DWS services’ ... 88
Box 16: Quotations on the dates when DWS services were noted not sustainable ... 96
Box 17: Factors that affected quantity of available raw water ... 96
Box 18: Factors that affected quality of raw water ... 114
Box 19: Factors that affected continual production and supply of adequate water ... 120
Box 20: Factors that affected capacity to produce safe water continually ... 129
Box 21: Factors that affected continual functioning of infrastructure ... 136
Box 22: Factors that affected capacity to operate the infrastructure ... 155
Box 23: Factors that affected realisation of service provider expectations... 164
Box 24: Substantiating ‘External support’ as a critical requirement ... 176
Box 25: Substantiating ‘Supervision of subordinates’ as a critical requirement ... 177
Box 26: Substantiating ‘Safety of workers’ as a critical requirement ... 179
Box 27: Substantiating ‘Clear management arrangement’ as a critical requirement ... 180
Box 28: Substantiating ‘Use of adequate financial resources’ as a critical requirement ... 182
GLOSSARY OF KEY TERMS
Combined effect is a factor that directly affects sustainability of drinking water supply
services after being triggered by other factors.
Drinking water is water which is available to people for consumption.
Drinking water supply coverage is a percentage of the population that has access to
improved water sources.
Drinking water supply service is a flow of water of a particular quality and quantity.
Drinking water supply service sustainability is continued flow of water at the same rate
and quality as per the design of the supply system.
Factor is something that contributes to or has an influence on the combined effect that
affects sustainability of drinking water supply services.
Framework is a logical structure for presenting complex information in an organised manner.
Functional water point is a water point that yields water regularly and is used on a daily
basis.
Improved water sources are the sources of water which are protected from contamination
but are not necessarily free from pathogens.
Maintenance of infrastructure within a short time is when the broken down infrastructure
is maintained before the consequent disruption of drinking water supply forces people to
fetch water from other sources.
Prolonged breakdown of infrastructure is when the broken down infrastructure takes long
to maintain such that the consequent disruption of drinking water supply forces people to
fetch water from other sources.
Residual chlorine is the amount of chlorine available in the treated water to inactivate
disease-causing organisms.
Root cause is a factor which when fixed, the problem goes away and does not come back.
Safe drinking water (also known as potable water) is water of high quality that can be
Safe drinking water supply is the provision of safe water by a designated entity to a
particular area.
Service sustainability factor is an influence which affects sustainability of a service.
Strategy is a high level plan to achieve a specific objective.
Sustainability failure of drinking water supply services is the failure of drinking water
supply services to be sustainable.
Tactic is an action that is used to achieve a particular strategy.
Water available for supply is the total quantity of water produced and sent into a water
supply system by a service provider.
Water available to the user is the water which the user is able to collect from the supply
point (transports and/or stores it, where applicable) ready for use.
Water supply system is an arrangement of engineered hydrologic and hydraulic
ABBREVIATIONS AND ACRONYMS
AF - Additional factor
AfDB - African Development Bank ANOVA - Analysis of Variance CE - Combined effect CF - Conceptual factor Cq - Consequence CR - Critical requirement DWS - Drinking Water Supply
ESCOM - Electricity Supply Commission of Malawi
FS - Favourable state
GDP - Gross Domestic Products
HDPE - High-density polyethylene
ILO - International Labour Organisation
IOB - Policy and Operations Evaluation Department of the Netherlands Ministry of Foreign Affairs
IPCC - Intergovernmental Panel on Climate Change IRC - International Water and Sanitation Centre KMO - Kaiser-Meyer-Olkin
MCCCI - Malawi Confederation of Chambers of Commerce and Industry
MDG - Millennium Development Goal M&E - Monitoring and Evaluation MK - Malawi Kwacha
NGO - Non-Governmental Organisation NRWB - Northern Region Water Board
NWDP - National Water Development Programme
O&M - Operation and Maintenance
PACN - Pan Africa Chemistry Network
Q - Research question
RC - Root cause
RGWSS - Rural Gravity-fed Water Supply System
RWSN - Rural Water Supply Network
S - Strategy
SPSS - Statistical Package for the Social Sciences
T - Tactic
UN - United Nations
UNCHS - United Nations Commission for Human Settlement
UNDP - United Nations Development Programme
UNGA - United Nations General Assembly
UNICEF - United Nations Children’s Fund
USA - United States of America
US$ - United States Dollar
WELL - Water and Environmental health at London and Loughborough
WHO - World Health Organisation
WSP wa
- Water and Sanitation Programme
WSS - Water Supply System
CHAPTER ONE - INTRODUCTION
1. INTRODUCTION
Safe drinking water (also known as potable water) is water of high quality that can be
consumed or used with low risk of immediate or long-term harm to life (Greenhalgh,
2001). Provision of safe drinking water to a particular area by a designated entity is
known as water supply. As such, safe drinking water supply (DWS), which is a combination of the terms ‘safe drinking water’ and ‘water supply’, is the provision of safe
water to a particular area by a designated entity.
The two main indicators of whether or not the DWS will maintain and/or improve public
health, which is the main purpose of DWS, are the quality and quantity of the water used
(Bostoen, 2005; UNICEF and WHO, 2012). In Malawi, drinking water is said to be safe
for human consumption when at least the number of faecal coliforms per 100 millilitres of
water is not more than 10 in 99% of the samples (Malawi Standards Board, 2005). As
regards quantity, in Malawi drinking water is said to be adequate when it is not less than
36 litres per capita per day (Malawi Ministry of Irrigation and Water Development, 1994).
However, the quality and quantity of drinking water in Malawi deteriorate as time passes
after commissioning of the water supply systems. For example, at the time of preparing
this thesis, the quantity of water supplied to most users was less than the recommended
minimum. This was the case because either the water flows at the taps were very low or
the water supply was intermittent. These situations forced some people to collect and
use unsafe water to complement the available inadequate safe water. In most cases,
such people ended up suffering from water-borne diseases despite having access to
some safe water (Malawi Ministry of Health, 2007-2011). Further, inadequate quantity of
supplied drinking water forced water-using industries and commercial enterprises, which
were not able to store enough water or source it from elsewhere, to operate for less than
the planned period per day. The consequence was that such enterprises did not realise
the anticipated benefits from their businesses (MCCCI, 2013). There is, therefore, a need
to find ways of addressing the situation so that all users should have access to adequate
safe water all the time. Once found, the Government of Malawi could use such ways to
realise its vision of providing safe and adequate drinking water to all its people all the time, dubbed ‘Water for all, always’ (Malawi Ministry of Irrigation and Water
It is argued in this thesis that for DWS services to be sustainable in Malawi and other
countries with similar contexts, it is essential that all the root causes of sustainability
failure of DWS services in a water supply system should be addressed. This is important
because management of all the root causes ensures complete resolution of problems.
1.1 IMPORTANCE OF SAFE DRINKING WATER SUPPLY (DWS)
Supply of safe drinking water is important for a number of reasons; it improves public
health, reduces mortality and spurs economic development (Braune and Xu, 2010;
Montgomery et al, 2009). Health of the people who consume and/or use potable water
improves because they do not suffer from water-borne and water-washed diseases. The
welfare of such people also improves. On the contrary, health and welfare of the people
who suffer from water-borne and water-washed diseases are negatively affected, and
this has negative impact on national economies. World Bank (2008) estimates that the
total effects of diarrhoeal diseases and the associated malnutrition (including the
long-term effects on education and income for the affected people) cost low-income
governments like Malawi up to 9% of their annual gross domestic product (GDP). This
loss is prevented where adequate safe water is supplied to people. The other benefits
related to health are that money is not spent on medical bills, no time is lost in hospitals
receiving treatment, and people do not die of water-borne and water-washed diseases.
Apart from health benefits, potable water supply promotes economic growth (Schwartz
and Johnson, 1992; Whittington and Swarna, 1994). This is the case in that availability of
potable water encourages establishment of commercial and industrial enterprises which
require potable water. Some of such enterprises add value to locally available products
such as crops and minerals. The presence of such enterprises enables governments to
earn more income through collection of taxes and sale of products with additional value.
In addition, implementation of DWS projects spurs economic growth through increased
efficiency in production and supply of potable water, increased production of goods and
services, and increased job creation and employment (Schwartz and Johnson, 1992).
Further, the other benefit is that where safe drinking water is available in the homes
and/or nearby places, time is saved (Carter et al, 1999). It is estimated that families
spend an average of three hours per day fetching water for a family of six in rural Africa
(PACN, 2010). This much time is saved where drinking water is supplied in homes or
Swarna, 1994). It is estimated that health and time-saving benefits of DWS are as much
as 11 times the associated costs (Banerjee et al, 2008).
Adequate water supply also results in high school enrolment, and high retention rates of
girls in schools as the girls do not spend much time fetching water (PACN, 2010;
UNICEF, 2006; WHO/UNICEF, 2000).
In summing up the importance of water to life, Szent-Gyorgyi (1893-1986) states that:
“Water is life’s matter and matrix, mother and medium. There is no life without water”
1.2 THE STATE OF GLOBAL DRINKING WATER SUPPLY
Despite being so important, safe drinking water is not available to all the people globally.
In 1990, 24% of the people in the world had no access to improved water sources
(UNICEF/WHO, 2012). This prompted the United Nations to include provision of safe
drinking water to people as one of the targets under the Millennium Development
Declaration (Hulme, 2009; UNGA, 2000). The target was to reduce the proportion of
people without sustainable access to safe drinking water by half by the year 2015. This
meant that 89% of the people worldwide were expected to have access to improved
water sources by 2015.
Progress made so far on this target is excellent. By 2010, the target had been achieved,
5 years ahead of the target date of 2015 (UNICEF/WHO, 2012). As such, it is projected
that by 2015, 91% of the people in the world, which is more than the targeted 89%, will
have access to improved water sources (WHO/UNICEF, 2010). Table 1 shows the
timeline of how the target was achieved from 1990 to 2010.
Table 1: Access to improved water sources worldwide
Year 1990 2000 2010
Coverage (%) 76 83 89
Source: UNICEF/WHO, 2012
While the figures in table 1 look impressive, the situation is different in some specific
countries and regions. For example, Sub-Saharan Africa is struggling to achieve its
target of supplying 75% of its people with safe water by 2015. By interpolation, the target
access to improved water sources by 2010 (UNICEF/WHO, 2012). The percentages of
the people in the Sub-Saharan Africa who had access to improved water sources
between 1990 and 2010 are as shown in table 2.
Table 2: Access to improved water sources in Sub-Saharan Africa
Year 1990 2000 2010
Coverage (%) 49 55 61
Source: UNICEF/WHO, 2012
If the trend shown in table 2 continues, only 64% of the people in the Sub-Saharan Africa
will have access to improved water sources by 2015, thereby missing the target of 75%.
This shows that progress in increasing the proportion of people who have access to
improved water sources (DWS coverage) in the Sub-Saharan Africa has been slower
than expected. In fact, UNDP (2006) notes that the rate at which DWS coverage has
been increasing in the Sub-Saharan Africa is the slowest of all the regions in the world.
The main reason for the low DWS coverage in the Sub-Saharan Africa has been
identified as low sustainability level of DWS services i.e. failure to maintain the quality
and quantity of drinking water (WHO/UNICEF, 2004). Estimates by RWSN (2010)
indicate that only 67% of the water points are functional in the region at any given time.
This is the case due to high breakdown rates of the water supply systems as a result of
poor quality water supply systems, inappropriate management structures and lack of
affordability by the communities, among other reasons (Harvey, 2011; WHO/UNICEF,
2004).
1.3 DRINKING WATER SUPPLY SITUATION IN MALAWI
DWS situation in Malawi is discussed below under the following three (3) topics, namely;
sources of drinking water, institutional set-up for DWS, and DWS targets and
achievements.
1.3.1 Sources of drinking water in Malawi
People in Malawi use water from piped water supply systems, hand-pump boreholes,
wells, rivers, streams, ponds, lakes, dams and springs (Malawi National Statistical Office,
2009). Piped water supplies, hand-pump boreholes and protected wells are improved
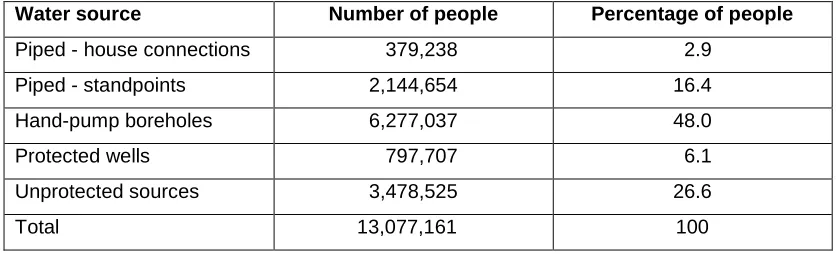
The distribution of the people in Malawi in 2008 (when the latest comprehensive study
was conducted) per the type of water source was as shown in table 3.
Table 3: Distribution of people in Malawi in 2008 per the type of water source
Water source Number of people Percentage of people
Piped - house connections 379,238 2.9
Piped - standpoints 2,144,654 16.4
Hand-pump boreholes 6,277,037 48.0
Protected wells 797,707 6.1
Unprotected sources 3,478,525 26.6
Total 13,077,161 100
Source: Malawi National Statistical Office, 2009
Table 3 shows that the improved water sources that were used by most people in Malawi
in 2008 were hand-pump boreholes and piped water supplies. The numbers of these
improved water sources in 2014 were as shown in table 4.
Table 4: Types and numbers of mostly used improved water sources in Malawi in 2014
Water source Number
Piped systems managed by the Water Boards 60
Piped systems managed by the Department of Water Supply 126
Hand-pump boreholes managed by the Department of Water Supply 43,157
Source: Malawi Ministry of Irrigation and Water Development, 2014
1.3.2 Institutional set-up for DWS in Malawi
Provision of drinking water supply services in Malawi is the responsibility of the
Department of Water Supply Services in the Ministry of Water Development and
Irrigation. The water supply services in Malawi are divided into two, namely; water supply
to cities and towns, and water supply to semi-urban and rural areas. Water supply
services provided to the cities and towns are managed by the state-owned companies
called Water Boards. There are five Water Boards in Malawi, namely; Blantyre Water
Board, Lilongwe Water Board, Central Region Water Board, Northern Region Water
Board and Southern Region Water Board (Government of Malawi, 1995). On the other
hand, water supply services provided to the semi-urban and rural areas are managed by
community-based structures with support from the Department of Water Supply
Regulation and control of abstraction of water from both surface and ground sources is
the responsibility of the National Water Resources Authority (Government of Malawi,
2013) formerly known as the Water Resources Board (Government of Malawi, 1969).
The Authority issues licences authorising entities to abstract the allocated amounts of
water. The reporting lines for the institutions involved in the provision of DWS services in
Malawi are shown in figure 1.
Ministry of Water Development and Irrigation
Department of Water Resources Department of Water Supply Services
National Water Resources Authority Water Boards Community-based
management structures
Figure 1: Organisational structure for DWS in Malawi
1.3.3 DWS targets and achievements in Malawi
Malawi has two major targets to achieve as regards drinking water supply. The first
target is the Millennium Development Goal (MDG) number 7c. As a signatory of the
United Nations (UN) Millennium Declaration, Malawi is required to achieve, among other
targets, the MDG number 7c which requires countries to halve by the year 2015, the
percentage of people who did not have sustainable access to safe drinking water in 1990
(UNGA, 2000; IOB and UNICEF, 2011). Malawi’s MDG on drinking water supply is that
74% of the people should have access to safe water by 2015 (Malawi Ministry of
Irrigation and Water Development, 2010).
The second target is to achieve universal access to improved water sources. Based on
the African Water Vision for 2025, the Government of Malawi set itself a target of
ensuring that 100% of the people in the country should have access to safe water by the
year 2025 (Malawi Ministry of Irrigation and Water Development, 1994).
In order to achieve the set targets, the Government of Malawi employed the strategies of
implementation of projects for upgrading existing, and constructing new DWS
infrastructure has been ongoing.
In terms of DWS coverage, there has been significant achievement in Malawi. The
coverage moved from 41% in 1992 to 67% in 2002 (WHO/UNICEF, 2004). By 2006, the
water supply coverage in Malawi reached 75% (Malawi National Statistical Office,
2006a), thereby achieving its MDG for water, almost a full decade ahead of the target
date (Foster and Shkaratan, 2011). The DWS coverage kept increasing such that by
2010, 83% of the people in Malawi had access to improved water sources
(UNICEF/WHO, 2012). If this trend continues, Malawi will achieve its target of universal
access to improved water sources by the year 2018, seven years ahead of the target
year of 2025.
1.4 SUSTAINABILITY OF DWS SERVICES IN MALAWI
As indicated in section 1.3.3, in Malawi, DWS coverage increased from 41% in 1992 to
83% in 2010. With 83% coverage in 2010, Malawi had the fifth highest DWS coverage in
the Sub-Saharan Africa. The highest was Mauritius with 99% coverage. The second was
Namibia with 93% coverage. The third and fourth were South Africa and Ghana with 91%
and 86% coverage respectively (UNICEF/WHO, 2012).
While 83% DWS coverage in Malawi is quite good compared to other countries in the
Sub-Saharan Africa, the quality and quantity of water supplied in Malawi deteriorate as
time passes after commissioning of the water supply systems. Some rural piped DWS
systems that used to supply safe water, no longer do so (World Bank, 2011). For
instance, the results from the water quality surveillance conducted in 2009 in 10 rural
DWS systems located in different parts of Malawi (summarised in table 5) showed that,
on average, 86% of the samples collected from different places in the 10 areas were of
contaminated water (Malawi Ministry of Irrigation and Water Development, 2009). As
regards the situation in the individual DWS systems, it was noted that all the samples
(100%) from 8 of the 10 DWS systems were of contaminated water, while 80% and 64%
of the samples from the ninth and tenth DWS systems respectively were of contaminated
Table 5: Number of samples with contaminated water
Water supply system number
Number of samples tested
Number of samples with contaminated
water
% of samples with contaminated water
1 2 2 100
2 2 2 100
3 2 2 100
4 4 4 100
5 2 2 100
6 1 1 100
7 1 1 100
8 5 5 100
9 5 4 80
10 11 7 64
Total 35 30 86
Source: Malawi Ministry of Irrigation and Water Development, 2009
The results in table 5 mean that most people served by the studied systems were
provided with unsafe water, when the systems were supposed to supply safe water. Most
of such people ended up suffering from water-borne diseases (Hunter et al, 2009; Malawi
Ministry of Health, 2007 to 2011).
It is noted that 3% of the patients that visited hospitals in Malawi between 2007 and 2011
suffered from water-borne diseases as shown in table 6.
Table 6: Prevalence rates of water-borne diseases in Malawi
Year 2007 2008 2009 2010 2011 Average
Prevalence rate (%)
3 3 3 3 3 3.0
Source: Malawi Ministry of Health, 2007 to 2011
It should be noted that 3.0% average prevalence rate of water-borne diseases in Malawi
signals a problem with safety of the water used. Results from a worldwide study by
Pruss-Ustun et al (2008) show that prevalence rate of water-borne diseases where
people use unsafe water account for an average of 3.5% of all illnesses. Based on this
finding, the average prevalence rate of water-borne diseases in Malawi, where 83% of
the people have access to improved water sources, should have been about 0.6% and
not 3.0%. The high prevalence rate of water-borne diseases suggests that most people
investigation will be conducted as part of this study to establish the quality of water
available to the users in selected DWS systems in Malawi. However, to determine the
extent of the problem, a pre-study survey was conducted. A short structured
questionnaire was sent to the operators of 167 piped DWS systems in Malawi. The
questionnaire was sent to the operators of 167 piped DWS systems out of a total of 186
systems because 19 of the systems were only about 2 years old at that time (2013).
Sustainability of DWS services in the 2-year old systems could not conclusively be
interpreted as showing that the DWS services would continue being sustainable for a
long time. Rather the sustainability of the DWS services could be attributed to the fact
that the systems were still new. As such, these systems were not included in the
pre-study survey.
The results from the pre-study showed that one of the key reasons for the deteriorating
quality of the water that is supplied is that the existing water treatment facilities,
especially for rural water supply systems, do not have capacity to treat raw water, whose
quality has deteriorated over the years (World Bank, 2011). The operators observed that
quality of raw water in 42% of the sources had deteriorated over the years.
As indicated above, the other parameter of the water supply services that deteriorates
with passage of time in Malawi is the quantity of water supplied. Information from 167
piped DWS systems in Malawi shows that the quantity of water available for supply to the
users in 85% of the systems is less than the Government of Malawi recommended
quantity of 36 litres per person per day. Consequently, water supply to the users is either
intermittent or the flows from the taps are so low that it takes a long time to fill a
container. Low water flows from the taps occur mostly in the rural areas.
For the urban areas, the challenge is mainly water supply intermittency. The average
number of hours per day that water is available to the users in the urban areas is less
than the planned 24 hours (World Bank, 2011). The results from a consumer survey
conducted by the Ministry of Water Development and Irrigation in 2013 in 8 areas
(summarised in table 7) showed that, on average, water was available to the users in 13
hours per day (Malawi Ministry of Water Development and Irrigation, 2013). In some
areas, water was available only for 6 hours per day. The results from the consumer
Table 7: Number of hours that water was available in some WSSs in Malawi
Name of water supply system Number of hours that water
was available per day
Balaka 9
Blantyre 6
Chikhwawa 13
Mponela 16
Lilongwe 14
Mzimba 20
Mzuzu 15
Zomba 11
Average 13
Source: Malawi Ministry of Water Development and Irrigation, 2013
One reason for the decreasing quantity of water supplied to the users in Malawi is high
non-functionality level of some drinking water supply systems. A study conducted by
WaterAid established that 31% of the water points in Malawi were not functional in 2007.
The other reasons for the decreasing quantity of water supplied to the users in Malawi,
based on the information from 167 piped DWS systems assessed in the pre-study
survey, are that:
a. 81% of the DWS systems operated beyond their useful life period without being
upgraded. As a result, the systems were not able to produce the required quantities
of potable water because the required quantities had exceeded the capacities of the
existing systems; and
b. Quantity of raw water in 43% of the sources had decreased with passage of time to
the extent that the available quantity was less than the amount required to produce
adequate potable water.
The above discussions show that sustainability of DWS services in Malawi is affected by
a number of factors. Such factors, which have been identified at this stage of the study,
include:
a. Functionality level of water supply systems;
b. Capacity of water supply systems to produce and supply adequate water;
c. Capacity of water supply systems to produce safe water;
d. Quantity of available raw water; and
Since these may not be the only factors that affect sustainability of water supply
services, investigation will be conducted as part of this study to determine a holistic set
of factors that affect sustainability of DWS services in Malawi.
1.5 JUSTIFICATION FOR THIS RESEARCH
A close look at the factors identified at this stage of the study as affecting sustainability of
the DWS services in Malawi (section 1.4) shows that managing some factors and not
other factors will result in DWS services which are not sustainable. For example,
ensuring that the water supply system functions as intended (i.e. no part of the system
becomes non-functional) is not enough if the raw water quantity is not adequate. This is
the case because the infrastructure will not be able to produce the required amount of
water due to non-availability of raw water which is a key input. Conversely, sustainability
of available amount of raw water is not enough if the infrastructure is in a dilapidated
state. This is so because the dilapidated infrastructure will not be able to produce potable
(processed) water in the required quantity even though the raw water might be available.
This shows the need to manage all the factors that affect sustainability of DWS services
in Malawi.
In terms of the factors, a number of studies have been conducted to identify the factors
that affect sustainability of DWS services. When the factors from different studies are put
together, the list is long and almost exhaustive. However, in most cases, not all the
factors are managed in a particular water supply system (WSS). Instead, different
combinations of some of the factors are managed in different WSSs (Lockwood, 2003;
Masduqi et al, 2009; McConville and Mihelcic, 2007; WaterAid, 2010). Additionally, the
factors that are managed are not necessarily the root causes of the decrease of the
quantity of water supplied or of the deterioration of the water quality. The consequence of
this, as it will be noted in section 2.6.3, is that not all the aspects required for
sustainability of the quantity and quality of drinking water are maintained. As a result, the
quantity and quality of drinking water in Malawi deteriorate as time passes after
commissioning of the water supply systems because some of the aspects required for
their sustainability are not maintained (Malawi Ministry of Irrigation and Water
Development, 2009; Malawi Ministry of Water Development and Irrigation, 2013;
WaterAid, 2007; World Bank, 2011).
In addition, it is noted in the body of knowledge for DWS management that sets of
factors have not been studied as interactions. This has been the case despite that for
over a decade now, there has been an advice in the literature that to achieve service
sustainability, there is need to group the factors and manage their interactions (Belassi
and Tukel, 1996; Clarke, 1998; King, 1996). There is, therefore, a need to study all the
factors acting together as interactions. It is important to study all the factors because
each factor has influence on service sustainability. Management of some factors and not
other factors results in certain aspects required for sustainability not being maintained,
and that failure of any one aspect of sustainability renders DWS services not sustainable
(Abrams, 1998; Khan, 2000; Lockwood and Smits, 2011).
Interactions of the factors show combined effects (symptoms) as well as root causes
(Duffy et al, 2012). As such, the advice in the literature that sustainability of services can
only be achieved by managing interactions of the factors simply means that services can
only be sustained by addressing combined effects of the factors through managing the
related root causes. After all, it is argued that once corrective measures are taken on the
root causes, the likelihood of recurrence of the sustainability failure will be minimised
(Dew, 1991; Doggett, 2005).
Thus, the justification for this research is the need to fill the gap identified in the body of
knowledge for project management that the factors that affect sustainability of services
should be managed as interactions. Since in most cases, one interaction includes a
number of factors, there will be few interactions that will need to be managed. As such, it
will be easy to manage all the factors that affect sustainability of DWS services.
Therefore, management of all the factors as interactions will resolve the challenge of
managing the factors in isolation which is complex. In addition, management of all the
factors will ensure maintenance of all aspects required for sustainability of DWS
services. This will result in sustainable DWS services.
The study concentrated on the piped DWS systems despite that it is the hand-pump
boreholes which supply drinking water to most people in Malawi (section 1.3.1). This is
the case because the piped DWS systems in Malawi have a higher non-functionality rate
than the hand-pump boreholes. For example, in a study by WaterAid in 2007, it was
noted that 51% of the water points for the piped DWS systems were non-functional while
only 21% of the hand-pump boreholes were non-functional. This calls for a quick solution
The other reason for the study being on the piped DWS systems and not on the
pump boreholes is that the piped DWS systems offer higher levels of services than
hand-pump boreholes (Sara and Katz, 1998). This is the case in that the water points for the
piped DWS systems are located within people’s homes or nearby places as a result of
extensive distribution pipe networks. Due to short distances to such water points, people
collect and use adequate quantities of water which facilitate easy realisation of the
benefits of using potable water (Esrey et al, 1996; Howard and Bartram, 2003). This is
different with people who travel long distances to hand-pump boreholes to fetch water. In
such instances, people normally collect and use inadequate safe water (Carter et al,
1999). Therefore, provision of drinking water through piped systems makes it easier for
the health and other benefits to be realised. Studying how to facilitate sustainability of
DWS services from the piped systems will lead to improved sustainability of DWS
services from the piped systems which will in turn make realisation of the benefits from
DWS services even easier.
1.6 PROBLEM STATEMENT
From the discussions in section 1.4, it will be noted that the problem at hand is that the
quantity and quality of drinking water (DWS services) in Malawi decreases and
deteriorates respectively as time passes after commissioning of the water supply
systems. Water provided by some piped DWS systems in the rural areas is no longer
safe for human consumption, and the quantity of water from some water supply systems
is no longer adequate for supply per capita. As such, the research problem is that:
“The quantity and quality of drinking water (DWS services) in Malawi decreases and
deteriorates respectively as time passes after commissioning of the water supply systems”
It is noted that the decrease and deterioration of the quantity and quality of drinking
water respectively could be because not all the factors are managed, and those that are
managed are not necessarily the root causes of the deterioration of the DWS services
(sections 1.4 and 1.5). This view is based on the fact that most problem solving models
recommend that it is the root causes that should be managed in order to solve problems
completely (Rebori, 1997; Restructuring Associates Incorporation, 2008). Therefore, the
“Does management of the root causes of sustainability failure of DWS services improve sustainability of DWS services in Malawi?”
1.7 AIM AND OBJECTIVES OF THE INVESTIGATION
To establish whether or not management of the root causes of sustainability failure of
DWS services improve sustainability of DWS services in Malawi, there is need to
compare sustainability of DWS services where the root causes are managed and where
they are not managed. However, review of the literature has shown that the root causes
of sustainability failure of DWS services have not yet been identified. This means that
before the comparison can be done, there is need to identify the root causes. Therefore,
the aim of this research is to identify the root causes of sustainability failure of DWS
services in Malawi, evaluate the outcomes of managing the root causes on sustainability
of DWS services, and develop a framework for managing the identified root causes. The study’s objectives are:
a. To assess sustainability of the quantity and quality of water available to the users in
the selected DWS systems in Malawi;
b. To identify the factors that affect sustainability of DWS services;
c. To establish relationships that exist amongst various factors that affect sustainability
of DWS services;
d. To find out the factors which need to be managed for sustainability of DWS services;
and
e. To develop a framework for holistic management of factors for sustainability of DWS
services in Malawi.
1.8 RESEARCH FOCUS AND BOUNDARIES
Holistic and life cycle approaches were followed in this study. Under holistic approach, a
DWS system was studied as a whole including water sources, infrastructure, capacity to
operate the infrastructure, and expectations of stakeholders from provision of drinking
water. This approach is supported by Kenel and Whitherspoon (2005) who state that
DWS involves water source protection, water treatment and all activities until the water is delivered at the consumer’s tap. All the issues related to these elements, that affect
factors that can affect DWS service sustainability. This was necessary to ensure that all
aspects of DWS service sustainability would be maintained.
In addition, under life cycle approach, all the issues in all the phases of a project that
affect sustainability of DWS services were studied. This was necessary to address all the
issues in the preceding phases which may affect DWS service sustainability in the
subsequent phases (Klöpffer, 2003; Lim and Mohamed, 1999).
1.9 RESEARCH PERSPECTIVE
This study was based on the perceptions of the service providers and water users. The
perceptions of the water users and the service providers are important in that two of the
key factors for a service to be sustainable are that the users should be satisfied with the
service (Agarwal and Rathod, 2006; Pinto and Slevin, 1994), and that the service provider’s expectations should be realised (Al-Tmeemy et al, 2011).
1.10 STRUCTURE OF THE THESIS
In addition to this introductory chapter (chapter 1), this thesis has chapters 2 to 5. The
thesis also has appendices A and B. Chapter 2 provides a critical review of the literature
on service sustainability. The review is based on books, journal articles, conference
papers, published case studies and other literature. The chapter outlines the factors and
frameworks for sustainability of DWS services. On the basis of the reviewed literature,
gaps have been established and research questions have been formulated accordingly.
Chapter 3 provides research methodology for the study. Bases for selecting a particular
paradigm and techniques for data collection and analysis have been provided. In
addition, chapter 3 provides criteria for selecting cases and details of the selected cases.
The chapter also outlines the participants in the research study.
Chapter 4 is where the findings of the study are presented. Based on the findings,
solutions for facilitating sustainability of DWS services in Malawi have been proposed.
The chapter also presents a holistic framework which has been developed in this
research for managing the factors that affect sustainability of the piped DWS services in
Malawi.
Chapter 5 provides a summary of the findings of this research and provides
sustainable. Contributions made by the study to DWS management are also presented in
the chapter. Finally, chapter 5 outlines the required further work to enhance the findings
of this research.
As regards appendices, Appendix A contains instruments used to collect data for this
research while Appendix B contains a journal paper published in the Journal of
Sustainable Development in Africa.
Chapter summary
Chapter 1 has set this research in context by providing information about the importance
of DWS, and the current DWS coverage globally, in the Sub-Saharan Africa and in
Malawi. Details on management and sustainability of DWS services in Malawi have also
CHAPTER TWO - LITERATURE REVIEW
Introduction
This chapter presents a critical review of the literature on sustainability of DWS services.
The definition and attributes of DWS service are presented in the chapter. The chapter
also outlines the factors and frameworks for service sustainability with particular
emphasis on sustainability of DWS services. On the basis of the reviewed literature,
gaps have been established and research questions have been formulated accordingly.
2.1 DRINKING WATER SUPPLY SERVICES
A service is the provision of a benefit (Lockwood and Smits, 2011). DWS service, which
is the subject for this research, is defined as a flow of water to the users (Lockwood and
Smits, 2011). There are a number of parameters that are used to measure whether or
not a DWS service is satisfactory. The parameters include: (i) distance to a water source;
(ii) time taken to collect water; (iii) number of people using one water source; (iv) number
of hours per day during which water is supplied; (v) quantity of water supplied;
(vi) pressure of water supplied; (vii) quality of water supplied; (viii) location of water point;
(ix) continuity of water supply; and (x) type of connection i.e. whether it is a house
connection, yard tap or communal water point (Bhandari and Grant, 2007; Carter et al,
1999; Howard and Bartram, 2003; Lockwood and Smits, 2011; Sara and Kartz, 1998).
It will be noted that apart from ‘quality of water supplied’, the rest of the parameters listed above are factors for facilitating ‘availability of adequate water to the users’. This shows
that the main indicators of whether or not a drinking water supply (DWS) service is
satisfactory are two; (i) safety, and (ii) adequacy of drinking water. The two parameters
are sufficient as these are all that is required for the main purpose of DWS (i.e. to
maintain and/or improve public health) to be achieved (AfDB, 2008; Carter et al, 1999;
Howard and Bartram, 2003). On this basis, the working definition of DWS service for this
research is a flow of water of a particular quality and quantity.
In terms of the recommended minimum requirements, in a study conducted by Carter et
al (1999), it was found out that most countries consider 20 litres per capita per day as the
As regards quality, water is said to be safe for human consumption if it satisfies physical,
organoleptic, chemical and biological requirements (Malawi Standards Board, 2005).
While this is the case, the most common and widespread health risk associated with
drinking water is microbial contamination (WHO, 2006). As such, and due to limited
financial resources available for this research, microbial contamination - specifically
faecal contamination - will be considered as a sole measure of the safety of water for
human consumption. After all, the disease burden caused by physical, organoleptic and
chemical contamination (non-diarrheal diseases) is far below that caused by microbial
contamination (diarrheal diseases) (Fewtrell et al, 2006). The study by Carter et al (1999)
established that most countries consider water with faecal coliforms not more than 10 per
100 millilitres as safe.
Other researchers, however, have their own recommendations. For example, Gleick
(1996) states that the minimum quantity of water used should be 50 litres per capita per
day in order for health benefits to be realised. Similarly, WHO (2006) states that the
number of coliforms in drinking water should be zero.
For Malawi, the minimum requirements for drinking water are as follows:
a. Quantity of water used should not be less than 36 litres per capita per day (Malawi
Ministry of Irrigation and Water Development, 1994); and
b. Quality of water should be such that the number of faecal coliforms per 100 millilitres
of water should not be more than 10 in 99% of the samples (Malawi Standards
Board, 2005).
As indicated in section 1.4, this research was conducted because these minimum
requirements were not satisfied in some of the DWS systems in Malawi as time passed
after commissioning of the water supply systems.
2.2 SUSTAINABILITY
The word ‘sustainability’ is derived from the Latin word ‘sustinere’ which means to uphold. Similarly, the English word ‘sustain’ means ‘maintain’ or ‘endure’ (Onions, 1964). This shows that the meaning of the word ‘sustain’ is not different from the meaning of the original Latin word ‘sustinere’. The basic meaning of the word is ‘maintain’.
As regards the technical meaning of the word ‘sustainability’, there is a broad range of
definitions in the literature. While most definitions are similar, there are some which are
normative connotations i.e. perception of sustainability by different people or groups of
people is based on the relative value of achieving their various goals (Hodgkin, 1994). As
such, different organizations look at sustainability from different perspectives. Examples
of the perspectives from which sustainability is looked at are technical performance,
health benefits, empowerment, social equity or environmental protection, among others
(Lockwood, 2003).
Since all aspects required for sustainability have to be maintained otherwise failure of
any one of them will render a project not sustainable (Abrams, 1998; Khan, 2000), the
definition by Bamberger and Cheema (1990) has been adopted for this research.
Bamberger and Cheema (1990) define sustainability as continuous delivery of benefits for a long time. This definition is based on the ultimate goal of a project of ‘providing some benefits’ (Lockwood, 2003) other than particular perspectives.
The aspects that need to be maintained for sustainability of benefits are technical,
managerial, policy, economic, financial, social, institutional, environmental and climatic in
nature (Griffiths, 2007; Harvey and Reed, 2004; Khan, 2000).
It should be noted that for benefits to be maintained, there is need for services to be
sustainable (Harvey and Reed, 2003; Khan, 2000; Parry-Jones et al, 2001; WELL,
1998). As indicated in the preceding sections, this research is about sustainability of
DWS services with regard to both quality and quantity of drinking water.
2.3 SERVICE SUSTAINABILITY
In line with the definition of sustainability adopted in section 2.2, service sustainability is
defined here as continued provision of services to the users. Specifically for DWS
services, Carter et al (1999) define DWS service sustainability as continued flow of water
at the same rate and quality as per the design of the supply system. This is the working
definition of DWS service sustainability for this study.
It is important that services should be sustainable. Firstly, some services like DWS can
only accomplish their purposes if they are available all the time (Sanders and Fitts,
2011). For example, if safe water is not available for some time, people will be forced to
use water from unsafe sources. Such people end up suffering from water borne diseases
implying that the provided DWS has failed to accomplish its main purpose of maintaining