How reliable are knee kinematics and kinetics during side-cutting
manoeuvres?
Sean P. Sankey1,2, Raja M. Firhad Raja Azidin1, Mark A. Robinson1, Bart Malfait3, Kevin Deschamps3, Sabine Verschueren3, Filip Staes3, Jos Vanrenterghem1
1Research Institute for Sport and Exercise Sciences, Faculty of Science, Liverpool John Moores University, Liverpool, UK. 2
Engineering, Sport and Sciences, University of Bolton, Bolton, UK 3
KU Leuven, Musculoskeletal Rehabilitation Research Group, Department of Rehabilitation Sciences and Physiotherapy, Faculty of Kinesiology and Rehabilitation Sciences, Belgium.
Gait and Posture
Abstract
Introduction: Side-cutting tasks are commonly used in dynamic assessment of ACL injury risk, but only limited information is available concerning the reliability of knee loading parameters. The aim of this study was to investigate the reliability of side-cutting data with additional focus on modelling approaches and task execution variables.
Methods: Each subject (n=8) attended six testing sessions conducted by two observers. Kinematic and kinetic data of 45° side-cutting tasks was collected. Inter-trial, inter-session, inter-observer variability and observer/trial ratios were calculated at every time-point of normalised stance, for data derived from two modelling approaches. Variation in task execution variables was regressed against that of temporal profiles of relevant knee data using one-dimensional statistical parametric mapping.
Results: Variability in knee kinematics was consistently low across the time-series waveform (≤5 °), but knee kinetic variability was high (31.8, 24.1 and 16.9 Nm for sagittal, frontal and transverse planes, respectively) in the weight acceptance phase of the side-cutting task. Calculations conveyed consistently moderate-to-good measurement reliability. Inverse kinematic modelling reduced the variability in sagittal (~6 Nm) and frontal planes (~10 Nm) compared to direct kinematic modelling. Variation in task execution variables did not explain any knee data variability.
Conclusion: Side-cutting data appears to be reliably measured, however high knee moment variability exhibited in all planes, particularly in the early stance phase, suggests cautious interpretation towards ACL injury mechanics. Such variability may be inherent to the dynamic nature of the side-cutting task or experimental issues not yet known.
KEY WORDS:
Variability; inverse kinematics; direct kinematics; ACL injury; sample size Corresponding author:
Sean P Sankey
Introduction
The occurrence of non-contact lower-limb injury in sports that involve dynamic sporting tasks is a substantial burden on clubs and their players, both financially and in terms of playing time [1,2]. Attempts to explore the mechanics of knee ligament injury, particularly of the anterior cruciate ligament (ACL), are well documented and frequently involve the estimation of knee kinematics and kinetics during side-cutting tasks [3-8]. Side-cutting is commonly used as it challenges the knee in a manner that is consistent with the reported ACL injury mechanism [9], and therefore could be important to assess ACL injury risk. Thus, it is important to know the reliability of side-cutting data, as well as the variability within typical protocols so that appropriate limits for detectable differences can be established, and the correct interpretation of injury risk made.
We also take the opportunity to address i) the reliability of the modelling approach as this can affect knee kinematics and kinetics [14] and ii) the variability of the task itself. Firstly, different modelling approaches can be chosen to either allow or restrict joint rotations or translations and also attempt to reduce soft tissue artefact. In a recent comparison of the direct kinematic (DK) versus inverse kinematic (IK) modelling approaches [14], significantly larger peak knee abduction moments were found using the DK approach yet the reliability of two approaches are unknown. Secondly, as variability can also exist through variations in the execution of the side-cutting task itself, we quantify whether knee kinematic and kinetic variability can be explained through inherent variations in task execution. Such information will help to standardise modelling approaches and evaluate the importance of task execution.
The purpose of this study was to investigate the reliability of side-cutting data from an inter-trial, inter-session, and inter-observer perspective. This will be complemented by investigating the reliability of two modelling approaches (DK vs. IK), and by examining the contribution of the side cutting task execution to the variability observed.
Methods
Participants
The participants for this study were eight recreationally active soccer players who had at least 6 years of playing experience and trained 1-2 times per week (four male; four female; age - 25.8 ±4.4 years; mass - 64.8 ± 7.2 kg; height - 1.7 ± 0.1 m). All participants had no reported ACL injury and had been injury free for six months prior to data collection. All participants wore tight fitting shorts and standardised indoor footwear (Highroad). Females also wore a cropped vest, tight fitting base layer or sports bra. Ethical approval for this study was granted by the institutional ethics committee, and written consent was obtained from all participants.
Protocol
Systems, Utah, USA) which were placed 2 m apart, and 2 m from the force plates, where the side-cutting was performed. Cones were also placed 3 m from the force plates to mark a target gate at the required 45°. Trials were excluded if approach speed was not between 4 and 5 m·s-1, targeting of the force plate was observed, or if the subjects did not achieve the angle of 45° determined by running between the cones.
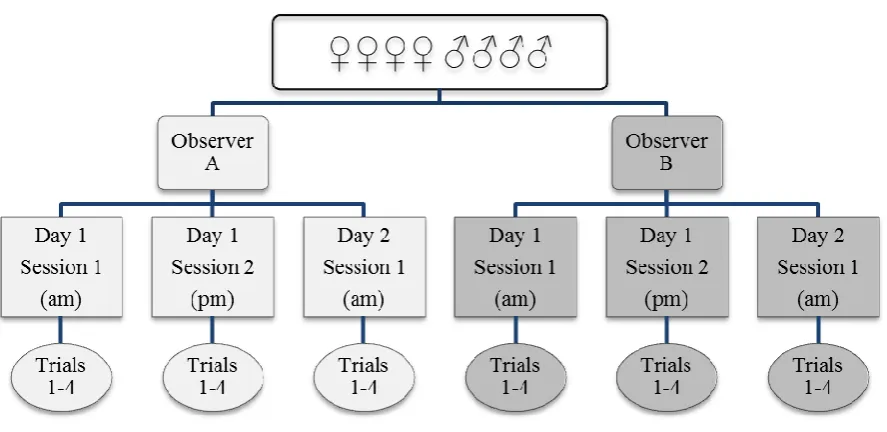
Data were collected by two different observers using a repeated measures design over six separate sessions; four on day one, and two on day two (Fig. 1). The observers were both PhD students and had been working with this biomechanical model for approximately 4 months previous, in both application and processing. The two observers conducted three sessions each; two each on day one, and one each on day two, with 48 hours between day one and two. This allowed each participant to be tested by each observer, within and between days. A 10-minute cool down session was conducted before a 15-minute rest, and then the next session would start.
Data collection
All side-cutting was performed over a 0.9 x 0.6 m Kistler force platform (9287C, Kistler Instruments Ltd., Winterthur, Switzerland) sampling at 1500 Hz for the measurement of ground reaction forces. Simultaneous kinematic data was recorded in Qualisys Track Manager (Qualisys AB, Gothenburg, Sweden) using 10 optoelectronic cameras (Oqus 3, Qualisys AB, Gothenburg, Sweden) sampling at 250 Hz.
Biomechanical model
Data and statistical analysis
Marker coordinate and force data were filtered using a Butterworth 4th order low pass filter with a 20 Hz cut-off frequency [16]. Touch-down and toe-off events were identified using a threshold of 20 N. For the comparison of modelling techniques, DK and IK kinematics were used separately to estimate the net external moments using inverse dynamics. Knee angle and moment data (order of rotations – X, Y, Z) from sagittal, frontal and transverse planes was normalised, to 101 data points, for the contact phase of side-cutting. All mean peak knee angle and moment data, for three planes, were calculated during the weight acceptance phase of the side-cutting. The weight acceptance phase was defined as 0-25% of normalised ground contact for this study.
The inter-trial, inter-session and inter-observer variability were estimated using the procedures outlined in Schwartz et al. [17]. As well as the point by point calculation over the entire contact phase, inter-observer variability was also expressed as a ratio to inter-trial variability. The same variability calculations (inter-trial, -session and –observer) were made for both modelling techniques, as well as calculation of overall average curves and standard deviations for angle and moment data, in all three planes.
One-dimensional statistical parametric mapping (SPM, [18]) was used to examine the relationship between the DK knee angle and moment waveforms and selected task execution (TE) variables (resultant centre of mass (CoM) touchdown velocity; CoM toe-off velocity; CoM touchdown, and toe-off cutting angle; contact time; and both horizontal, and vertical impulses). This was similar to a recent investigation looking at the influence of approach speed on knee kinematics and kinetics during side-cutting [19]. The following linear regression models were defined:
Knee angle (t) = (β1(t) × TE variable) + α1(t) + ε(t) Knee moment (t) = (β2(t) × TE variable) + α2(t) + ε(t)
Results
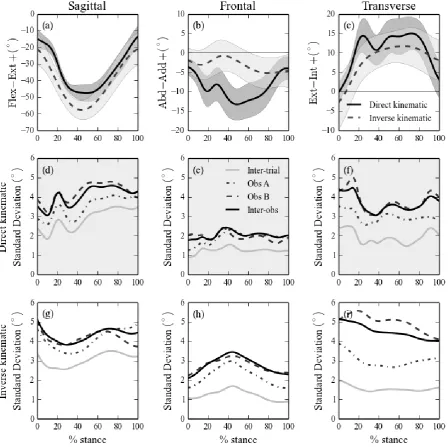
For all kinematics, inter-trial, -session and -observer variability was below 5.5° for the full waveforms, in all planes (Fig. 2d-f). The inter-trial variability was consistently lowest and no part of the waveform provided consistently higher variability. Typically the waveforms of the trial variability were similar but lower in magnitude than the inter-session and inter-observer variability.
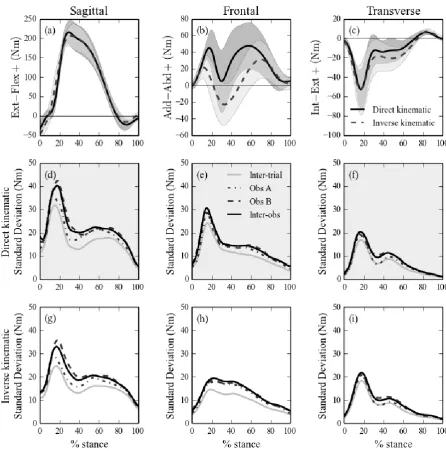
In the kinetic, the weight acceptance phase of normalised ground contact (0-25 %) provided the largest inter-trial, inter-session and –observer variability with peak magnitudes of all types of variability for the sagittal plane, frontal plane and transverse plane ranging between 32-42 Nm, 24-31 Nm and 17-20 Nm, respectively (Fig 3, d-f). Inter-trial variability was lowest across all kinetic waveforms peaking at 32, 24 and 17 Nm for sagittal, frontal and transverse knee moments, respectively. Inter-session and –observer variability echoed the waveforms of inter-trial variability, but at a higher magnitude across the time-series. Differences between inter-trial variability and inter-session/–observer variability were highest in the sagittal plane and lowest in the transverse plane.
Mean peak knee kinematics and kinetics (± standard deviation) from weight acceptance were presented for DK and IK, in all three planes, in addition to the mean inter-observer/inter-trial variability ratios for the same variables (Table 1). Where peaks were not clear in weight acceptance, the value at the upper threshold (25%) was used (‘*’ denotes this occurence in Table 1). Greater inter-observer/inter-trial ratios were found for IK in the frontal and transverse planes (2.3 and 2.9, respectively) versus DK (1.6 and 1.9, respectively).
Nm reduction) and frontal plane knee moment (~ 10 Nm reduction), but variability for the transverse plane knee moment remained similar.
Variation in kinematic or kinetic profiles was not explained by variation in any of the task execution variables, as demonstrated in the SPM regression analysis by non-significant relationships. An example of SPM linear regression is also provided (Fig. 4). All SPM analyses are available as supplementary material (see Supplemental Digital Content 1).
Discussion
The primary aim of this study was to investigate the reliability of side-cutting data using inter-trial, inter-session and inter-observer observations. Whilst kinematic data variability was consistently low across the time-series, irrespective of plane, kinetic data variability was distinctly elevated to seemingly high magnitudes in the weight acceptance phase. Such observation is a concern when pursuing typical ACL injury markers, such as frontal plane knee moments, however, it is important to consider the source and proportionality of variability, to fully interpret the reliability of this data.
Previously, kinematic and kinetic data from side-cutting has been suggested to be reliable, in inter-trial and inter-session observations [11-13]. However, the current study is the first to investigate and present variability for every point across the time-series for side-cutting data signals. Furthermore, the variability data suggests that the main issue lies with an inherently high inter-trial variability, and the addition of multiple sessions and observers has minimal impact. This is further supported by the observer/trial ratios, where the impact of multiple observers, and the experimental implications that introduces (e.g. marker placement), is less influential in kinetic data than kinematics. This is important for studies using multiple sessions and observers, but requires further exploration of inter-trial variability
proportional comparison of kinetic signal against observed variability may help to identify the impact of such variability on clinical inference. In the present study the knee kinetic trial-to-trial variability represented approximately 15, 56 and 34 % of the average peak knee moment for sagittal, frontal and transverse planes, respectively. In Malfait et al. [15], for drop vertical jumps, the knee moment trial-to-trial variability represented approximately 14, 26 and 29 % of the average peak knee moment. Thus, although the side-cutting task places a greater planar demand in execution compared to the drop vertical jump, the greatest variability may be considered proportionally similar at least in flexion/extension and internal/external rotation. The proportional variability in abduction/adduction is greater for side-cutting kinetics, compared to drop vertical jumps [15], and is likely to be due to the larger horizontal forces required to execute the task.
Comparison of modelling approaches suggests a potential benefits of IK compared to DKas IK showed a reduction in variability reported in both the sagittal (~6 Nm) and frontal planes (~10 Nm). Therefore, the IK modelling approach could potentially offer an alternative when we are looking to reduce variability in observing knee sagittal and frontal plane loading. Increased variability in the DK approach could be due the soft tissue artefact which directly influences the calculated kinematics. DK modelling approaches would therefore require greater sample sizes to detect the same magnitude of effect as the IK approach. However, interpretation of the inter-observer/inter-trial ratio suggests that IK modelling may be more sensitive to multiple observers than DK modelling for kinematic data (see Table 1). The specific causes of this discrepancy are unclear though. It may be that IK modelling “filters” true signal by fitting measured motion to the model and does not simply remove the effect of soft tissue artefact. This however requires further investigation.
High magnitudes of variability also have implications for the magnitudes of a detectable difference and therefore study design, in terms of sample recruitment. To illustrate this, sample size estimation was calculated for a one sample t-test. To observe a difference ≥10 Nm in the peak knee joint moment in the frontal plane (for DK only) a sample size of n≥48 is required (refer to Supplemental Digital Content 2) based on our inter-trial variability of 24.1 Nm and a statistical power of 80 %. As the inter-session and inter-observer variability were greater than the inter-trial variability, additional participants would be required to detect the same 10 Nm difference (n=67 and n=76, respectively) in study designs requiring participants to be tested in different sessions or by different observers. Although 10 Nm was chosen as an arbitrary value, this indicates the relationship between the study design, the detectable difference, sample size and statistical power. The sample sizes calculated here are model and lab-specific therefore similar processes should be undertaken by other labs.
Limitations to this study were that no between-subject observation was made, which may potentially contribute to sources of reported variability. This would be an opportunity for further research, as would investigation of other potential ACL injury variables during side-cutting that may not just be associated with the knee. It is possible that adjusting the dispersion or number of sessions, or the addition of further observers may have some impact on inter-session or inter-observer variability, however, the analyses was based on 192 trials of data using similar research design as published previously for relevant reliability studies [15,17]. Thus, the main aim moving forward must be to explain the remaining inter-trial variability observed in the kinetic signal. Indeed, inherent variability of the method derived from such experimental concerns as soft tissue artefact may reduce the inter-trial variability.
Conflict of Interest
The authors declare that no financial or personal relationship exists which may have influenced this manuscript.
Disclosure of Funding
None
Acknowledgments
References
[1] Hawkins RD, Hulse MA, Wilkinson C, Hodson A, Gibson M. The association
football medical research programme: an audit of injuries in professional football. Brit J Sport Med 2001;35:43–7.
[2] Myers CA, Hawkins D. Alterations to movement mechanics can greatly reduce anterior cruciate ligament loading without reducing performance. J Biomech 2012;43:2657–64.
[3] Besier TF, Lloyd DG, Ackland TR, Cochrane JL. Anticipatory effects on knee joint loading. Med Sci Sport Exer 2001;33:1176–81.
[4] Houck JR, Duncan A, De Haven KE. Comparison of frontal plane trunk kinematics and hip and knee moments during anticipated and unanticipated walking and side step cutting tasks. Gait Posture 2006;24:314–22.
[5] Kristianslund E, Krosshaug T. Comparison of Drop Jumps and Sport-Specific Sidestep Cutting: Implications for Anterior Cruciate Ligament Injury Risk Screening. Am J Sport Med 2013;41:684-8.
[6] Landry SC, McKean KA, Hubley-Kozey CL, Stanish WD, Deluzio KJ. Gender differences exist in neuromuscular control patterns during the pre-contact and early stance phase of an unanticipated side-cut and cross-cut maneuver in 15-18 years old adolescent soccer players. J Electromyogr Kines 2009;19:e370–9.
[7] McLean SG, Huang X, van den Bogert AJ. Association between lower extremity posture at contact and peak knee valgus moment during sidestepping: implications for ACL injury. Clin Biomech 2005;20:863–70.
[8] Pollard CD, Davis IM, Hamill J. Influence of gender on hip and knee mechanics during a randomly cued cutting maneuver. Clin Biomech 2004;19:1022–31.
[9] Markolf KL, Burchfield DM, Shapiro MM, Shepard MF, Finerman GAM, Slauterbeck JL. Combined knee loading states that generate high Anterior Cruciate Ligament Forces. J Orthopaed Res 1995;13:930–5.
[10] Ford KR, Myer GD, Toms HE, Hewett TE. Gender Differences in the Kinematics of Unanticipated Cutting in Young Athletes. Med Sci Sport Exer 2005;37:124–9. [11] Sigward SM, and Powers CM. The influence of gender on knee kinematics, kinetics
and muscle activation patterns during side-step cutting. Clin Biomech 2006;21:41–8. [12] Sigward SM, and Powers CM. The influence of experience on knee mechanics during
side-step cutting in females. Clin Biomech 2006;21:740–7.
[14] Robinson MA, Tsao J, Donnelly CJ. Impact of knee modelling approach on markers and classification of ACL injury risk. Med Sci Sport Exer 2014;46:1269-76.
[15] Malfait B, Sankey SP, Raja Azidin RMF, Deschamps K, Vanrenterghem J, Robinson MA,et al. How reliable are lower limb kinematics and kinetics during a drop vertical jump? Med Sci Sport Exer 2014;46:678-85.
[16] Kristianslund E, Faul O, Bahr R, Myklebust G, Krosshaug T. Sidestep cutting
technique and knee abduction loading: implications for ACL prevention exercises. Brit J Sport Med 2014:48:779-83.
[17] Schwartz MH, Trost JP, Wervey RA. Measurement and management of errors in quantitative gait data. Gait Posture 2004;20:196–203.
[18] Pataky TC. One-dimensional statistical parametric mapping in Python. Comp Method Biomech Biomed Engineer 2012;15:295–301.
[19] Vanrenterghem J, Venables E, Pataky T, Robinson MA. The effect of running speed on knee mechanical loading in females during side cutting. J Biomech 2012:45:2444-9.
[20] Heiderscheit B. Movement variability as a clinical measure for locomotion. J Appl Biomech 2000;16:419–27.
Tables
Table 1, Direct kinematic (DK) and inverse kinematic (IK) derived peak mean (± SD) knee
angle (deg) and knee moment (Nm) data from weight acceptance phase. Mean inter-observer/ inter-trial ratio, for DK and IK modelling, over full time series for knee angle and moment data for side-cutting.
Sagittal (FLEX/EXT) Frontal (ABD/ADD)
Transverse
(IR/ER)
DK IK DK IK DK IK
Mean Peak
Angles (deg)
-36.41 *
-46.28
* -9.93 -3.12 14.38 7.52 *
SD 3.1 5.74 3.99 3.83 4.34 4.59
Mean
Observer/trial ratio
1.4 1.4 1.6 2.3 1.9 2.9
Mean Peak
Moments (Nm)
197.6 * 187.6 * 45.0 21.4 -52.8 -52.9
SD 23.8 18.0 19.62 19.8 20.3 26.3
Mean
Observer/trial ratio
1.3 1.3 1.3 1.4 1.3 1.3
NB. ’*’ denotes no clear peak was observed in weight acceptance of normalised ground
contact.
Fig. 2. Kinematic data and error data for the knee in all three planes – planar data are in one
Fig. 4. An example of the SPM analysis used to linearly regress task achievement variables
Supplemental Digital Content
Supplemental Digital Content 1, All statistical parametric mapping (SPM) data.
This appendix contains the linear regression analysis for the task execution variables and the knee angle and moment components. There are no significant relationships between the task execution variables and the angle and moment components that coincide with the times of high variability during weight acceptance.
Please download from the following link:
Supplemental Digital Content 2, Sample size estimation.