Nonlinear Analysis of Interaction with SVC in Stressed Power
Systems: Effect of SVC Controller Parameters
R. Zeinali Davarani*, R. Ghazi** and N. Pariz**
Abstract: In this paper, the effect of Static VAr Compensator (SVC) parameters on the
nonlinear interaction of steam power plant turbine-generator set is studied using the Modal Series (MS) and Normal Form (NF) methods. A second order representation of a power system equipped with SVC is developed. Then by MS and NF methods, the nonlinear interaction of torsional modes is assessed under various conditions and the most influencing factors are determined. Furthermore, to better analysis the nonlinear interaction between torsional modes and SVC controllers new nonlinear interaction index is defined. The results show that the stress conditions and some SVC control parameters will adversely affect the dynamic performance of a power system by increasing the nonlinear interaction of torsional modes. In this situation, the nonlinear modal analysis techniques especially MS method can precisely provide a reliable prediction of the torsional oscillations amplitudes and the frequency content of the output system response. As the angle and speed of turbine-generator segments are used as input signals in several controllers, the frequency content of these signals are quite important in designing such controllers. This analysis is performed on a 4-areas WSCC system, which is equipped with a SVC.
Keywords: FACTS Devices, Modal Series Method, Nonlinear Analysis, Nonlinear
Interaction.
1 Introduction1
The potential for interactions between the turbine-generator shaft, and other system devices has long been a consideration in the design of bulk-power systems. A steam power plant turbine-generator set consists of several masses connected to each other by shaft segments having bounded stiffness coefficients. The modes associated with these masses are known as torsional modes. The interaction between torsional modes and system controllers like FACTS devices is known as subsynchronous torsional interaction (SSTI) [1]. The SVC is one of FACTS devices that used in power system to improve the voltage profile and increase the stability limits [2-3]. The installation of SVC in power systems may lead to the occurrence of SSTI phenomenon. Depending on the power system conditions and the parameters of SVC controllers, the interaction may be negligible or critical. In case of adverse SSTI, the torsional oscillations amplitudes and
Iranian Journal of Electrical & Electronic Engineering, 2013. Paper first received 10 Jun. 2012 and in revised form 9 Mar. 2013. * The Author is with the Department of Electrical Engineering, Graduate University of Advanced Technology, Kerman, Iran. ** The Authors are with the Department of Electrical Engineering, Ferdowsi University of Mashhad, Mashhad, Iran.
E-mails: [email protected], [email protected] and [email protected].
their periods are increased, so in long term may give rise to a significant reduction in the lifetime of the shaft [1]. In this respect, the precise analysis of SVC torsional interaction and estimating the torsional oscillations amplitudes, periods, and frequency contents can be quite important. In [4-7], the SSTI phenomenon with SVC is assessed using linear modal analysis and the time domain simulation approaches.
In time domain approach, the necessary information corresponding to the dynamic behavior of the system is not provided. On the other hand, the linear analysis method also cannot well demonstrate the nonlinear interaction phenomena [8].
In stressed power systems, especially those equipped with FACTS devices, the nonlinear effects are significantly increased, and nonlinear analysis methods are needed to investigate the dynamic performance of power systems. Therefore, in cases where the power system is under stress, the linear analysis approach cannot exactly analyze the SSTI phenomenon and so cannot estimate the torsional oscillations amplitudes and their frequency content.
In this situation, the nonlinear modal analysis approaches such as Normal Form (NF) or Modal Series (MS) methods should be used to investigate the dynamic behavior of power systems. In recent years, the
NF and MS methods have been used to study the power system dynamic phenomena [8-17]. In these papers, it is shown that in stressed power systems, the possibility of the nonlinear interaction increased. In [9], by use of the NF method, it is shown that the nonlinear interaction affects the behavior of the controllers, which are designed based on the linear theory. In [10] the nonlinear measures of modal controllability and observability are developed based on NF method. In [11-12], the NF is used to analyze the interaction of SVC with inter-area modes and the interaction between multiple SVCs. In [8, 13], MS method has been employed for analyzing the dynamic behavior of stressed power systems. These papers show that the nonlinear interaction between linear modes makes the response of the nonlinear system differ from linear modal results. In [14], the accurate nonlinear estimated model is derived from MS method that could be used in controller design and studying the time domain signals in nonlinear systems, especially in power systems. In [15], by using MS method the dynamic behavior of power system has been studied under stressed conditions and near instability. In [16], MS method is used to obtain the second and first-order solutions of torsional dynamics torques in the IEEE FBM test system. In [17], based on the MS method by using the theorems of multidimensional Laplace transform an extension of the MS method has been performed to solve the dynamic nonlinear system as an algebraic problem.
Regarding the importance of the nonlinear effects on the SSTI phenomenon, in the previous work the nonlinear interaction between torsional modes and SVC controllers is studied using the MS method [18]. Although the MS method renders some advantages in presenting the nonlinear system [8, 19], but in the present study the NF method is also used due to its more general applications in power systems. Furthermore, to extend the previous work, in the present paper this subject is precisely analyzed considering the most effective factors through comparative assessment. In addition, in this paper the impact of SVC parameters on the nonlinear interaction between torsional modes and SVC controllers is studied. To do so, at first, the second order Taylor expansion of equations governing the power system equipped with SVC is performed around the stable operating point. Then by using the MS and NF methods and the corresponding indices, the required quantitative assessment of SSTI is fulfilled. In addition, the proper nonlinear interaction index is defined to well investigate the effects of SVC parameters on nonlinear torsional interactions. In addition, time domain simulation is used to confirm the obtained analytical results. The paper is organized as follows. In Section 2, the mathematical model of the power system is presented. The nonlinear modal analysis methods are introduced in Section 3. The case study and the obtained
results are shown in section 4. The conclusions are given in section 5.
2 Mathematical Model of a Power System with SVC
To study the nonlinear interaction of torsional modes with SVC controllers, the dynamic equations governing the studied power system should be defined. The study system comprises the steam turbine, synchronous generator, transmission line, and SVC.
2.1 Synchronous Generator Equations
The d-q axes model is used to represent the synchronous generator. In addition, a thyristor-based exciter with a high transient gain is considered as the excitation system. The synchronous generator equations are obtained as follows:
(
)
(
)
(
)
(
)
(
)
(
)
( )
( )
(
)
i i i i i i i
i i i i i i
i i i i i i i
' ' ' '
q fd q d d q d0
' ' ' '
d d q q d q0
fd fd exc ref t s exc i s
i m e
E = E - E + x - x I τ
E = -E - x - x I τ
E = -E + K V - V + V T
δ =ω ω-1
ω = T - T - D ω-1 2H
&
&
&
&
&
(1)
where
i
s
V is supplementary signal of the excitation system and
i
t
V is the terminal voltage of the ith machine. The state variables and parameters in Eq. (1) have the same meaning as in [20].
2.2 SVC Representation
SVC is a shunt compensation device that normally includes the Thyristor Switched Capacitors (TSCs), Thyristor Control Reactors (TCRs) and control system [21]. The single-line diagram of the SVC is shown in Fig. 1.
The block diagram of the controller used for the SVC is shown in Fig. 2 [22]. Based on this model for SVC k, dynamic equations are described by Eq. (2).
(
)
(
)
(
)
(
)
k k k k
k k k k k k k
k k k k k
k k k k k k
REF
meas tsvc meas m
1 meas 1 meas 1 2
ref 1 ref
svc ref d ref svc b
svc svc
V = V - V T
V = V - V - T V - V T
B = K V - B T
B = B - T B - B T
&
& &
&
& &
(2)
where
k
tsvc
V is the terminal voltage of kth SVC.
Fig. 1 Single-line diagram of SVC. b T ‐ T d s 1 es 2 1 T T s 1 s 1 svc svc K T 1 s m T s 1 1
Fig. 2 SVC control system block diagram.
2.3 Network Representation
Assume that in a power system with n bus there are ng generator, ns SVC and nl load bus without voltage
support equipment. For the sake of simplicity the generator buses are ordered as {l, …, ng}, followed by
buses at which SVCs are installed {ng+1, …, ng+ns} and
finally, the load buses without SVC {ng+ns+1, …, n}.
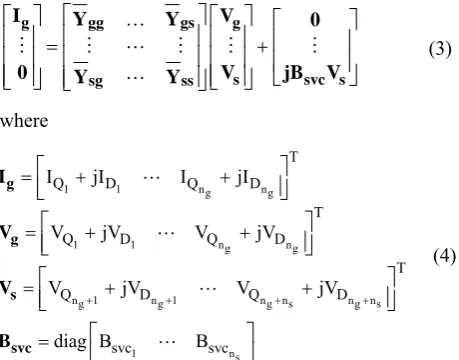
By eliminating the load buses without voltage support, the reduced admittance matrix is obtained as:
= + ⎡ ⎤ ⎡ ⎤ ⎡ ⎤ ⎡ ⎤ ⎢ ⎥ ⎢ ⎥ ⎢ ⎥ ⎢ ⎥ ⎢ ⎥ ⎢ ⎥ ⎢ ⎥ ⎢ ⎥ ⎣ ⎦ ⎢ ⎥ ⎢ ⎥⎢ ⎥ ⎣ ⎦ ⎣ ⎦⎣ ⎦ K
M M L M M M
L
g gg gs g
s svc s
sg ss
I Y Y V 0
0 Y Y V jB V
(3)
where
1 1 ng ng
1 1 ng ng
ng 1 ng 1 ng ns ng ns
1 ns
T
Q D Q D
T
Q D Q D
T
Q D Q D
svc svc
I jI I jI
V jV V jV
V jV V jV
diag B B
+ + + + = + + = + + = + + = ⎡ ⎤ ⎢ ⎥ ⎣ ⎦ ⎡ ⎤ ⎢ ⎥ ⎣ ⎦ ⎡ ⎤ ⎢ ⎥ ⎣ ⎦ ⎡ ⎤ ⎣ ⎦ L L L L g g s svc I V V B (4)
Using an appropriate coordinate transformation, the network current Ig and voltage Vg can be expressed in machine d-q coordinate. Then by solving the equations Eq. (3) the current Iqd is obtained in terms of the generator internal voltage E′qd [20].
3 Approximate Solutions Based on Modal Analysis
In general, it is impossible to obtain a closed solution for nonlinear systems. Therefore, the approximate methods can be used to study the behavior of nonlinear systems. These methods are based on Taylor expansion of nonlinear system equations around the stable equilibrium point. If Eq. (5) exhibits the nonlinear dynamic equations of a power system with N variables, Eq. (6) will be the Taylor expansion of Eq. (5) around the stable equilibrium point.
= ( )
&
X F X (5)
t i
i i
1
x = ... i 1, 2,..., N 2
+ + =
& A X X H X (6)
In Eq. (6), A and H,respectively, denote to Jacobian
and Hessian matrices. By applying the linear transformation X=UY to first and second order terms of
Eq. (6), yields: t
j j j
n n j
j j k 1 l 1 kl k l
y λ y
= λ y C y y j 1, 2, , n
= =
= +
+
∑ ∑
= …& Y CY
(7)
where λj is eigenvalue and C is defined as:
(
)
n p 1
j t t p
jp
1 V j 1, 2, , n 2 =
=
∑
= …C U H U (8)
where U and V, respectively, denote the matrices of
right and left eigenvectors of Jacobian matrix A.
3.1 Linear Method
If in Eq. (7) only the first term is considered and the higher-order terms are neglected, the linear approximate solution of Eq. (5) in Y-coordinate becomes:
j
λt j j0
y t( )=y e (9)
3.2 Normal Form Method
If the second order resonance does not exist (the inequality λ + λ ≠ λk l j is satisfied), the NF nonlinear transformation of Eq. (7) is defined by [8]:
( )
= + 2
Y Z h Z (10)
where
(
)
j n n j k l kl k 1 l 1 j jk l j
kl kl k,l,j
h2 z z
h2 C 1,2
)
, ,n
( = = =
= λ + λ − λ = …
∑ ∑
2
h Z
(11)
By introducing this transformation in Eq. (7) and retaining up to second order terms, the NF second-order approximate solution of Eq. (5) in Y-coordinate is given by [9]:
j
k l
t
j j0
j
n n ( t
k0 l0 kl
k 1 l 1 )
y t z e
+ h2 z z e
( ) λ
λ +λ
= =
=
∑ ∑
(12)In Eq. (12) the initial conditions Z0 are calculated by numerical solution of the nonlinear equations
( )
0+ 2 0 − 0=0 Z h Z Y [23].
3.3 Modal Series Method
By considering first and second order terms in Eq. (7), the MS second order approximate solution of Eq. (5) in Y-coordinate is obtained as follows [8]:
{
}
(
)
(
)
j
k l
t j
n n
j j0 k 1 l 1 kl k0 l0 j
n n ( + t
k0 l0 kl
k 1 l 1 )
( )
y t y h2 y y e
h2 y
y e
λ
= =
λ λ
= =
=
+
−
∑ ∑
∑ ∑
(13)3.4 Nonlinear Interaction Indices Based Modal Series and Normal Form Methods
To analyze the nonlinear behavior of a power system using the MS and NF methods, the nonlinear interaction indices can be used. The nonlinear interaction index is an approximate expression, which determines the level of nonlinear interaction of a system mode with other modes. With respect to MS and NF solutions, by comparison the amplitude of nonlinear mode e(λ λk+ l) with linear mode eλj the following indices can be
defined:
(
j)
k0 l0 kl k,l
n n j
j0 k=1 l=1 kl k0 l0
MI2( j)
max h2 y y
y h2 y y
=
⎛ ⎞
⎛ − ⎞
⎠
⎟
⎜ ⎟
⎝
⎜
⎝
∑ ∑
⎠(14)
(
j)
k0 l 0 j0 kl
k,l
NI2( j)= max h2 z z z (15)
The indices MI2 and NI2 show that which nonlinear mode has the most effect on the linear mode j. The high value of these indices implies the existence of severe nonlinear interaction between system components related to j-th mode with system components related to k-th and l-th modes.
When it is intended to investigate the effect of an especial nonlinear mode on the nonlinear interction with the linear mode j, the coefficient MCklj defined in Eq. (16) is used.
(
)
j kl
j k0 l0 kl
n n j
j0 k=1 l=1 kl k0 l0
MC
h2 y y
y h2 y y
=
⎛ − ⎞
⎜ ⎟
⎝
∑ ∑
⎠(16)
4 Case Study
For analyzing the nonlinear interaction between
steam power plant turbine-generator and SVC controllers, the 4-areas WSCC system that is equipped with a SVC is used. The single-line diagram of the studied system is shown in Fig. 3. Since bus 5 experiencing the worst voltage profile, the SVC is installed in this bus. The test system parameters are found in [20], and their summaries are listed in Appendix.
4.1 Eigenvalue Analysis of Study System
The first-order Taylor expansion of the test system equations is obtained and the fundamental modes and the corresponding system components are determined using the approximate linear analysis. For the sake of simplicity, only the generator G2 is considered as steam unit and the nonlinear interaction between SVC and torsional modes of this generator is studied. The turbine-generator of the thermal unit in the test system is modeled by five torsional masses represent a high-pressure (HP) turbine section, three low-pressure (LPC, LPB, LPA) turbine sections, and the rotor of the generator (GEN).
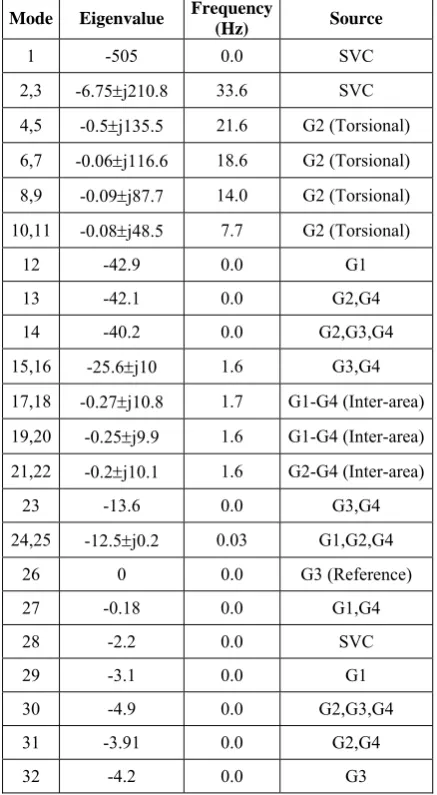
The test system modes are shown in Table 1. As seen the modes 4, 6, 8 and 10 reveal the torsional modes of generator G2.
4.2 Nonlinear Analysis of Interaction Between Turbine-Generator and SVC Controllers
To study the nonlinear interaction between turbine-generator set and SVC controllers by MS and NF methods, the second-order Taylor expansion of test system equations is obtained. The stress condition is provided by increasing the clearing fault time [11]. In normal and stress conditions, the fault is cleared respectively in 0.15 and 0.35 second. The fault is applied on line connected between buses 4 and 6, and this line is opened at the instant of fault and closed after its clearance. According to the MS and NF nonlinear interaction indices presented in section 3, the nonlinear interaction between torsional modes and other system
Fig. 3 Single line diagram of the test system.
components are investigated in normal and stress conditions. The modes suffering the maximum nonlinear torsional interaction along with the levels of nonlinear interaction are shown in Table 2.
As seen from Table 2, the results of MS and NF methods show that in the absence of SVC, the nonlinear interaction of torsional modes occurs with the exciter system of generator G1 (mode 12) and inter-area mode (modes 17 and 19). In this case, stress condition has no noticeable effects on the nonlinear interaction of torsional modes. Whereas in the presence of SVC the maximum nonlinear interaction of torsional modes occurs with SVC controllers and exciter systems (mode 2, mode 3 and mode 13) and the stress condition noticeably increases the nonlinear interaction.
The results show that in some cases the NF and MS methods leading to different results regarding the detection of the nonlinear mode having maximum interaction with torsional modes. This matter indicates
that to obtain the accurate analytical results selecting the appropriate nonlinear modal analysis method is quite important. As shown in [8] the validity region of the MS method is independent of the resonance between modes and in contrast to NF method it does not use the nonlinear transformation. The NF nonlinear index NI2 is computed based on the initial conditions Z0, which in turn calculated by solving a set of nonlinear equations. Regarding the problems that we are encountered in solving the nonlinear equations and the possibility of existence of several solutions, one can conclude that the validity of NF indices is less than that of MS indices. Therefore, in the rest of the paper only the MS method is used to analysis the nonlinear interaction.
To validate the analytical results obtained by MS method, in the presence of SVC the output response of the test system is calculated using the nonlinear step by step simulation, approximate linear and modal series methods. The torsional torques imposed to the shaft segments of G2 and the generator speed along with their frequency contents are shown in Figs. 4 and 5.
The simulation results show that the MS response well follows the nonlinear response while the approximate linear response is noticeably different from nonlinear one. As seen from Fig. 4, the MS method well predicts the amplitude of torsional oscillations and the frequency content of the torques imposed to the shaft. However, the obtained results from MS method show that the turbine-generator shaft is subjected to damage but the linear method cannot precisely estimate the amplitudes of torsional oscillations. In addition, the frequency analysis obtained by linear method cannot be reliable. For example, the linear method cannot truly reveal the importance level of frequency 7.7Hz and 18.6Hz in the torque LPB-LPA; however, the MS well indicate the importance level of these frequencies in the related torsional torque.
Table 2 Nonlinear Interaction Indices MI2 and NI2 at Torsional Modes in Different Conditions.
Nonlinear Interaction
Indices
Torsional Mode
Without SVC With SVC Normal
Condition
Stressed Condition
Normal Condition
Stressed Condition
MI2
4 0.11(12,19)0.13(12,19) 0.07(2,3) 0.26(2,3) 6 0.12(12,19)0.12(12,19) 0.11(2,3) 0.24(2,3) 8 0.26(12,19)0.29(12,19) 0.17(2,3) 0.47(2,3) 10 0.18(12,19)0.15(17,17) 0.15(2,3) 0.30(2,3)
NI2
4 0.99(12,12)1.15(12,12) 0.08(2,3) 0.59(2,13) 6 0.89(12,12)1.17(12,12) 0.13(2,3) 0.61(2,13) 8 1.1(12,12) 1.28(12,12) 0.22(2,3) 0.54(2,13) 10 1.25(12,12)1.26(12,12) 0.18(2,3) 0.4(2,13) Table 1 Eigenvalues of the Test System.
Mode Eigenvalue Frequency
(Hz) Source
1 -505 0.0 SVC
2,3 -6.75±j210.8 33.6 SVC 4,5 -0.5±j135.5 21.6 G2 (Torsional) 6,7 -0.06±j116.6 18.6 G2 (Torsional) 8,9 -0.09±j87.7 14.0 G2 (Torsional) 10,11 -0.08±j48.5 7.7 G2 (Torsional)
12 -42.9 0.0 G1
13 -42.1 0.0 G2,G4
14 -40.2 0.0 G2,G3,G4 15,16 -25.6±j10 1.6 G3,G4 17,18 -0.27±j10.8 1.7 G1-G4 (Inter-area) 19,20 -0.25±j9.9 1.6 G1-G4 (Inter-area) 21,22 -0.2±j10.1 1.6 G2-G4 (Inter-area)
23 -13.6 0.0 G3,G4
24,25 -12.5±j0.2 0.03 G1,G2,G4
26 0 0.0 G3 (Reference)
27 -0.18 0.0 G1,G4
28 -2.2 0.0 SVC
29 -3.1 0.0 G1
30 -4.9 0.0 G2,G3,G4
31 -3.91 0.0 G2,G4
32 -4.2 0.0 G3
0.4 0 .5 0 .6 0 .7 0 .8 0.9 -0.8
-0.6 -0.4 -0.2 0 0 .2 0 .4 0 .6 0 .8 1
N o n l i n e a r L i n e a r Mo d a l Se ri e s
0 5 10 15 20 25 30 35 40 0
0.2 0.4 0.6 0.8 1
N o n l i n e a r L i n e a r Mo d a l Se ri e s
0.4 0.5 0.6 0.7 0.8 0.9 - 0.8
- 0.6 - 0.4 - 0.2 0 0.2 0.4 0.6
N o n l i n e a r L i n e a r Mo d a l Se ri e s
0 5 10 15 20 25 30 35 40 0
0.2 0.4 0.6 0.8 1
N o n l i n e a r L i n e a r Mo d a l Se ri e s
Fig. 4 Torsional torques imposed to the shaft of generator G2 and its FFT.
0.4 0.5 0 .6 0.7 0.8 0.9 -4
-3 -2 -1 0 1 2 3 4
N o n l i n e a r L i n e a r Mo d a l Se ri e s
0 5 10 15 20 25 30 35 40
0 0.2 0.4 0.6 0.8 1
N o n l i n e a r L i n e a r Mo d a l Se ri e s
Fig. 5 Speed of generator G2 and its FFT.
Furthermore, Fig. 5 shows that the MS method well identifies the frequency content of generator speed. For instance, however the approximate linear analysis does not illustrate the presence of frequency 7.7Hz in the speed signal of generator G2, the results obtained from MS method confirm the existence of this frequency. As the speed of turbine-generator is commonly used as input signals in several controllers, the frequency content of this signal is quite important in designing such controllers. Thus if the existing frequencies and their impacts are not determined accurately, the good performance of controllers will not be expected.
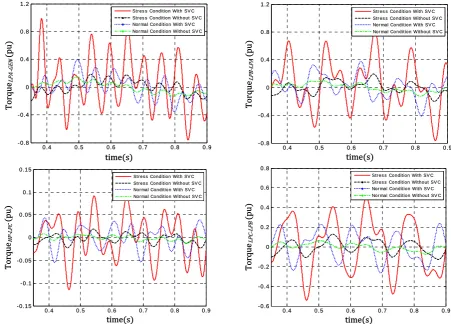
By adverse nonlinear interactions between torsional modes and SVC controllers, a serious warning is provided regarding the excessive imposed torques on the shaft segments. To investigate the physical effect of increasing the nonlinear interaction of torsional modes the torques imposed to the shaft is simulated in stressed and normal conditions for two cases with and without SVC and the results are shown in Fig. 6.
The simulation results show that the presence of SVC and the level of nonlinear interaction are two important factors that led to significant increase of torsional oscillations imposed to the shaft. The simulation results verify that when the nonlinear interaction of torsional modes increases the amounts of torsional oscillations imposed on the shaft will significantly increase.
0.4 0.5 0.6 0.7 0.8 0.9 - 0.8
- 0.4 0 0.4 0.8 1.2
Str es s Condition With SV C Str es s Condition Without SV C Nor mal Condition With SV C Nor mal Condition Without SV C
0.4 0.5 0.6 0.7 0.8 0.9
- 0.8 - 0.4 0 0.4 0.8 1.2
Str es s Condition With SV C Str es s Condition Without SV C Nor mal Condition With SV C Nor mal Condition Without SV C
0.4 0.5 0.6 0.7 0.8 0.9 - 0.15
- 0.1 - 0.05 0 0.05 0.1 0.15
Str es s Condition With SV C Str es s Condition Without SV C Nor mal Condition With SV C Nor mal Condition Without SV C
0 .4 0 .5 0.6 0 .7 0 .8 0.9 -0.6
-0.4 -0.2 0 0 .2 0 .4 0 .6 0 .8
Str e s s Con dition With SV C Str e s s Con dition Without SV C Nor mal Condition With SV C Nor mal Condition Without SV C
Fig. 6 Torsional torques imposed to the turbine-generator G2 for different conditions.
As seen from Table 2, when SVC is not in operation the level of nonlinear interaction of torsional modes is not noticeably different in stress and normal conditions. The simulations also verify that in these conditions the amplitude of torsional oscillations is the same. On the other hand, the analytical results in Table 2 show that when SVC is in operation the levels of nonlinear interaction of torsional modes are significantly increased in stress conditions. Fig. 6 indicates that in the presence of SVC, when power system is under stress condition, the amplitude of torsional oscillations is severely increased in compare with normal condition.
To assess the effects of SVC parameters on the nonlinear interaction with torsional modes, for different values of SVC parameters the nonlinear interaction of torsional modes is investigated. The results indicate that the voltage regulator gain (KSVC) and the thyristor firing
delay (Td) are two important parameters of SVC that
influence the nonlinear interaction between torsional modes and SVC controllers. The obtained results for these two parameters are prepared as bellow.
4.2.1 Voltage regulator gain (KSVC)
At different values of voltage regulator gains the nonlinear interaction between torsional modes (mode 4, 6, 8, 10) and SVC mode (mode 2, 3) is calculated using
the nonlinear interaction coefficient MCklj , and the results are shown in Fig. 7.
As seen from Fig. 7, by increasing the voltage regulator gain the nonlinear interaction with torsional modes is increased. This increase can provide an
70 75 80 85 90
0 0.1 0.2 0.3 0.4 0.5 0.6 0.7
6 2,3 MC
8 2,3 MC
4 2,3 MC
10 2,3 MC
,
j kl
MC
Fig. 7 The level of nonlinear interaction between torsional modes and SVC controllers for different values of SVC voltage regulator gains.
important alert signal to system operators implying the growth of torsional oscillations. The torsional torques imposed on the shaft of turbine-generator G2 are shown in Fig. 8.
The results show that by increasing the voltage regulator gain the amplitudes of some torsional oscillations are increased. For example, when KSVC is equal to 85pu, the peak torques experienced by shaft section LPA-GEN is approximately twice the case of KSVC is equal to 75pu. In this situation, a significant
reduction in the lifetime of the shaft occurs.
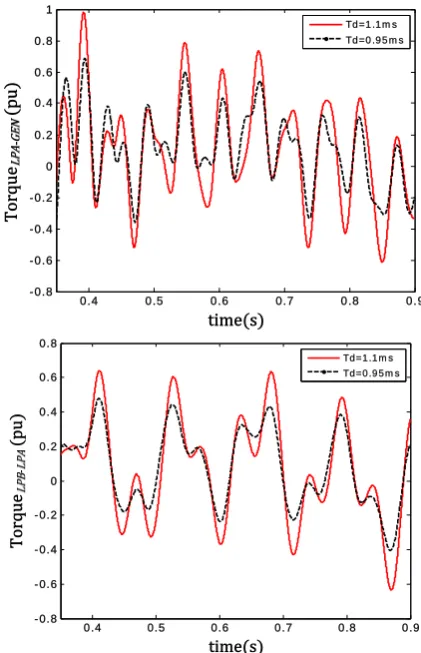
4.2.2 Thyristor firing delay (Td)
In the thyristor susceptance control block shown in Fig. 2, the parameter Td denotes the effect of thyristor
firing delay. In this section, the effect of this parameter on the nonlinear interaction of torsional modes is assessed. The amount of coefficient j
kl
MC is calculated
for different values of Td and the results are shown in
Fig. 9.
As seen from Fig. 9, by increasing Td the nonlinear
interaction with torsional modes is increased, which may damage the shaft. The torsional oscillations
0.4 0.5 0.6 0.7 0.8 0.9
- 0.8 - 0.4 0 0.4 0.8 1.2
K s vc=7 5 p u K s vc=8 5 p u
0.4 0.5 0.6 0.7 0.8 0.9
- 0 .8 - 0 .4 0 0.4 0.8
Ks vc=7 5 p u Ks vc=8 5 p u
Fig. 8 Torsional torques imposed on the shaft of G2 for different SVC voltage regulator gains.
0.9 0 .95 1 1.05 1 .1 1.1 5 0
0.3 0.6 0.9
,
j kl
MC
6 2,3 MC
8 2,3 MC
4 2,3 MC
10 2,3 MC
Fig. 9 The level of nonlinear interaction between torsional modes and SVC controllers for different values of SVC thyristor firing delay.
0.4 0.5 0.6 0.7 0 .8 0.9
-0.8 -0.6 -0.4 -0.2 0 0.2 0.4 0.6 0.8 1
Td =1 .1 m s Td =0 .9 5 m s
0.4 0.5 0.6 0.7 0.8 0.9
- 0.8 - 0.6 - 0.4 - 0.2 0 0.2 0.4 0.6 0.8
Td =1 .1 m s Td =0 .9 5 m s
Fig.10 Torsional torques imposed on the shaft of G2 for different SVC thyristor firing delay.
imposed on the shaft of G2 for different values of parameters Td are shown in Fig. 10. It is seen that for
large values of delay, the amplitudes of torsional oscillations imposed to the shaft are increased.
According to the important obtained results and the quite important matter of shaft vulnerability, the nonlinear interaction of torsional modes with other
system components should be studied carefully. To protect the shaft segments from any undesirable nonlinear interactions effects, an appropriate technique should be used to reduce them as far as possible. For this, one procedure is to place some constrains on the design parameters and tuning the power system controllers, which significantly contribute in the nonlinear interactions of torsional modes. This matter will be further elaborated in the future research works.
5 Conclusion
The results of this paper show that the stress conditions and the presence of SVC can lead to an adverse nonlinear torsional interaction (SSTI) between the steam power plant turbine generator set and the SVC controllers. The results show that the SVC parameters have important effect on the level of nonlinear interaction. For instance, for high values of voltage regulator gains, and large firing delays of thyristors, the nonlinear interaction between torsional modes and SVC controllers is extremely increased. It is observed that in case of adverse interaction the dynamic performance of power system is greatly affected in terms of increase in the amplitudes of torsional oscillations. In this situation, the linear modal analysis encounters the erroneous results in predicting the excitation of the torsional oscillations. However, the nonlinear modal analysis based on the Modal Series method can well show the adverse SSTI with SVC controllers. The comparison between the nonlinear simulation, approximate linear and MS method verify the obtained analytical results of nonlinear interaction. It can be concluded that for safe operation of power plants in the presence of SVC regarding the SSTI, such study to be performed using the nonlinear modal analysis like MS method.
Appendix
Load flow solution for the test system (Sbase = 100 MVA)
Bus Voltage (pu) Generation (pu) Load (pu) SVC (pu) Active Reactive Active Reactive
1 1.03 1.887 0.697 - - -
2 1.02 1.6 0.156 - - -
3 1.02 1.6 0.322 - - -
4 0.997 - - -
5 1 - - 2.3 0.92 1.21
6 0.914 - - 2.2 0.88 -
7 1.015 - - -
8 0.995 - - 2 0.80 -
9 1.006 - - -
10 1.009 - - -
11 1.02 1.6 0.251 - - -
Synchronous generator data (Sbase=100 MVA):
1 3 1 26 0 18 0 18
6 0 6 0 0
xd . , xq . , xd . , xq . ,
s , . s , R .
do qo a
τ τ
′ ′
= = = =
′ = ′ = =
Exciter data: Kexc=180, Texc=0.02
SVC control system data:
80 0 05 1 0 65 2 0 2
0 004 0 001 0 0045
350
Ksvc ,Tsvc . s ,T . s ,T . s ,
Tb . s ,Td . s ,Tm . s
Qsvc MV Ar
= = = =
= = =
= ±
References
[1] Rostamkolai N., Piwko R. J., Larsen E. V., Fisher D. A., Mobarak M. A. and Poitras A. E., “Subsynchronous Interactions with Static VAR Compensators-Concepts and Practical Implications”, IEEE Trans. on Power System, Vol. 5, No. 4, pp. 1324-1332, Nov. 1990.
[2] Hauth R. L., Humann T. E., and Newell R. J., “Application of a Static Var System to Regulate System Voltage in Western Nebraska”, IEEE Trans. on Power Apparatus and Systems, Vol. PAS-97, pp. 1955-1964, 1978.
[3] Gitizadeh M. and Kalantar M., “FACTS Devices Allocation to Congestion Alleviation Incorporating Voltage Dependence of Loads”, Iranian Journal of Electrical and Electronic Engineering, Vol. 4, No. 4, pp. 176-190, 2008. [4] Dickmander D. L., Thorvaldsson, Stromberg G.
A., Osborn D. L., Poitras A. E. and Fisher D. A., “Control System Design and Performance Verification for the Chester, Maine Static VAR Compensator”, IEEE Trans. on Power Delivery., Vol. 7, No. 3, pp. 1492-1503, Jul. 1992.
[5] Pourbeik P., Bostrom A. and Ray B., “Modeling and Application Studies for a Modern Static VAR System Installation”, IEEE Trans. on Power Delivery, Vol. 21, No. 1, pp. 368-377, Jan. 2006. [6] Parniani M. and Iravani M. R., “Voltage Control
Stability and Dynamic Interaction Phenomena of Static VAr Compensators”, IEEE Trans. on Power System, Vol. 10, No. 3, pp. 1592-1597, Aug. 1995.
[7] Zeinali Davarani R., Ghazi R. and Pariz N., “Linear Modal Analysis of SVC Torsional Interaction: Incorporation the SVC modeling and Control Parameters”, 25’Th International Power System Conference, Tehran, Nov. 2010.
[8] Pariz N., Modir Shanechi H. and Vaahedi E., “Explaining and Validating Stressed Power Systems Behavior Using Modal Series”, IEEE Trans. on Power System, Vol. 18, No. 2, pp. 778-785, May. 2003.
[9] Lin C. M., Vittal V., Kliemann W. and Fouad A. A., “Investigation of Modal Interaction and Its Effects on Control Performance in Stressed Power Systems Using Normal Forms of Vector Fields”, IEEE Trans. on Power System, Vol. 11, No. 2, pp. 781-787, May. 1996.
[10] Starrett S. K. and Fouad A. A., “Nonlinear measures of modal controllability and observability”, Electric Power System Research, Vol. 52, No. 1, pp. 65-75, 1999.
[11] Barocio E. and Messina A. R., “Normal Form Analysis of Stressed Power Systems: Incorporation of SVC Models”, Electrical Power and Energy System, Vol. 25, No. 1, pp. 79-90, Jan. 2003.
[12] Zou Z. Y., Jiang Q. Y., Cao Y. J. and Wang H. F., “Normal Form Analysis of Interactions among Multiple SVC Controllers in Power Systems”, IEEE Proc. Generation Transmission and Distribution, Vol. 152, No. 4, pp. 469-474, Jul. 2005.
[13] Modir Shanechi H., Pariz N. and Vaahedi E., “General non-linear modal representation of large scale power systems”, IEEE Trans. on Power System, Vol. 18, No. 2, pp. 1103-1109, Aug. 2003.
[14] Amiri N., Modir Shanechi H. and Pariz N., “LMI-based approach and estimation of Modal series representation in power systems”, International Conference on Automation and Systems Control, pp. 2628-2632 Oct. 2007.
[15] Naghshbandy A. H., Modir Shanechi H., Kazemi A. and Pourfar I., “Analyzing dynamic performance of stressed power systems in vicinity of instability by modal series method”, European Transactions on Electrical Power, Vol. 8, pp. 1040-1052, 2009.
[16] Chen W., Bi T., Yang Q. and Deng J., “Analysis of Nonlinear Torsional Dynamics Using Second-Order Solutions”, IEEE Trans. onPower System, Vol. 25, No. 1, pp. 423-432, 2010.
[17] Rodriguez O. and Medina A., “Stressed power systems analysis by using higher order modal series method: A basic study”, IEEE PES Transmission and Distribution Conf., pp. 1-7, 2010.
[18] Zeinali Davarani R., Ghazi R. and Pariz N., “Nonlinear modal analysis of interaction between torsional modes and SVC controllers”, Electric Power System Research. Vol. 91, pp. 61-70, Apr. 2012.
[19] Wu F. X., Wu H., Han Z. X. and Gan D. Q., “Validation of Power System Non-linear Modal Analysis Methods”, Electric Power System Research., Vol. 77, No. 10, pp. 1418-1424, Aug. 2007.
[20] Sauer P. and Pai M., Power Systems Dynamics and Stability, New Jersey: Prentice Hall, 1998. [21] Miller T. J. E., Reactive Power Control in
Electric Systems, Toronto: John Wiley and Sons, 1982.
[22] IEEE Working Group, “Static VAR Compensator Models for Power Flow and Dynamic Performance Simulation”, IEEE Trans. on Power System, Vol. PWRS-9, pp. 229-240, Feb.1994. [23] Sanchez-Gasca J. J., Vittal V., Gibbard M. J.,
Messina A. R., Vowles D. J., Liu S. and Annakkage U. D., “Inclusion of higher order terms for small-signal (modal) analysis: committee report-task force on assessing the need to include higher order terms for small-signal (modal) analysis”, IEEE Trans. on Power System., Vol. 20, No. 4, pp. 1886-1904, Nov. 2005.
Roholamin Zeinali received the B.Sc. degree from Shahid Bahonar University of Kerman, Kerman, Iran, in 2004. He obtained the M.Sc. and PhD degrees from Ferdowsi University of Mashhad, Mashhad, Iran, respectively in 2007 and 2012, all in electrical engineering. He is currently assistant professor of electrical engineering in Graduate University of Advanced Technology, Kerman, Iran. His research interests include power system dynamics, renewable energies, and FACTS devices.
Reza Ghazi received his B.Sc., degree (with honors) from Tehran University of Science and Technology, Tehran, Iran in 1976. In 1986, he received his M.Sc degree from Manchester University, Institute of Science and Technology (UMIST) and the Ph.D. degree in 1989 from University of Salford UK, all in electrical engineering. He is currently professor of electrical engineering in Ferdowsi University of Mashhad, Mashhad, Iran. His main research interests are reactive power control, FACTS devices, power systems control, and analysis. He has published over 90 papers in these fields including three books.
Nasser Pariz obtained his B.Sc. and M.Sc. degrees with honor from the Ferdowsi University of Mashhad, Mashhad, Iran, in 1988, and 1991 respectively both in electrical engineering. He obtained his PhD in 2001, from the department of electrical engineering, Ferdowsi University of Mashhad, Mashhad, Iran. He is currently associate professor of electrical engineering in Ferdowsi University of Mashhad, Mashhad, Iran. His research interests are Power and Control Systems.