VOLUME NO. 3 (2013), ISSUE NO. 04 (APRIL) ISSN2231-5756
A Monthly Double-Blind Peer Reviewed (Refereed/Juried) Open Access International e-Journal - Included in the International Serial Directories
Indexed & Listed at:
VOLUME NO. 3 (2013), ISSUE NO. 04 (APRIL) ISSN2231-5756
INTERNATIONAL JOURNAL OF RESEARCH IN COMMERCE, IT & MANAGEMENT
CONTENTS
CONTENTS
CONTENTS
CONTENTS
Sr.No.
TITLE & NAME OF THE AUTHOR (S)
Page No. 1. ISLAMIC FINANCE AWARENESS IN PUBLIC AND FINANCIAL SECTOR
GHULAM MUSTAFA SHAMI, DR. MUHAMMAD RAMZAN & AFAQ RASOOL
1 2. GREEN MARKETING: THE INDIAN CORPORATE SCENARIO
RAVINDER PAL SINGH
5 3. EXCHANGE RATE MANAGEMENT: A CRITICAL LOOK INTO SEVERAL ALTERNATIVES
PURNASHREE DAS & SUJIT SIKIDAR
9 4. AN EMPIRICAL STUDY OF SERVQUAL, CUSTOMER SATISFACTION AND LOYALTY IN INDIAN BANKING SECTOR
RAVINDRA KUMAR KUSHWAHA, DR. MADAN MOHAN & DEBASHISH MANDAL
13 5. CHINA’S CURRENCY POLICY: WINNERS AND LOSERS OF AN INDIRECT EXPORT SUBSIDY
GHULAM MUSTAFA SHAMI, DR. MUHAMMAD RAMZAN & AFAQ RASOOL
19 6. SALES STYLES OF EXECUTIVES SELLING TWO AND FOUR WHEELERS
DR. NAVPREET SINGH SIDHU
23 7. FINANCIAL AND TAXATION ISSUES OF MICRO FINANCE BILL 2012: A MOVE TOWARDS RESPONSIBLE MICROFINANCE IN INDIA
DR DHARUV PAL SINGH
29 8. STUDENTS’ CRITERIA IN SELECTING A BUSINESS SCHOOL
DR. JEEMON JOSEPH
33 9. CONSUMER BEHAVIOR IN ELECTRONIC BANKING: AN EMPIRICAL STUDY
DHARMESH MOTWANI & DR. DEVENDRA SHRIMALI
38 10. A NEW NOTION PROXIMITY FOR DATA PUBLISHING WITH PRIVACY PRESERVATION
S. BOOPATHY & P. SUMATHI
41 11. A STUDY ON ATTITUDE TOWARDS KNOWLEDGE SHARING AMONG KNOWLEDGE WORKERS IN EDUCATIONAL INSTITUTIONS IN MYSORE CITY
NITHYA GANGADHAR & SINDU KOPPA
47 12. MARKOV CHAINS USED TO DETERMINE THE MODEL OF STOCK VALUE AND COMPARED WITH P/E MODEL
ROYA DARABI & ZEINAB JAVADIYAN KOTENAIE
56 13. APPLICATION OF PERT TECHNIQUE IN HEALTH PROGRAMME MONITORING AND CONTROL
DR. SUSMIT JAIN
63 14. ESTIMATION OF TECHNICAL EFFICIENCIES OF INDIAN MICROFINANCE INSTITUTIONS USING STOCHASTIC FRONTIER ANALYSIS
B.CHANDRASEKHAR
69 15. EFFECTIVE RETENTION STRATEGIES IN WORKING ENVIRONMENT
C. KAVITHA
76 16. A COMPARATIVE STUDY OF QUALITY OF WORK LIFE OF WOMEN EMPLOYEES WITH REFERENCE TO PRIVATE AND PUBLIC BANKS IN
KANCHIPURAM DISTRICT
A. VANITHA
78
17. MANAGEMENT OF DISTANCE EDUCATION SYSTEM THROUGH ORGANIZATIONAL NETWORK
MEENAKSHI CHAHAL
86 18. A STUDY ON CONSTRUCTION OF OPTIMAL PORTFOLIO USING SHARPE’S SINGLE INDEX MODEL
ARUN KUMAR .S.S & MANJUNATHA.K
88 19. A STUDY ON EMPLOYEE ENGAGEMENT OF SELECT PLANT MANUFACTURING COMPANIES OF RAJASTHAN
VEDIKA SHARMA & SHUBHASHREE SHARMA
99 20. RELIABLE AND DISPERSED DATA SECURITY MECHANISM FOR CLOUD ENVIRONMENT
C. PRIYANGA & A. RAMACHANDRAN
104 21. CONSTRUCTION OF OPTIMUM PORTFOLIO WITH SPECIAL REFERENCE TO BSE 30 COMPANIES IN INDIA
DR. KUSHALAPPA. S & AKHILA
108 22. INVESTIGATING QUALITY OF EDUCATION IN BUSINESS AND ECONOMICS PROGRAMS OF ADDIS ABABA UNIVERSITY (AAU) AND BAHIRDAR
UNIVERSITY (BDU)
BIRUK SOLOMON HAILE
112
23. FACTORS AFFECTING APPLICABILITY OF SECURITY CONTROLS IN COMPUTERIZED ACCOUNTING SYSTEMS
AMANKWA, ERIC
120 24. THE EFFECT OF POVERTY ON HOUSEHOLDS’ VULNERABILITY TO HIV/AIDS INFECTION: THE CASE OF BAHIR DAR CITY IN NORTH-WESTERN
ETHIOPIA
GETACHEW YIRGA & SURAFEL MELAK
128
25. STRATEGIC RESPONSES TO CHANGES IN THE EXTERNAL ENVIRONMENT: A CASE OF EAST AFRICAN BREWERIES LIMITED
PATRICIA GACHAMBI MWANGI, MARTIN MUTWIRI MURIUKI & NEBAT GALO MUGENDA
134 26. DEMOGRAPHIC VARIABLES AND THE LEVEL OF OCCUPATIONAL STRESS AMONG THE TEACHERS OF GOVERNMENT HIGHER SECONDARY SCHOOLS
IN MADURAI DISTRICT
DR. S. S. JEYARAJ
139
27. HUMAN RESOURCE INFORMATION SYSTEM
DR. NEHA TOMAR SINGH
149 28. THE EFFECTS OF CORPORATE GOVERNANCE ON COMPANY PERFORMANCE: EVIDENCE FROM SRI LANKAN FINANCIAL SERVICES INDUSTRY
RAVIVATHANI THURAISINGAM
154 29. A STUDY ON FINANCIAL HEALTH OF TEXTILE INDUSTRY IN INDIA: Z – SCORE APPROACH
SANJAY S. JOSHI
159 30. REGULATORY FRAME WORK OF GOOD CORPORATE GOVERNANCE WITH REFERENCE TO INDIAN CORPORATE GOVERNANCE MECHANISMS
G. VARA KUMAR & SHAIK MAHABOOB SYED
165
VOLUME NO. 3 (2013), ISSUE NO. 04 (APRIL) ISSN2231-5756
CHIEF PATRON
CHIEF PATRON
CHIEF PATRON
CHIEF PATRON
PROF. K. K. AGGARWAL
Chancellor, Lingaya’s University, Delhi
Founder Vice-Chancellor, Guru Gobind Singh Indraprastha University, Delhi
Ex. Pro Vice-Chancellor, Guru Jambheshwar University, Hisar
FOUNDER
FOUNDER
FOUNDER
FOUNDER PATRON
PATRON
PATRON
PATRON
LATE SH. RAM BHAJAN AGGARWAL
Former State Minister for Home & Tourism, Government of Haryana
Former Vice-President, Dadri Education Society, Charkhi Dadri
Former President, Chinar Syntex Ltd. (Textile Mills), Bhiwani
CO
CO
CO
CO----ORDINATOR
ORDINATOR
ORDINATOR
ORDINATOR
AMITA
Faculty, Government M. S., Mohali
ADVISORS
ADVISORS
ADVISORS
ADVISORS
DR. PRIYA RANJAN TRIVEDI
Chancellor, The Global Open University, Nagaland
PROF. M. S. SENAM RAJU
Director A. C. D., School of Management Studies, I.G.N.O.U., New Delhi
PROF. M. N. SHARMA
Chairman, M.B.A., Haryana College of Technology & Management, Kaithal
PROF. S. L. MAHANDRU
Principal (Retd.), Maharaja Agrasen College, Jagadhri
EDITOR
EDITOR
EDITOR
EDITOR
PROF. R. K. SHARMA
Professor, Bharti Vidyapeeth University Institute of Management & Research, New Delhi
CO
CO
CO
CO----EDITOR
EDITOR
EDITOR
EDITOR
DR. BHAVET
Faculty, Shree Ram Institute of Business & Management, Urjani
EDITORIAL ADVISORY BOARD
EDITORIAL ADVISORY BOARD
EDITORIAL ADVISORY BOARD
EDITORIAL ADVISORY BOARD
DR. RAJESH MODI
Faculty, Yanbu Industrial College, Kingdom of Saudi Arabia
PROF. SANJIV MITTAL
University School of Management Studies, Guru Gobind Singh I. P. University, Delhi
PROF. ANIL K. SAINI
Chairperson (CRC), Guru Gobind Singh I. P. University, Delhi
DR. SAMBHAVNA
VOLUME NO. 3 (2013), ISSUE NO. 04 (APRIL) ISSN2231-5756
INTERNATIONAL JOURNAL OF RESEARCH IN COMMERCE, IT & MANAGEMENT
DR. MOHENDER KUMAR GUPTA
Associate Professor, P. J. L. N. Government College, Faridabad
DR. SHIVAKUMAR DEENE
Asst. Professor, Dept. of Commerce, School of Business Studies, Central University of Karnataka, Gulbarga
ASSOCIATE EDITORS
ASSOCIATE EDITORS
ASSOCIATE EDITORS
ASSOCIATE EDITORS
PROF. NAWAB ALI KHAN
Department of Commerce, Aligarh Muslim University, Aligarh, U.P.
PROF. ABHAY BANSAL
Head, Department of Information Technology, Amity School of Engineering & Technology, Amity
University, Noida
PROF. A. SURYANARAYANA
Department of Business Management, Osmania University, Hyderabad
DR. SAMBHAV GARG
Faculty, Shree Ram Institute of Business & Management, Urjani
PROF. V. SELVAM
SSL, VIT University, Vellore
DR. PARDEEP AHLAWAT
Associate Professor, Institute of Management Studies & Research, Maharshi Dayanand University, Rohtak
DR. S. TABASSUM SULTANA
Associate Professor, Department of Business Management, Matrusri Institute of P.G. Studies, Hyderabad
SURJEET SINGH
Asst. Professor, Department of Computer Science, G. M. N. (P.G.) College, Ambala Cantt.
TECHNICAL ADVISOR
TECHNICAL ADVISOR
TECHNICAL ADVISOR
TECHNICAL ADVISOR
AMITA
Faculty, Government M. S., Mohali
FINANCIAL ADVISORS
FINANCIAL ADVISORS
FINANCIAL ADVISORS
FINANCIAL ADVISORS
DICKIN GOYAL
Advocate & Tax Adviser, Panchkula
NEENA
Investment Consultant, Chambaghat, Solan, Himachal Pradesh
LEGAL ADVISORS
LEGAL ADVISORS
LEGAL ADVISORS
LEGAL ADVISORS
JITENDER S. CHAHAL
Advocate, Punjab & Haryana High Court, Chandigarh U.T.
CHANDER BHUSHAN SHARMA
Advocate & Consultant, District Courts, Yamunanagar at Jagadhri
SUPERINTENDENT
SUPERINTENDENT
SUPERINTENDENT
SUPERINTENDENT
SURENDER KUMAR POONIA
VOLUME NO. 3 (2013), ISSUE NO. 04 (APRIL) ISSN2231-5756
CALL FOR MANUSCRIPTS
CALL FOR MANUSCRIPTS
CALL FOR MANUSCRIPTS
CALL FOR MANUSCRIPTS
Weinvite unpublished novel, original, empirical and high quality research work pertaining to recent developments & practices in the area of Computer, Business, Finance, Marketing, Human Resource Management, General Management, Banking, Education, Insurance, Corporate Governance and emerging paradigms in allied subjects like Accounting Education; Accounting Information Systems; Accounting Theory & Practice; Auditing; Behavioral Accounting; Behavioral Economics; Corporate Finance; Cost Accounting; Econometrics; Economic Development; Economic History; Financial Institutions & Markets; Financial Services; Fiscal Policy; Government & Non Profit Accounting; Industrial Organization; International Economics & Trade; International Finance; Macro Economics; Micro Economics; Monetary Policy; Portfolio & Security Analysis; Public Policy Economics; Real Estate; Regional Economics; Tax Accounting; Advertising & Promotion Management; Business Education; Management Information Systems (MIS); Business Law, Public Responsibility & Ethics; Communication; Direct Marketing; E-Commerce; Global Business; Health Care Administration; Labor Relations & Human Resource Management; Marketing Research; Marketing Theory & Applications; Non-Profit Organizations; Office Administration/Management; Operations Research/Statistics; Organizational Behavior & Theory; Organizational Development; Production/Operations; Public Administration; Purchasing/Materials Management; Retailing; Sales/Selling; Services; Small Business Entrepreneurship; Strategic Management Policy; Technology/Innovation; Tourism, Hospitality & Leisure; Transportation/Physical Distribution; Algorithms; Artificial Intelligence; Compilers & Translation; Computer Aided Design (CAD); Computer Aided Manufacturing; Computer Graphics; Computer Organization & Architecture; Database Structures & Systems; Digital Logic; Discrete Structures; Internet; Management Information Systems; Modeling & Simulation; Multimedia; Neural Systems/Neural Networks; Numerical Analysis/Scientific Computing; Object Oriented Programming; Operating Systems; Programming Languages; Robotics; Symbolic & Formal Logic and Web Design. The above mentioned tracks are only indicative, and not exhaustive.
Anybody can submit the soft copy of his/her manuscript anytime in M.S. Word format after preparing the same as per our submission guidelines duly available on our website under the heading guidelines for submission, at the email address: infoijrcm@gmail.com.
GUIDELINES FOR SUBM
GUIDELINES FOR SUBM
GUIDELINES FOR SUBM
GUIDELINES FOR SUBMISSION OF MANUSCRIPT
ISSION OF MANUSCRIPT
ISSION OF MANUSCRIPT
ISSION OF MANUSCRIPT
1. COVERING LETTER FOR SUBMISSION:
DATED: _____________
THE EDITOR IJRCM
Subject: SUBMISSION OF MANUSCRIPT IN THE AREA OF.
(e.g. Finance/Marketing/HRM/General Management/Economics/Psychology/Law/Computer/IT/Engineering/Mathematics/other, please specify)
DEAR SIR/MADAM
Please find my submission of manuscript entitled ‘___________________________________________’ for possible publication in your journals.
I hereby affirm that the contents of this manuscript are original. Furthermore, it has neither been published elsewhere in any language fully or partly, nor is it under review for publication elsewhere.
I affirm that all the author (s) have seen and agreed to the submitted version of the manuscript and their inclusion of name (s) as co-author (s).
Also, if my/our manuscript is accepted, I/We agree to comply with the formalities as given on the website of the journal & you are free to publish our contribution in any of your journals.
NAME OF CORRESPONDING AUTHOR: Designation:
Affiliation with full address, contact numbers & Pin Code: Residential address with Pin Code:
Mobile Number (s): Landline Number (s): E-mail Address: Alternate E-mail Address:
NOTES:
a) The whole manuscript is required to be in ONE MS WORD FILE only (pdf. version is liable to be rejected without any consideration), which will start from
the covering letter, inside the manuscript.
b) The sender is required to mentionthe following in the SUBJECT COLUMN of the mail:
New Manuscript for Review in the area of (Finance/Marketing/HRM/General Management/Economics/Psychology/Law/Computer/IT/ Engineering/Mathematics/other, please specify)
c) There is no need to give any text in the body of mail, except the cases where the author wishes to give any specific message w.r.t. to the manuscript. d) The total size of the file containing the manuscript is required to be below 500 KB.
e) Abstract alone will not be considered for review, and the author is required to submit the complete manuscript in the first instance.
f) The journal gives acknowledgement w.r.t. the receipt of every email and in case of non-receipt of acknowledgment from the journal, w.r.t. the submission
of manuscript, within two days of submission, the corresponding author is required to demand for the same by sending separate mail to the journal.
2. MANUSCRIPT TITLE: The title of the paper should be in a 12 point Calibri Font. It should be bold typed, centered and fully capitalised.
3. AUTHOR NAME (S) & AFFILIATIONS: The author (s) full name, designation, affiliation (s), address, mobile/landline numbers, and email/alternate email address should be in italic & 11-point Calibri Font. It must be centered underneath the title.
VOLUME NO. 3 (2013), ISSUE NO. 04 (APRIL) ISSN2231-5756
INTERNATIONAL JOURNAL OF RESEARCH IN COMMERCE, IT & MANAGEMENT
5. KEYWORDS: Abstract must be followed by a list of keywords, subject to the maximum of five. These should be arranged in alphabetic order separated bycommas and full stops at the end.
6. MANUSCRIPT: Manuscript must be in BRITISH ENGLISH prepared on a standard A4 size PORTRAIT SETTING PAPER. It must be prepared on a single space and single column with 1” margin set for top, bottom, left and right. It should be typed in 8 point Calibri Font with page numbers at the bottom and centre of every page. It should be free from grammatical, spelling and punctuation errors and must be thoroughly edited.
7. HEADINGS: All the headings should be in a 10 point Calibri Font. These must be bold-faced, aligned left and fully capitalised. Leave a blank line before each heading.
8. SUB-HEADINGS: All the sub-headings should be in a 8 point Calibri Font. These must be bold-faced, aligned left and fully capitalised.
9. MAIN TEXT: The main text should follow the following sequence:
INTRODUCTION
REVIEW OF LITERATURE
NEED/IMPORTANCE OF THE STUDY
STATEMENT OF THE PROBLEM
OBJECTIVES
HYPOTHESES
RESEARCH METHODOLOGY
RESULTS & DISCUSSION
FINDINGS
RECOMMENDATIONS/SUGGESTIONS
CONCLUSIONS
SCOPE FOR FURTHER RESEARCH
ACKNOWLEDGMENTS
REFERENCES
APPENDIX/ANNEXURE
It should be in a 8 point Calibri Font, single spaced and justified. The manuscript should preferably not exceed 5000 WORDS.
10. FIGURES &TABLES: These should be simple, crystal clear, centered, separately numbered & self explained, and titles must be above the table/figure. Sources of data should be mentioned below the table/figure. It should be ensured that the tables/figures are referred to from the main text.
11. EQUATIONS:These should be consecutively numbered in parentheses, horizontally centered with equation number placed at the right.
12. REFERENCES: The list of all references should be alphabetically arranged. The author (s) should mention only the actually utilised references in the preparation of manuscript and they are supposed to follow Harvard Style of Referencing. The author (s) are supposed to follow the references as per the following:
•
All works cited in the text (including sources for tables and figures) should be listed alphabetically.•
Use (ed.) for one editor, and (ed.s) for multiple editors.•
When listing two or more works by one author, use --- (20xx), such as after Kohl (1997), use --- (2001), etc, in chronologically ascending order.•
Indicate (opening and closing) page numbers for articles in journals and for chapters in books.•
The title of books and journals should be in italics. Double quotation marks are used for titles of journal articles, book chapters, dissertations, reports, workingpapers, unpublished material, etc.
•
For titles in a language other than English, provide an English translation in parentheses.•
The location of endnotes within the text should be indicated by superscript numbers.PLEASE USE THE FOLLOWING FOR STYLE AND PUNCTUATION IN REFERENCES: BOOKS
•
Bowersox, Donald J., Closs, David J., (1996), "Logistical Management." Tata McGraw, Hill, New Delhi.•
Hunker, H.L. and A.J. Wright (1963), "Factors of Industrial Location in Ohio" Ohio State University, Nigeria.CONTRIBUTIONS TO BOOKS
•
Sharma T., Kwatra, G. (2008) Effectiveness of Social Advertising: A Study of Selected Campaigns, Corporate Social Responsibility, Edited by David Crowther &Nicholas Capaldi, Ashgate Research Companion to Corporate Social Responsibility, Chapter 15, pp 287-303.
JOURNAL AND OTHER ARTICLES
•
Schemenner, R.W., Huber, J.C. and Cook, R.L. (1987), "Geographic Differences and the Location of New Manufacturing Facilities," Journal of Urban Economics,Vol. 21, No. 1, pp. 83-104.
CONFERENCE PAPERS
•
Garg, Sambhav (2011): "Business Ethics" Paper presented at the Annual International Conference for the All India Management Association, New Delhi, India,19–22 June.
UNPUBLISHED DISSERTATIONS AND THESES
•
Kumar S. (2011): "Customer Value: A Comparative Study of Rural and Urban Customers," Thesis, Kurukshetra University, Kurukshetra.ONLINE RESOURCES
•
Always indicate the date that the source was accessed, as online resources are frequently updated or removed.WEBSITES
VOLUME NO. 3 (2013), ISSUE NO. 04 (APRIL) ISSN2231-5756
DEMOGRAPHIC VARIABLES AND THE LEVEL OF OCCUPATIONAL STRESS AMONG THE TEACHERS OF
GOVERNMENT HIGHER SECONDARY SCHOOLS IN MADURAI DISTRICT
DR. S.S.JEYARAJ
LECTURER
DEPARTMENT OF ACCOUNTING & COMMERCE
INTERNATIONAL UNIVERSAL JUNIOR COLLEGE
JAKARTA
ABSTRACT
The aim of the study is to determine the Occupational stress of higher secondary teachers living in different socio-cultural and economic situations in government schools in Madurai district. The scale used in the study has been developed by researchers to investigate the demographic differences of higher secondary teachers in relation to Age, Gender, Salary, Year of Experience, Marital Status, Subject handling and the influence of these demographic variables on their occupational stress. For conducting the study 305 teachers (120 Government and 185 Aided school Teachers) were collected out of 1015 teachers employing simple random sampling from three segments by using lottery method. For the present study researcher analysed 120 Government Higher Secondary Teachers and impact of demographic variables in their teaching profession. At the end of the study it was seen that 63.30% of the Government Higher Secondary Teachers opinioned the stress level is medium. Gender indicates that occupational stress exists for both male and female teachers at all levels of experience and subject handling in different majors like arts and science and social studies experience in occupation among government teachers. Policy makers are advised to analyse the teacher that demographic characteristics may have an effect on teacher occupational stress. So, there is a need to provide proper favorable environment and support to teachers to maintain individual occupational stress at their workplace.
KEYWORDS
Demographic Variables, Educational Qualification, Gender, Higher Secondary Teachers, Work Pressure.
INTRODUCTION
tress is a common problem that affects almost all of us at some point in our lives. Lifestyle in the 21st century is very stressful. Stress nowadays is not only overwhelming but it can pose a serious effect on one’s health. Almost everyone knows how it feels like to be stressed stomachaches, headaches, and sweaty palms are all symptoms of this condition. These are normal body reactions to threats, changes in routines, or challenges. Ongoing stress may increase the changes that certain ailments may develop. Chronic or prolonged stress caused by work, relationship problems, or financial concern may hamper emotional balance and increase the risk of chronic illness. In addition, chronic stress may weaken the immune system and make it more susceptible to many forms of infections. Stress however, is an inevitable part of life and may cause one to be physically and emotionally drained. Stress is the debilitating effects caused by constant pressure both at work and home, are a modern phenomenon.
DEFINITION
The word ‘stress’ was first introduced into the fields of biology and medicine in 1926 by an Australian endocrinologist, Hans Selye, working in montreal in Canada. He first introduced the concept of stress in 1939. It derived from Latin word to mean ‘Hardship’ ‘Strait’, ‘Adversity’ or ‘Affliction’. The word stress was popularly used in the seventeenth century. His concept of stress at that time was a physiological one and throughout his life the psychological component of the phenomenon of stress was not so much ignored by him, as placed in a secondary, and to some degree, less important place in the total picture of human stress. Selye in his most recent definition states that stress is the “non-specific response of the body to any demand”. While stress is readily acknowledged to be a common feature of modern life, defining stress, its causes, symptoms and effects is a very complex matter. It is often characterised as a primitive stone-age
reaction to modern organisational and social factors known as stressors.
OCCUPATIONAL STRESS
Occupational stress refers to an individual’s reaction to a disturbing factor in the environment. It is defined as an adaptive response to an external situation that results in physical, psychological, and/or behavioural deviations for organisational participants. Occupational stress can manifest itself in both positive and negative ways. Occupational stress is said to be positive when the situation offers an opportunity for one to gain something. Eustress is the term used to describe positive stress. Eustress is often viewed as a motivator since, in its absence, the individual lacks that ‘edge’ necessary for peak performance. It is negative when stress is associated with heart disease, alcoholism, drug abuse, marital breakdowns, absenteeism, child abuse, and a host of other social, physical, organisational and emotional problems.
“Occupational stress can be defined as the harmful physical and emotional response that occurs when the requirements of the occupation do not match the capabilities, resources, or needs of the worker. Occupational stress can lead to poor health and even injury”.1
According to the article titled ‘Guidance on Work Related Stress: Spice of life- or kiss of death” “stress is the reaction people have to excessive pressures or other types of demand placed on them”.2
There is a lack of generally accepted definition of what is meant by occupational stress. Hans Selye the father of stress management himself wrote that, stress suffers from the mixed blessing of being too well known and too little understood. However, the term has commonly been defined in one of the three ways: (a) as an environmental stimulus, (b) as an individual’s psychological or physiological response to such an environmental force, or (c) as the interaction between the two.
Selye (1956),3 “any external event or internal drive which threatens to upset the organic equilibrium” is stress. He has defined stress as the non-specific response
of the body to any demand made upon it.
Lazarus (1960)4 maintains that “stress occurs when there are demands on the person which tax or exceed his adjustments resources”. Pinneau (1975)5, stress refers to “any characteristic of the job environment which is a threat to the individual. According to Kyriacou (1987), defines “teacher
stress as the experience by a teacher of unpleasant emotions such as tension, frustration, anger and depression resulting from aspects of his work as a teacher.” Occupational stress is generally seen to have two major components. Stressors and stress responses are internal or external stimulus events which cause some
sort of response. Internal stressors include thoughts and feelings, external stressors include such things as noise, cold and interactions with other people. Stress
response is a complex reaction to a stressor. It usually has physiological cognitive and/or behavioural components. Occupational stress can result either from work and origin related or individual personality related factors. Occupational stress has been defined in terms, of
misfit between a person’s skills and abilities, and the demand of his/her job or misfit between person’s needs not being fulfilled by his/her job environment. Cooper and Marshall (1976)6 are of the view that organisational stress basically means environmental factors or stressors such as work load, role conflict, role ambiguity and poor working conditions associated with a particular job. Regardless of how one’s job may compare to another in terms of stress, it is helpful to recognise that every job has potential. Cooper and Marshall (1988)7 have identified sources of occupational stress at work. It may be mentioned here that
although common to all jobs, the sources vary in degree to which they are found to be casually linked to stress in each job.
VOLUME NO. 3 (2013), ISSUE NO. 04 (APRIL) ISSN2231-5756
INTERNATIONAL JOURNAL OF RESEARCH IN COMMERCE, IT & MANAGEMENT
REVIEW OF LITERATURE
Jha,S.S. (1988)8 in his study on “Jobs Stress and Employee Strain in India Executives” explains the pattern of stress and strain in three work groups namely production, personnel and data processing divisions in an organization. Results indicated that job future ambiguity had negative effect on job satisfaction in all the three groups. The patter of stress in the three groups was different among different levels of management. Among different levels of managers, the diddle level managers had more role ambiguity than others did.
Reddy, V.S. and Ramamurthi, P.V. (1991)9 in their study on “The Relation between Stress Experience on the Job-Age, Personality and General ability” analysed
the influence of age, personality and general ability of the individual in the perception of stress. It was found that only age influenced the perception of stress. There was only very limited contribution of personality and general ability of the individual to the intensity of stress experience of the individual. Rajeswari, T.R. (1992)10 in her study on “Employee Stress: A Study with Reference to Bank Employees” found significant negative relationship between age and
stress and also between experience and stress. This study also found negative correlation between number of members in the family and stress. The level of stress did not differ between different levels of workers namely officers, and clerks.
Anitha Devi (2006-7)11 in her study on occupational stress: A comparative Study of Worker in different Occupations” describes identifying the degree of life stress and role stress (LS & RS) experienced by professional women. It also studies the effect of life stress and role stress on various demographic variables like age, experience and income. For the purpose of study, 180 women professionals (six different occupations) were chose. It was found that science and technology professionals and doctors experienced significantly greater life stress and role stress.
Dhanalakhsmi (2008)12 in her study on “Actors Predicting Stress of Employees in a Public Transport Corporation” measures the level of stress of the transport corporation employees and also studies the factors that could predict stress. It is found that the employees experience moderate level of stress. Further, stress is predicted by working environment and safety and security.
Kyriacou, Kunc, Stephens & Hultgren, (2003)13Existing studies on the job satisfaction and occupational stress of teachers focus on teacher background characteristics (age, gender, years of service, etc.) as well as workplace conditions (organisational culture, pupil behaviour, work-load, etc.). Higher levels of
dissatisfaction with work and occupational stress have been associated with teacher performance; absenteeism and leaving the job. Leimann, Murdoc,, & Waller, 2008)14. Several studies suggest that salary concerns are one of many issues that contribute to work related stress in teaching. The
National Commission on Teaching and America’s Future suggested that a key reason that teachers leave the field of education is low pay. Barmby (2006)15 conducted a study examining the issue of recruitment and retention of English, math and science teachers. These subjects are considered high
priority and often face teacher shortages. Two Hundred forty six teachers, who taught these subjects in England and Wales were surveyed to examine the reasons for choosing to enter, not enter or leave the teaching profession. All of the teachers surveyed had two years or less of teaching experience. Salary
concerns, along with excessive workload and student behavior were the most common factors respondents cited for dissuading them from entering teaching. Sargent, T. and Hannum, E. (2005)16 in their study on “keeping Teachers Happy job Satisfaction among Primary School Teachers in Rural North-west China”
comparative study highlight an in-depth research on teacher job satisfaction in rural north-west China, in terms of community factors, school environment factors, and teacher characteristics. Their findings were mostly in alignment with previous studies, but contrary to their assumptions, however, teachers with
greater workloads, felt more satisfied. Further more economic development was negatively connected with teacher’s satisfaction. Reddy, V.S. and Ramamurthi, P.V. (1991)17 in their study on “The Relation between Stress Experience on the Job-Age, Personality and General ability” analysed
the influence of age, personality and general ability of the individual in the perception of stress. It was found that only age influenced the perception of stress.
There was only very limited contribution of personality and general ability of the individual to the intensity of stress experience of the individual. Singh, A.K. and Sehgal, V. (1995)18 in their study on “Men and Women in Transition: Patterns of Stress, Strain and Social Relations” Highlight the patterns of
stress and strain among men and women as well as single and dual career couples. They found that male and female managers did not differ significantly on various stress dimensions. Difference in gender was however found in strains. Women were characterized by anxiety, whereas men exhibited more symptoms of somatic problems comparing the single and dual couples. It was fund that male managers with spouses working experienced higher workload than managers whose spouses were not working. In strains also single career male managers had less irritability that dual career male managers din overall single career male managers had better psychological well-being than others did working women managers had better physical well-being that their working husband did but had poorer psychological well-being
STATEMENT OF THE PROBLEM
For an individual any environment has a certain degree of stress, though of varying duration. When stress is sustained for a long period of time, the problem becomes significant. The higher secondary teacher is to go on periodic self-decreased vacations in the form of absenteeism. School teachers are no exception to this. The individuals entering into teaching field are professionals. They enter into professions and then they professionalize themselves and so they find themselves at loggerheads. Further, in teaching jobs are structured in a way that a worker is simultaneously exposed to both overload and acute time pressure. Generally people under stress express their frustration through some common ways like excessive criticism of government and management and displaying inability to get along with others. A general knowledge of this behaviour in higher secondary school teachers increases the understanding of individuals as well as of groups became, if furnishes one with certain principles. These principles help in recognition of the symptoms of distress and indicate the kind of behaviour one may expect so that steps can be taken to deliberately shape the environment to elicit expected responses. But, in the education department such individual behaviour cannot be easily identified, as individual performance cannot be quantitatively measured as precisely as in teaching field. Symptoms of stress take a long time to erupt. Once it erupts, it not only affects the individual concerned but also the co-workers through strained interpersonal relations and ultimately affects the student’s education which forms the very core for the success of education department. Hence occupational stress situations and their perceived impact on higher secondary school teachers are taken up for the present study. The researcher has made an attempt to study the occupational stress among higher secondary school teachers of Madurai district.
OBJECTIVES
To analyse the demographic variables among the higher secondary school teachers of government schools. To measure the levels of occupational stress among the higher secondary teachers of government schools.
The present study attempts to determine the relationship between demographic variables and levels of Occupational stress among Government Higher Secondary School Teachers.
HYPOTHESIS
The following null hypotheses were formulated for the present study.
NULL HYPOTHESIS: There is no significant relationship between the demographic variables and level of occupational stress among the government higher secondary school teachers.
ALTERNATIVE HYPOTHESIS: There is a significant relationship between the variables and level of occupational stress among the government higher secondary school teachers.
HYPOTHESES RELATING TO HIGHER SECONDARY TEACHERS OCCUPATIONAL STRESS LEVEL
VOLUME NO. 3 (2013), ISSUE NO. 04 (APRIL) ISSN2231-5756
2. The average occupational stress score of different groups of government higher secondary school teachers (variables such as designation, age, salary, teaching experience, marital status, type of family, income of family, number of dependents, number of training programme, subjects handling and location of school) is the same.
RESEARCH METHODOLOGY
The present study is based on both primary and secondary data. Primary data have been collected by conducting a survey among 305 sample higher secondary teachers comprising headmasters and higher secondary school teachers of government and aided schools. Secondary data have been collected from books, journals, newspapers, periodicals, reports, internet and unpublished records of Madurai District of Tamil Nadu. Initial instrument was developed by generating 108 items after a thorough understanding of occupational stress among Aided and Government higher secondary school teachers of Madurai district in the state of Tamil Nadu. The first part of the questionnaire was related to personal details of higher secondary teachers, second part relates with measuring of demographic variables relating to occupational stress among the teachers with the help of Chi-square test, F- test (ANOVAs) and Z- test.
SAMPLING DESIGN
A sample of 305 teachers was taken to meets the sample adequacy, for conducting factor analysis number of sample teachers for the study were selected from the total population. For the purpose of the study (305 Teachers) 30% per cent of the samples were selected by using simple random sampling from three segments by using lottery method because of easy accessibility and affordability. This study is limited to a particular teachers those who are handling the classes in higher secondary teachers in Government schools and none of the teachers those who are handling classes in below higher secondary level and unaided higher secondary school teachers.
TABLE 1.1: SAMPLE-SIZE OF HIGHER SECONDARY TEACHERS AND HEAD MASTERS Category Head Masters Higher Secondary School Teachers Total
Government Schools 23(19.20%) 97(80.8%) 120
Aided Schools 17(9.2% ) 168(90.8 %) 185
Total 40(13.2%) 265(86.8 %) 305
Source: Primary Data.
Table 1.1 shows that out of 305 higher secondary school teachers, 265 (86.8 per cent) are teachers and the remaining 40 (13.2 per cent) are head masters. Among the total teachers, 120 are belonging to government schools and the remaining 185 are belonging to aided schools. Among the 120 government school teachers, 97 (80.8 per cent) are teachers and the remaining 23 (19.2 per cent) are head masters. Among the 185 aided school teachers, 168 (90.8 per cent) are teachers and 17 (9.2 per cent) are head masters.
RESULTS AND DISCUSSION
DEMOGRAPHIC VARIABLES AND THE LEVEL OF OCCUPATIONAL STRESS AMONG THE TEACHERS OF GOVERNMENT HIGHER SECONDARY SCHOOLS
The level of occupational stress of government teachers has been measured with the help of 108 statements by adopting Likert scaling method. The occupational stress level of higher secondary school teachers has been classified into three categories namely low, medium and high. The arithmetic mean (X) and the standard deviation (σ) were calculated for the 120 observations of score values among the teachers. The calculated arithmetic mean (X) was 382.24 and the standard deviation (σ) was 68.89. The score values greater than or equal to (X +σ) = (382.24 + 68.89) = 451.13 = 451 and the score value less than or equal to (X -σ) = (382.24 – 68.89) = 313.35 have been classified as high and low level of occupational stress respectively. The score values in between (X +σ) and (X -σ) = 313 and 451 have been classified as medium level of stress.
The identified demographic variables, which might influence the level of occupational stress among higher secondary school teachers, are as follows: designation, age, gender, monthly income, teaching experience, marital status, type of family, number of dependents, subjects handling, and number of training programmes and location of schools. Significance of the relationship of all the above variables with the opinion of higher secondary school teachers about their occupational stress level has been analysed by applying the statistical techniques such as Chi-square test, (ANOVAs) “F” test and “Z” test.
LEVEL OF OCCUPATIONAL STRESS
Table 1.2 reveals the classification of government school teachers based on the level of occupational stress.
TABLE 1.2: CLASSIFICATION OF GOVERNMENT HIGHER SECONDARY TEACHERS BY THEIR LEVEL OF OCCUPATIONAL STRESS Sl.No. Level of Stress No. of Teachers Percentage
1. Low 25 20.80
2. Medium 76 63.30
3. High 19 15.80
Total 120 100.00
Source: Primary data.
Table 1.2 explains that 76 (63.30 per cent) out of 120 government teachers, had a medium level of occupational stress, 25 teachers (20.80 per cent) had a low level of stress and the remaining 19 teachers (15.80 per cent) had a high level of occupational stress.
DEMOGRAPHIC VARIABLES AND LEVEL OF OCCUPATIONAL STRESS AMONG SCHOOL TEACHERS
Among the 120 government higher secondary school teachers, 23 were headmasters and the remaining 97 were teachers. The following Table gives the details about the opinion of headmasters and teachers about their level of occupational stress in government schools. The sample government higher secondary school teachers comprise only the teachers who are handling the subjects of Grade 11and Grade 12standards.
DESIGNATION AND LEVEL OF OCCUPATIONAL STRESS
Table 1.3 shows the level of occupational stress among head masters and teachers of higher secondary government schools.
TABLE 1.3: CLASSIFICATION OF GOVERNMENT HIGHER SECONDARY TEACHERS ON THE BASIS OF THEIR DESIGNATION AND LEVEL OF STRESS Sl.
No.
Designation Level of Stress Total Low Medium High
1. Headmaster 2
(1.7) 17 (14.2)
4 (3.3)
23 (19.2)
2. Teachers 23
(19.2) 59 (49.1)
15 (12.5)
97 (80.8)
Total 25
(20.8) 76 (63.3)
19 (15.8)
120 (100.0)
Source: Primary data. Note: Figures in brackets represents percentage to total.
VOLUME NO. 3 (2013), ISSUE NO. 04 (APRIL) ISSN2231-5756
INTERNATIONAL JOURNAL OF RESEARCH IN COMMERCE, IT & MANAGEMENT
To test the hypothesis that the designation is independent of the level of occupational stress, the chi-square test has been applied and the calculated value is 2.56, table value at 5 per cent level of significance 5.991 and degrees of freedom is 2.As the calculated chi-square value is less than the table value at 5 per cent level of significance with 2 degrees of freedom, the null hypothesis is accepted. Hence, it may be concluded that there is no significance in the matter of occupational stress based on designation.
AVERAGE STRESS SCORE ON THE BASIS OF THEIR DESIGNATION
The average stress score of the government teachers is given in the Table that follows.
TABLE 1.4: AVERAGE STRESS SCORE OF GOVERNMENT HIGHER SECONDARY TEACHERS ON THE BASIS OF THEIR DESIGNATION Sl.No. Group Average Score Sample Size
1. Headmaster 395.09 23
2. Teacher 379.20 97
Total 382.24 120
It could be inferred from Table 1.4 that the average stress score of the headmasters (395.09) is higher than the average stress score of the teachers (379.20). It is proposed to test the null hypothesis, that the average stress score of headmasters and teachers is the same “Z” test was applied.
TABLE 1.5: DESIGNATION AND OCCUPATIONAL STRESS SCORE OF GOVENRMENT HIGHER SECONDARY TEACHERS – ‘Z’ test Sl.No. Designation Average Score Difference Standard Error ‘Z’ Value
1. Headmaster 395.09 15.89 13.53 1.17
2. Teacher 379.20
Since the calculated value of “Z” (1.17) is less than the critical value of “Z” (2.58) at 1% level of significance, the null hypothesis is accepted. Thus, it is concluded that teachers feel better about stress level than the head masters.
AGE AND LEVEL OF OCCUPATIONAL STRESS
Age is a factor which determines every individual’s eligibility to be appointed to a post and to be retired. Age is a great variable, which is likely to influence the occupational stress level among the teachers.
TABLE 1.6: CLASSIFICATION OF GOVERNMENT HIGHER SECONDARY TEACHERS ON THE BASIS OF THEIR AGE AND LEVEL OF OCCUPATIONAL STRESS Sl.
No. Age (in years)
Level of Stress Total Low Medium High
1. Below 30 years 0 (0.0)
3 (2.5)
0 (0.0)
3 (2.5)
2. 30 – 40 7
(5.8) 15 (12.5)
5 (4.2)
27 (22.5)
3. 40 – 50 12
(10.0) 33 (27.5)
6 (5.0)
51 (42.5)
4. Above 50 6
(5.0) 25 (20.8)
8 (6.7)
39 (32.5)
Total 25
(20.8) 76 (63.3)
19 (15.8)
120 (100.0)
Source: Primary data. Note: Figures in brackets represent percentage to total.
Table 1.6 shows that out of 3 teachers, who fall in the age group of below 30 years, 3 (2.5 per cent) had a medium level of stress Of the 27 teachers, 7 (5.8 per cent) who fall under the age group between 30-40 years had a low level of stress, 15 (12.5 per cent) had a medium level of stress and the remaining 5 (4.2 per cent) had a high level of stress. Out of 51 teachers, 12 (10.0 per cent) who fall under the age group of between 40-50 years had a low level of stress, 33 (27.5 per cent) had a medium level and the remaining 6 (5.0 per cent) had a high level of stress. Of the 39 teachers, 6 (5.0 per cent) who fall under the age group of above 50 years had a low level of stress, 25 (20.8 per cent) had a medium level of stress and the remaining 8 (6.7 per cent) had a high level of stress.
To test the null hypothesis that the age is independent of the level of occupational stress, the chi-square test has been applied and the calculated value 4.28, table value at 5 per cent level of significance 12.592 and degrees of freedom is 6. As the calculated chi-square value is less than the table value at 5 per cent level of significance with 6 degrees of freedom, the null hypothesis is accepted. Therefore, it may be concluded that there is no significant relationship between age and level of occupational stress among the government higher secondary school teachers.
AVERAGE STRESS SCORE ON THE BASIS OF THEIR AGE
The average stress score of the three groups of government school teachers on the basis of their age is given in the Table that follows.
TABLE 1.7: AVERAGE OCCUPATIONAL STRESS SCORE OF GOVERNMENT HIGHER SECONDARY TEACHERS ON THE BASIS OF THEIR AGE Sl.No. Age Group (in years) Average Score Sample Size
1. Below 30 years 378.67 3
2. 30 – 40 370.07 27
3. 40 – 50 384.09 51
4. Above 50 years 388.51 39
Total 382.24 120
Table 1.7 shows that the average stress score of the government teachers belonging to age group between 30-40 years (370.07) is lower than the average stress score of those below 30 years (378.67), those between 40-50 years (384.09) and those above 50 years (388.51). It is proposed to test the null hypothesis that the average stress score of the four groups of government school teachers on the basis of their age is the same. “F” test was applied.
TABLE 1.8: AGE AND OCCUPATIONAL STRESS SCORE OF GOVERNMENT HIGHER SECONDARY TEACHERS: ‘F’ TEST Sources of Variation Sum of Squares Degrees of Freedom Mean Square ‘F’ Value
Between Samples 5745.22 3 1915.07 0.39
Within Samples 558928.77 116 4818.35
Total 564673.99 119
The calculated value of “F” (0.39) less than the table value of “F” (4.60) for 3 &116 degrees of freedom at 1 per cent level of significance. Therefore the null hypothesis is accepted. Hence, there is no significant difference in the average stress score of the four groups among the government teachers.
GENDER AND LEVEL OF OCCUPATIONAL STRESS
VOLUME NO. 3 (2013), ISSUE NO. 04 (APRIL) ISSN2231-5756
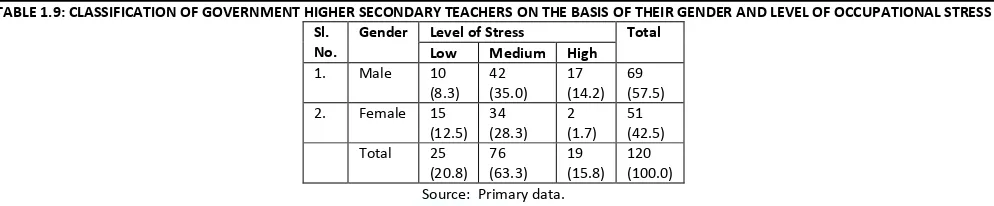
TABLE 1.9: CLASSIFICATION OF GOVERNMENT HIGHER SECONDARY TEACHERS ON THE BASIS OF THEIR GENDER AND LEVEL OF OCCUPATIONAL STRESS Sl.
No.
Gender Level of Stress Total Low Medium High
1. Male 10
(8.3) 42 (35.0) 17 (14.2) 69 (57.5)
2. Female 15
(12.5) 34 (28.3) 2 (1.7) 51 (42.5)
Total 25
(20.8) 76 (63.3) 19 (15.8) 120 (100.0)
Source: Primary data. Note: Figures in brackets represent percentage to total.
Table 1.9 shows that of the 69 male teachers, 10 (8.3 per cent) had a low level of stress, 42 (35.0 per cent) had a medium level of stress and the remaining 17 (14.2 per cent) had a high level of stress. Of the 51 female teachers, 15 (12.5 per cent) had a low level of stress, 34 (28.3 per cent) had a medium level of stress and the remaining 2 (1.7 per cent) had a high level of stress.
To test the null hypothesis that gender is independent of the level of occupational stress, the chi-square test has been applied and calculated value is 11.24, table value at 5 per cent level of significance 5.991and degrees of freedom 2. As the calculated chi-square value is more than the table value is more than the table value, the null hypothesis is rejected. Therefore, it may be concluded that there is an association between gender and the level of occupational stress among the government higher secondary school teachers.
AVERAGE STRESS SCORE ON THE BASIS OF THEIR GENDER
The average stress score of the teachers on the basis of their gender is given in the Table that follows.
TABLE 1.10: AVERAGE OCCUPATIONAL STRESS SCORE OF GOVERNMENT HIGHER SECONDARY TEACHERS ON THE BASIS OF THEIR GENDER Sl.No. Gender Average Score Sample Size
1. Male 401.43 69
2. Female 356.27 51
Total 382.24 120
Table 1.10 sheds light that the average stress score of female government teachers (356.27) is lower than the average stress score of male teachers (401.43). It is proposed to test the null hypothesis that the average stress score of the two groups of government school teachers on the basis of their gender is the same. “Z” test was applied.
TABLE 1.11: GENDER AND OCCUPATIONAL STRESS SCORE OF government HIGHER SECONDARY TEACHERS: ‘Z’ TEST Sl.No. Sex/Gender Average Score Difference Standard Error ‘Z’ Value
1. Male 401.43 45.16 11.74 3.85
2. Female 356.27
Since the calculated value of “Z” (3.85) exceeds the critical value of “Z” (2.58) at 1 per cent level of significance, the null hypothesis is rejected. Thus, it is concluded that female teachers experience less stress than the male teachers.
SALARY AND LEVEL OF OCCUPATIONAL STRESS
The following Table gives clear information regarding the salary of the government school teachers and the level of occupational stress in the school.
TABLE 1.12: CLASSIFICATION OF GOVERNMENT HIGHER SECONDARY TEACHERS ON THE BASIS OF THEIR SALARY AND LEVEL OF OCCUPATIONAL STRESS Sl.
No.
Salary (in Rs.) Level of Stress Total Low Medium High
1. Below 15000 2
(1.7) 3 (2.5) 3 (2.5) 8 (6.7) 2. 15000 – 20000 9
(7.5) 32 (26.7) 9 (7.5) 50 (41.7) 3. 20000 – 25000 10
(8.3) 19 (15.8) 2 (1.7) 31 (25.8)
4. Above 25000 4
(3.3) 22 (18.3) 5 (4.2) 31 (25.8)
Total 25
(20.8) 76 (63.3) 19 (15.8) 120 (100.0)
Source: Primary data. Note: Figures in brackets represent percentage to total.
It could be seen from Table 1.12 that of the total government teachers, 8 teachers who fall under the income group of below Rs.15000, 2 (1.7 per cent) had a low level of stress, 3 (2.5 per cent) had a medium level of stress and the remaining 3 (2.5 per cent) had a high level of stress.
Out of 50 teachers, who fall under the income group of Rs.15000-20000, 9 (7.5 per cent) had a low level of stress, 32 (26.7 per cent) had a medium level of stress and the remaining 9 (7.5 per cent) teachers had a high level of stress. Of the 31 teachers, who fall under the income group of Rs.20000-25000, 10 (8.3 per cent) had a low level of stress, 19 (15.8 per cent) had a medium level of stress and the remaining 2 (1.7 per cent) had a high level of stress. Of the 31 teachers, who fall under the income group of above Rs.25000, 4 (3.3 per cent) teachers had a low level of stress, 22 (18.3 per cent) had a medium level and the remaining 5 (4.2 per cent) had a high level of stress.
To test the null hypothesis that salary is independent of the level of occupational stress, the chi-square test has been applied and calculated value 8.53, table value at 5 per cent level of significance 12.592, degree of freedom 6.As the calculated chi-square value is less than the table value at 5 per cent level of significance with 6 degrees of freedom, the hypothesis is accepted. Therefore, it may be concluded that there is no association between salary and their level of occupational stress among government higher secondary school teachers.
AVERAGE STRESS SCORE ON THE BASIS OF THEIR SALARY
The average occupational stress score of the government school teachers is given in the Table that follows.
TABLE 1.13: AVERAGE STRESS SCORE OF government HIGHER SECONDARY TEACHERS ON THE BASIS OF THEIR SALARY Sl.No. Salary (in Rs.) Average Score Sample Size
1. Below 15000 398.13 8
2. 15000 – 20000 386.78 50
3. 20000 – 25000 364.48 31
4. Above 25000 388.58 31
VOLUME NO. 3 (2013), ISSUE NO. 04 (APRIL) ISSN2231-5756
INTERNATIONAL JOURNAL OF RESEARCH IN COMMERCE, IT & MANAGEMENT
It is seen from Table 1.13 that the average stress score of teachers who fall under the monthly salary between Rs.20, 000 to Rs.25, 000 (364.58) is lower than that of salary between Rs.15, 000 to Rs.20, 000 (386.78), salary above Rs.25, 000 (388.58) and that of the teachers who fall under the income groups of below Rs.15, 000 (398.13) in government higher secondary school. It is proposed to test the null hypothesis that the average stress score of the four groups remains the same. ‘F’ test was applied.
TABLE 1.14: SALARY AND OCCUPATIONAL STRESS SCORE OF GOVERNMENT HIGHER SECONDARY TEACHERS: F-TEST Sources of Variation Sum of Squares Degrees of Freedom Mean Square ‘F’ Value
Between Samples 14069.25 3 4689.75 0.99
Within Samples 550604.75 116 4746.59
Total 564673.99 119
“F” test proves that there is no significant difference among the four salary groups of government higher secondary school teachers with regard to average stress score.
YEARS OF EXPERIENCE AND LEVEL OF OCCUPATIONAL STRESS
Here, it is decided to analyse the extent of years of experience of the teachers in relation to their occupational stress level. The following Table gives clear information regarding the years of experience of teachers and their level of occupational stress.
TABLE 1.15: CLASSIFICATION OF GOVERNMENT HIGHER SECONDARY TEACHERS ON THE BASIS OF THEIR YEARS OF EXPERIENCE AND LEVEL OF OCCUPATIONAL STRESS
Sl. No.
Year of Experience (in years)
Level of Stress Total Low Medium High
1. Below 5 4
(3.3) 5 (4.2)
2 (1.7)
11 (9.2)
2. 5 – 10 10
(8.3) 26 (21.7)
4 (3.3)
40 (33.3)
3. 10 – 15 4
(3.3) 25 (20.8)
4 (3.3)
33 (27.5)
4. Above 15 7
(5.8) 20 (16.7)
9 (7.5)
36 (30.0)
Total 25
(20.8) 76 (63.3)
19 (15.8)
120 (100.0) Source: Primary data.
Note: Figures in brackets represent percentage to total.
Table 1.15 shows that among the total government teachers, from 11 teachers who had the years of experience below 5 years, 4 (3.3 per cent) had a low level of stress, 5 (4.2 per cent) had a medium level of stress and the remaining 2 (1.7 per cent) had a high level of stress.
Of the 40 teachers, who had the years of experience between 5 –10 years 10 (8.3 per cent) had a low level of stress, 26 (21.7 per cent) had a medium level of stress and the remaining 4 (3.3 per cent) had a high level of stress. Out of 33 teachers who had the years of experience between 10-15 years, 4 (3.3 per cent) had a low level of stress, 25 (20.8 per cent) had a medium level of stress and the remaining 4 (3.3 per cent) had a high level of stress. Of the 36 teachers who had the years of experience above 15 years, 7 (5.8 per cent) had a low level of stress, 20 (16.7 per cent) had a medium level of stress and the remaining 9 (7.5 per cent) had a high level of stress.
To test the hypothesis that the years of experience is independent of the level of occupational stress, the chi-square test has been applied and the calculated value is 7.66, table value at 5 per cent level of significance 12.592 and degrees of freedom 6.As the calculated chi-square value is less than the table value at 5 per cent level of significance with 6 degrees of freedom the hypothesis is accepted. Therefore, it may be concluded that there is no significant relationship between years of experience and their level of occupational stress among the government higher secondary school teachers.
AVERAGE STRESS SCORE ON THE BASIS OF THEIR YEARS OF EXPERIENCE
The average stress score of the government higher secondary teachers on the basis of their years of experience is given in the Table that follows.
TABLE 1.16: AVERAGE STRESS SCORE OF GOVERNMENT HIGHER SECONDARY TEACHERS ON THE BASIS OF THEIR YEARS OF EXPERIENCE Sl.No. Years of Experience Average Score Sample Size
1. Below 5 Years 358.36 11
2. 5 – 10 Years 365.53 40
3. 10 – 15 Years 401.73 33
4. Above 15 Years 390.25 36
Total 382.24 120
It could be observed from Table 1.16 that the average stress score of the teachers who are having the years of experience between 10 to 15 years (401.73) is higher than that of those with experience above 15 years (390.53) experience between 5 to 10 years (365.53) and experience below 5 years. It is proposed to test the hypothesis that the average occupational stress score of the three groups of government teachers on the basis of their years of experience is the same. “F” test was applied.
TABLE 1.17: YEAR OF EXPEREINCE AND OCCUPATIONAL STRESS SCORE OF GOVERNMENT HIGHER SECONDARY TEACHERS: F-TEST Sources of Variation Sum of Squares Degrees of Freedom Mean Square ‘F’ Value
Between Samples 32288.18 3 10765.73 2.35
Within Samples 532385.82 116 4589.53
Total 564674.00 119
The calculated value of “F” (2.35) is less than the table value of “F” (3.95) for 3 & 116 degrees of freedom at 1 per cent level of significance. Therefore the hypothesis is accepted. Hence, there is no significant difference in the average score of the three groups among the government school teachers.
MARITAL STATUS AND LEVEL OF OCCUPATIONAL STRESS
VOLUME NO. 3 (2013), ISSUE NO. 04 (APRIL) ISSN2231-5756
TABLE 1.18: CLASSIFICATION OF GOVERNMENT HIGHER SECONDARY TEACHERS ON THE BASIS OF THEIR MARITAL STATUS AND LEVEL OF OCCUPATIONAL STRESS
Sl. No.
Marital Status Level of Stress Total Low Medium High
1. Married 4
(3.3) 7 (5.8) 2 (1.7) 13 (10.8)
2. Unmarried 21
(17.5) 69 (57.5) 17 (14.2) 107 (89.2)
Total 25
(20.8) 76 (63.3) 19 (15.8) 120 (100.0)
Source: Primary data. Note: Figures in brackets represent percentage to total.
Table 1.18 shows that out of 13 married teachers, 4 (3.3 per cent) had a low level of stress, 7 (5.8 per cent) had a medium level of stress and the remaining 2 (1.7 per cent) had a high level of stress. Out of 107 unmarried teachers, 21 (17.5 per cent) had a low level of stress, 69 (57.5 per cent) had a medium level and the remaining 17 (14.2 per cent) teachers had a higher degree of stress.
To test the hypothesis that the marital status is independent of the level of occupational stress, the chi-square test has been applied and the calculated value 0.90, table value at 5 per cent level of significance 5.991and degrees of freedom is 2.As the calculated chi-square value is less than the table value at 5 per cent level of significance with 2 degrees of freedom, the null hypothesis is accepted. Therefore, it may be concluded that there is no association between marital status and the level of occupational stress among government higher secondary school teachers.
AVERAGE STRESS SCORE ON THE BASIS OF THEIR MARITAL STATUS
The average stress score of the Government higher secondary teachers on the basis of their marital status is given in the Table that follows:
TABLE 1.19: AVERAGE STRESS SCORE OF GOVERNMENT HIGHER SECONDARY TEACHERS ON THE BASIS OF THEIR MARITAL STATUS Sl.No. Marital Status Average Score Sample Size
1. Married 360.46 13
2. Unmarried 384.89 107
Total 382.24 120
Table 1.19 indicates that the average stress score of the government higher secondary teachers belonging to married (360.46) is lower than the average stress score of the teachers who are unmarried (384.89). It is proposed to test the hypothesis that the average occupational stress score of the two groups of sample government teachers on the basis of their marital status is the same. “Z” test was applied.
TABLE 1.20: MARITAL STATUS AND OCCUPATIONAL STRESS SCORE OF GOVERNMENT HIGHER SECONDARY TEACHERS: ‘Z’ TEST Sl.No. Marital Status Average Score Difference Standard Error ‘Z’ Value
1. Married 360.46 24.43 22.42 1.09
2. Unmarried 384.89
The calculated value of “Z” (1.09) does not exceed the critical value of “Z” (2.58) at 1 per cent level of significance. Therefore the null hypothesis is accepted. Hence it is concluded that there is no relationship between marital status and level of occupational stress.
TYPE OF FAMILY AND LEVEL OF OCCUPATIONAL STRESS
Type of family is also an important factor to be considered for the welfare of the teachers. Hence, it is decided to analyse the extent of nature of type of the family of the government teachers in relation to their occupational stress level.
TABLE 1.21: CLASSIFICATION OF GOVERNMENT HIGHER SECONDARY TEACHERS ON THE BASIS OF THEIR TYPE OF FAMILY AND LEVEL OF OCCUPATIONAL STRESS
Sl. No.
Type of Family Level of Stress Total Low Medium High
1. Joint 8
(6.7) 26 (21.6) 8 (6.7) 42 (35.0)
2. Nuclear 17
(14.2) 49 (40.8) 12 (10.0) 78 (65.0)
Total 25
(20.8) 76 (63.3) 19 (15.8) 120 (100.0)
Source: Primary data. Note: Figures in brackets represent percentage to total.
It could be inferred from Table 1.21 that out of 42 government teachers, 8 (6.7 per cent) teachers who fall under the category of joint family, had a low level of stress, 26 (21.6 per cent) had a medium level of stress and the remaining 8 (6.7 per cent) had a higher degree of stress.
Out of 78 teachers, 17 (14.2 per cent) who fall under the category of nuclear family had a low level of stress, 49 (40.8 per cent) had a medium level of stress and the remaining 12 (10.0 per cent) had a higher degree of stress.
To test the hypothesis that type of family is independent of the level of occupational stress, the chi-square test has been applied and the calculated value 0.52, table value at 5 per cent level of significance 5.991 and degrees of freedom is 2. As the calculated chi-square value is less than the table value at 5 per cent level of significance with 2 degrees of freedom, the null hypothesis is accepted. Therefore, it may be concluded that there is no association between type of family and their level of occupational stress among government higher secondary school teachers.
AVERAGE STRESS SCORE ON THE BASIS OF THEIR TYPE OF FAMILY
The occupational stress score of the teachers on the basis of their nature of family is given in the Table that follows.
TABLE 1.22: AVERAGE STRESS SCORE OF GOVERNMENT HIGHER SECONDARY TEACHERS ON THE BASIS OF THEIR TYPE OF FAMILY Sl.No. Type of Family Average Score Sample Size
1. Joint 378.14 42
2. Nuclear 383.59 77
Total 381.67 119
VOLUME NO. 3 (2013), ISSUE NO. 04 (APRIL) ISSN2231-5756
INTERNATIONAL JOURNAL OF RESEARCH IN COMMERCE, IT & MANAGEMENT
TABLE 1.23: TYPE OF FAMILY AND OCCUPATIONAL STRESS SCORE OF GOVERNMENT HIGHER SECONDARY TEACHERS: ‘Z’ TEST Sl.No. Type of Family Average Score Difference Standard Error ‘Z’ Value
1. Joint 378.14 5.45 13.64 0.40
2. Nuclear 383.59
The calculated value of “Z” (0.40) does not exceed the table value of “Z” (2.58) at 1 per cent level of significance. Therefore the null hypothesis is accepted. Thus it is concluded that there is no significant relationship between the independent variables.
SUBJECTS HANDLING AND LEVEL OF OCCUPATIONAL STRESS
Here, it is decided to analyse the extent of subjects handled by the government teachers in relation to their occupational stress level. The following Table gives clear information regarding the subjects handling of the teachers and their level of stress.
TABLE 1.24: CLASSIFICATION OF GOVERNMENT HIGHER SECONDARY TEACHERS ON THE BASIS OF THEIR SUBJECTS HANDLING AND LEVEL OF OCCUPATIONAL STRESS
Sl. No.
Subjects Handling Level of Stress Total Low Medium High
1. Arts 12
(10.1) 37 (31.1) 11 (9.2) 60 (50.0)
2. Science 13
(10.9) 23 (19.3) 3 (2.5) 39 (32.5)
3. Vocational 0
(0.0) 16 (13.3) 5 (4.2) 21 (17.5)
Total 25
(20.8) 76 (63.3) 19 (15.8) 120 (100.0)
Source: Primary data. Note: Figures in brackets represents percentage to total.
Table 1.24 shows that out of 60 teachers, 12 (10.1 per cent) who were handling arts subjects had a low level of stress, 37 (31.1 per cent) had a medium level of stress and the remaining 11 (9.2 per cent) had the higher degree of stress. Out of 39 teachers, 13 (10.9 per cent) who were handling science subjects had a low level of stress, 23 (19.3 per cent) had a medium level of stress and the remaining 3 (2.5 per cent) had a higher degree of stress level. Of the 20 teachers, 16 (13.3 per cent) who were handling vocational subjects had a medium level of stress and the remaining 5 (4.2 per cent) had a higher degree of stress.
To test the hypothesis that subjects handling is independent of the level of occupational stress, the chi-square test has been applied and the calculated value is 10.53, table value at 5 per cent level of significance 9.488 and degrees of freedom is 4.As the calculated chi-square value is more than the Table value at 5 per cent level of significance with 4 degrees of freedom, the null hypothesis is rejected. Therefore, it may be concluded that there is an association between subjects handling and their level of occupational stress among government school teachers.
AVERAGE STRESS SCORE ON THE BASIS OF SUBJECTS HANDLING
The occupational stress score of the government teachers on the basis of subjects handling is given in the Table that follows:
TABLE 1.25: AVERAGE STRESS SCORE OF GOVERNMENT HIGHER SECONDARY TEACHERS ON THE BASIS OF THEIR SUBJECTS HANDLING Sl.No. Subjects Handling Average Score Sample Size
1. Arts 377.35 60
2. Science 368.03 39
3. Vocational 421.25 21
Total 382.24 120
Table 1.25 depicts that the average stress score of the teachers who are handling science subjects (368.03) is lower than that of the teachers who are handling arts subjects (377.35) and vocational subjects (421.25). It is proposed to test the hypothesis, that the average occupational stress score of the teachers of the three groups remains the same. “F” test was applied.
TABLE 1.26: SUBJECTS HANDLING AND OCCUPATIONAL STRESS SCORE OF GOVERNMENT HIGHER SECONDARY TEACHERS: F-TEST Sources of Variation Sum of Squares Degrees of Freedom Mean Square ‘F’ Value
Between Samples 39711.84 2 19855.92 4.43
Within Samples 520332.37 116 4485.62
Total 560044.22 118
The calculated value of “F” (4.43) less than the table value of “F” (4.79) for 2 and 116 degrees of freedom at 1% level of significance. Therefore the null hypothesis is accepted. Hence it is concluded that there is no significant difference among the three groups, of government teachers in the stress level in school because of the subjects they handle.
LOCATION OF SCHOOL AND LEVEL OF OCCUPATIONAL STRESS
Location of school is an important factor to be considered for stress among teachers. The following table gives clear information regarding the location of the school and the teacher level of occupational stress.
TABLE 1.27: CLASSIFICATION OF GOVERNMENT HIGHER SECONDARY TEACHERS ON THE BASIS OF THEIR SCHOOL LOCATION AND LEVEL OF OCCUPATIONAL STRESS
Sl. No.
Location of School Level of Stress Total Low Medium High
1. Rural 20
(16.7) 57 (47.5) 16 (13.3) 93 (77.5)
2. Urban 2
(1.7) 10 (8.3) 3 (2.5) 15 (12.5)
3. Semi-Urban 3
(2.5) 9 (7.5) 0 (0.0) 12 (10.0)
Total 25
(20.8) 76 (63.3) 19 (15.8) 120 (100.0)
Source: Primary data. Note: Figures in brackets represent percentage to total.
VOLUME NO. 3 (2013), ISSUE NO. 04 (APRIL) ISSN2231-5756
To test the null hypothesis that location of the school is independent of the level of occupational stress, the chi-square test has been applied and the calculated value is 3.05, table value at 5 per cent level of significance 9.488 and degrees of freedom is 4. As the calculated chi-square value is less than the table value at 5 per cent level of significance with 4 degrees of freedom, the null hypothesis is accepted. Therefore, it may be concluded that there is no association between location of the school and their level of occupational stress among government higher secondary teachers.
AVERAGE STRESS SCORE ON THE BASIS OF THEIR LOCATION OF SCHOOL
The average occupational stress score of the three groups of government higher secondary teachers on the basis of their school location is given in the Table that follows.
TABLE 1.28: AVERAGE STRESS SCORE OF government HIGHER SECONDARY TEACHERS ON THE BASIS OF THEIR NUMBER OF THEIR LOCATION OF THE SCHOOL Sl.No. Location of School Average Score Sample Size
1. Rural 387.27 93
2. Urban 384.80 15
3. Semi-Urban 340.08 12
Total 382.24 120
It is inferred from Table 1.28 that the average stress score of teachers who are hailing from semi-urban (340.08) is lower than those of other two categories like rural (387.27) and urban (384.80). It is proposed to test the null hypothesis, that the average stress score of the teachers of the three groups vary the same. “F” test was applied.
TABLE 1.29: LOCATION OF SCHOOL AND OCCUPATIONAL STRESS SCORE OF GOVERNMENT HIGHER SECONDARY TEACHERS: F-TEST Sources of Variation Sum of Squares Degrees of Freedom Mean Square ‘F’ Value
Between Samples 23776.39 2 11888.19 2.57
Within Samples 540897.59 117 4623.06
Total 564673.99 119
Since the calculated