Please cite this article as: H. Nematzadeh and Z. Nematzadeh, Deterministic Measurement of Reliability and Performance Using Explicit Colored Petri Net in BPEL and Eflow, International Journal of Engineering (IJE), TRANSACTIONS A: Basics Vol. 28, No. 10 (October 2015) 1439-1446
International Journal of Engineering
J o u r n a l H o m e p a g e : w w w . i j e . i rDepartment of Computer Engineering, Islamic Azad University, Sari Branch, Sari, Iran
P A P E R I N F O
Paper history:
Received 09 February 2015
Received in revised form 25 March 2015 Accepted 03 September 2015
Keywords:
Web Service Compositions
BusinessProcess Execution Language Eflow
Colored Petri Net Reliability Performance
A B S T R A C T
Today there are many techniques for web service compositions. Evaluation of quality parameters has great impact on evaluation of final product. Business process execution language (BPEL) is one of those techniques that several researches have been done on its evaluation. However, there are few researches on evaluation of quality of service (QoS) in eflow. This research tries to evaluate performance and reliability of eflow and BPEL through mapping them to explicit colored petri net. To achieve this goal, colored petri net was enhanced with a new block of immediate transition, called Pick split/join. Then, a transformation table was proposed to show the mapping rules from basic and structured activities in eflow and BPEL to colored petri net. Finally, theory of probability was applied on the model to measure QoS. Web servie evaluation tool (WSET), a case tool in Java programming language, was developed for further simulation.
doi: 10.5829/idosi.ije.2015.28.10a.06
1. INTRODUCTION1
Due to lack of formalism in web service compositions (WSCs), QoS measurement could not be achieved specially when the overall WSCs is complex and big [1]. BPEL and eflow are two workflow based web
service compositions (WB-WSCs) which have
cumbersome evaluation process in the absence of a dedicated case tool. Furthermore, modeling languages (sometimes called modeling tools) were created to model and evaluate complicated systems. One of the most discussed modeling tools is colored petri net (CPN) [2, 3]. In this research the explicit CPN was used to do further reliability and performance measurement of BPEL and eflow. To achieve this goal, CPN was enhanced with a new block of immediate transition, called Pick split/join. Then, a transformation table was proposed to show the mapping rules from basic and structured activities in eflow and BPEL to explicit CPN. Finally, theory of probability was applied on the CPN model to measure reliability and performance. Web
*Corresponding Author’s Email:[email protected](Hossein Nematzadeh)
service evaluation tool (WSET), a case tool in Java programming language, was developed for further simulation as below:
1. WSET is able to convert the input BPEL/eflow to its relevant explicit CPN.
2. WSET measures reliability and performance of the input web service composition using theory of probabilities. It will be shown that this measurement is deterministic.
2. CRITICAL REVIEW
This section tries to find existing approaches and techniques in evaluation of WSCs. Ample of works have been done using petri net and its extensions on modeling and evaluation of service compositions which show how petri net can be useful for such researches. One major reason for selecting petri net as a formal method for evaluation of WB-WSCs is the graphical notation of petri net [3]. This feature of petri net makes it the first choice on modeling WSCs because WB-WSCs are pictorial and petri net is also a bipartite graph which can easily model workflow elements [4].
Deterministic Measurement of Reliability and Performance Using Explicit Colored
Petri Net in Business Process Execution Language
and Eflow
Moreover, with explicit view of petri net formal explicit structure checking can be achieved which was not supported by other approaches. Another advantage of petri net is in developing case tools for calculation of qualitative parameters.
Zhong et al. proposed a SPN approach for reliability prediction of web services. analysis is a major concept in service composition. They first transformed a BPEL into a SPN and claimed that workflow net is a kind of petri net. Finally they concluded the research with analytical results [6]. Mateo et al. also proposed a new modeling and evaluation method regarding workflows based on web service composition. The expressiveness of the proposed method was sufficient to obtain the semantic of complex web services [7]. Fu et al. proposed a new QoS-oriented web service composition model based on fuzzy petri net (FPN) as well as an algorithm for optimised web service composition. An illustrative example also was used to show the benefits of the proposed modeling in both building and execution of web services [8]. Xia et al. proposed a stochastic petri net based method in which transitions had stochastic firing. The method was proposed for modeling and performance evaluation of business process execution languages processes [9]. Usually petri net related research regarding QoS evaluation needs simulation, however most of the researches neglect to simulate the result [10, 11]. The result of this paper is based on a case tool especially designed for that. QoS calculation refers to measuring the quality values of WSCs. Basically, the scope of QoS measurement was mostly on BPEL. Eflow was neglected for QoS measurement however Tabatabaei et al. revealed the need for eflow QoS measurement as they identified that QoS measurement for eflow is low [1].
3. CONCEPTS
Eflow, BPEL, and CPN are studied and their basic concepts are given in the following subsections.
3. 1. Eflow Eflow is the enacted process by the service process engine proposed by software technology laboratory of Hewlett Packard in 2000 [12]. The composite service in eflow is called process schema which includes other basic or composite services. The enactment of process schema is called service process instance in eflow. Decision nodes (parallel AND/XOR), event nodes (request/notify) and service nodes (basic/multiservice/generic) are main parts in constituting any eflow. The concept of generic node introduces a new definition. Using a generic node the user can select at least one from many activities (services). Arcs in the eflow graph control the execution dependency.
3. 2. BPEL Business process execution language (BPEL) is a process that contains many basic and structured activities and was proposed by IBM and microsoft. Flow control is done in BPEL by links. Links also control concurrency with concurrent activities. In this research, these primitive activities were supported: receive, reply, invoke, throw, terminate, empty, wait and assign. Also the following structured activities are supported in BPEL in current research: switch, pick, and, while, sequence.
3. 3. CPN Colored petri net, CPN, is an extended version of ordinary petri net. CPN differes with PN in three major things:
1. Expression: arcs have expressions to carry colored tokens.
2. Transition guard: timed transitions have guards to fire colored tokens.
3. Color: colors could be data types in programming languages.
CPN was developed by CPN group in Aarhus University. It is a powerful tool for graphically concurrency modeling. It also uses the concept of computer programming and it is a more comprehensive format of ordinary PN.
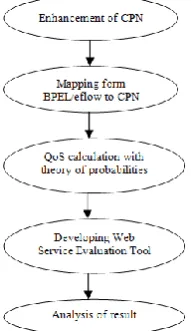
The research methodology includes five main phases as shown in Figure 1. First, CPN was enhanced with a new immediate transition called Pick split/join. Next, using a transformation table, mapping from BPEL/eflow to CPN was given. Then, deterministic QoS calculation was derived using theory of probabilities. Next, web service evaluation tool (WSET) was developed using Java programming language for simulation. Finally, customove and loan approval process (LAP) were validated in terms of reliablity and performance with WSET.
4. ENHANCEMENT of CPN
Figure 1. The research design
A boolean variable like "need" can be used to monitor which taransition in transitions’ pool should be fired. However, for PICK to be enabled to fire at least one of the transitions’ need should be true. The term “transitions’ pool” refers to number of transitions that potentially could be selected for firing. Unlike AND split and OR split, PICK split may fire at least one and at most all transitions in transition pool based on transitions’ need attribute as shown in Figure 2.
5. MAPPING FROM BPEL/EFLOW TO CPN
Table 1 shows how structured blocks in eflow and BPEL can be mapped to the relevant element in CPN. Split/join transitions are immediate transitions. Structured services are inclusive OR (switch), exclusive OR, concurrency (flow/And), loop (repeat/while) or sequential services. Join transitions are used for synchronization however, split transitions are used decision making and flow. Pick split/join is applicable in generic node of eflow. Figure 3 also shows how basic and sequential services can be modeled through CPN.
Figure 2. The schematic of PICK split/join with three transitions in generic pool
Figure 3. Basic and sequential service
TABLE 1. Structured services in eflow and BPEL
Composition
technique Concept Split/Join transition
eflow Generic node Pick split/join
eflow And And split/join
eflow Xor Or split/join
eflow Multiservice nodes And split/join
eflow Loop Or split/join
BPEL Pick Or split/join
BPEL Flow And split/join
BPEL Switch Or split/join
BPEL Loop Or split/join
6. QoS
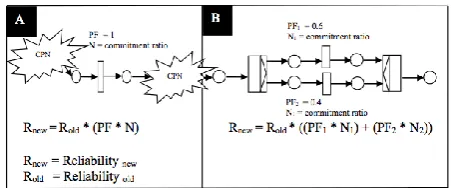
This section defines how reliability and performance would be calculated using CPN with the help of theory of probabilities. Figure 4 (B) shows the reliability calculation process in case of using OR split/join block or a single transition. Building blocks like AND split/join, OR split/join and PICK split/join are non-blocking and their commitment ratio is 1. The range of reliability is in the continuous interval of [0, 1]. To calculate reliability, commitment ratio of each transition is needed (N). In the best situation, reliability could remain one when reaching the end of CPN. Figure 4 is a portion of a CPN. The reliability calculation was shown where the CPN was depicted with transition and places. The quality value between OR split/join transitions is calculated either using the path with PF1 or using the path with PF2. This implies summation of (PF1*N1) and (PF2*N2). At the beginning of CPN, Rnew is 1. Obviously if the transitions are completely reliable the final Rnew remains 1 which usually does not happen in real problems. Assuming using And split/join in Figure 4(B), reliability would be calculated using Equation (1):
Rnew=Rold*min(N1,N2) (1)
Assuming using Pick split/join in Figure 3, using independent probability of firings reliability (PF1=0.6, PF2=0.5) would be calculated using Equation (2).
Rnew=Rold*H (2)
where H is calculated through Equation (3):
6. 1. Loop Management Equation (4) shows how a quality value like reliability is measured in a loop either repeat or while. The calculation is a deterministic calculation in which R shows the loop reliability.
R (1/p -1) (4)
Assuming the amount of reliability inside loop is R=0.97% and the probability of OR split to fire the token inside loop is q=30%, then the average quality of loop block diagram would be 97% 1.42 -1=0.9872. Thus, the overall quality value of a token after passing a loop block diagram can be calculated as Equation (5) in which p=1-q and q=probability of loop occurrence.
Rnew=Rold×R(1/p-1) (5)
6. 2. Performance Performance of the CPN can be calculated by attaching a time log to each timed transition. Immediate transitions will be fired the moment they are enabled. If a maximum and minimum time for the time log could be identified, the performance would be calculated deterministically using the average time. In Figure 4 (B) OR split/join are immediate transitions and are not time consuming tasks. Assuming the first transition inside Or split/join needs a minimum time of 4 seconds and a maximum time of 8 seconds to be completed. Then the average response time is Rt1= 6 seconds. Assuming that the average time of the second transition inside Or split/join is Rt2=8 seconds and thatthe token in the input place of OR split (i) has the average execution time of n=12 seconds with the PF1=0.6 and PF2=0.4. The quality value which here is the performance in the output place of OR join will be calculated as Equation (6) in which using OR split/join the performance would be 18.8. Pernew stands for Performancenew and Perold stands for Performanceold. Pernew=Perold +(PF1×Rt1)+(PF2×Rt2)
Pernew=12+(0.6×6)+(0.4×8)=18.8
(6)
Assuming using AND split/join in Figure 4(B) (in which PF1=PF2=1) the overall performance would be calculated through Equation (7) as follow:
Pernew=Perold+Max(Rt1,Rt2)
Pernew=12+Max (6,8)=20
(7)
Assuming using PICK split/join in Figure 4(B) using independent probability of firings (PF1=0.6, PF2=0.5) the overall performance would be calculated as 12 + (5.8/0.8)=12+7.25=19.25 through Equation (8) as follow:
Pernew=Perold+M (8)
where M is calculated as Equation (9):
( – ) ( ) ( ) ( ) ( – ) (9)
The nonfunctional requirements of performance with sequential transitions and loop is calculable as in Equations (10) and (11). Rt1 and Rt2 stands for average respose time of each transition. Average respose time is the mean of maximum and minimum time each tranition spends whereas Rt shows the average response time the structured activity, loop, spends.
Pernew=Perold+Rt1+Rt2 (10)
Pernew=Perold+Rt×(1/p-1) (11)
p=1-q; q=probability of loop occurrence
Figure 4. Deterministic calculation of reliability with (A) a single transition and (B) OR split/join
7. IMPLEMENTATION AND EXAMPLES
This section first describes web service evaluation tool (WSET) and the conversion procedures it use. Then two cases are identified for simulation using WSET.
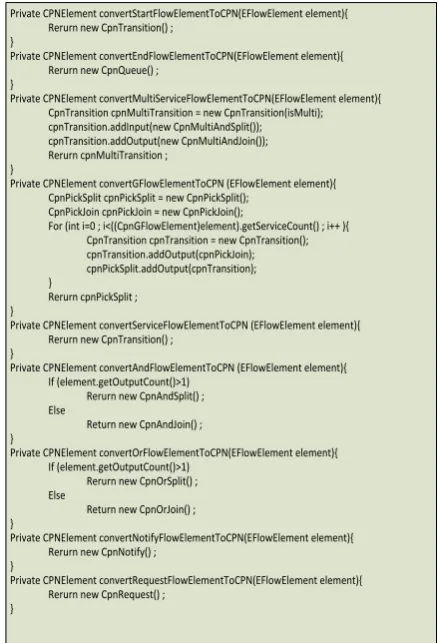
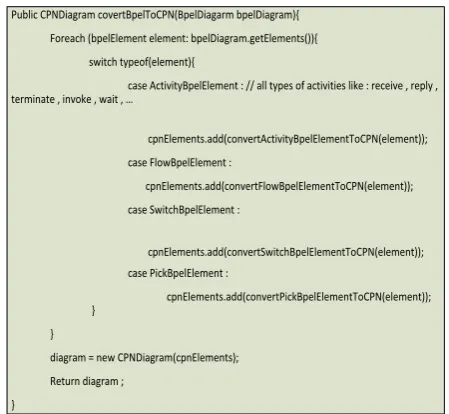
7. 1. WSET The section defines how WSET converts eflow, BPEL to CPN.The java pseudocode of the eflow to CPN converter is given in Figure 5 and the respective private methods are in Figure 6. WSET checks the eflow and for each of the elements of the eflow, it recalls its respective private method to produce the CPN. The elements of eflow are, start point, end point, multiservice node, generic nodes, service nodes, AND, OR, notify and request event node. In Figure 5 the respective private methods for producing the relative CPN nodes are given in which in case of having start point a transition appears in CPN, in case of having end point a place appears in CPN, in case of having multiservice node AND split/join blocks appears in CPN, in case of having generic node PICK split/join block with appropriate number of transitions as specified by the the eflow designer appears in CPN.
converter is given in Figure 7. In Figure 8 the respective private methods for producing the relative CPN nodes are given in which in case of having primitive activities a simple transition is replaced in the CPN. Regarding the QoS measurement, based on the input time which is specified by the user, the CPN is simulated. The public method token has two parameters: reliability, and performance. These parameters are initiated when the public method is called in each run of WSET. As the colored tokens pass the transitions of CPN the parameters of token will change accordingly and at the end of simulation the amount of parameters in end places of CPN will be aggregated and averaged. The data structure that is mostly used in WSET was queue. All the places of CPN have the first in first out queue in order to keep the tokens. Start transitions in CPN which are responsible to fire tokens inside the system also use first in first out queue. In order to detect the routing constructs of CPN (split/join transitions), a first in last out queue is associated with a token.
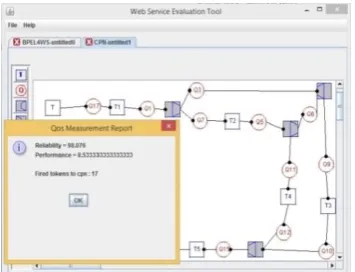
7. 2. Loan Approval Process A BPEL is illustrated in Figure 9 for loan approval process (LAP) in which the customer applies for a loan and the system replies with the appropriate information. LAP has composed of many web services related to assessing, approving and assigning loan to the customer. Simulation of LAP using WSET is shown in Figure 10. Assuming probability for firing each output in Or split is 50%. The invoke services have the commitment ratio of 0.99 whereas assign service has the commitment ratio of 0.97 and reply and receive services have commitment ratio of 1.The average time for 5 services are 3,3,4,3, and 2. Likewise, assuming the simulation time for CPN is 100. Since the initial transition has the average time of 6, it is expected that 100/6 colored tokens fire to the CPN through initial transition (transition T) in Figure 11. Simulation results for fired tokens (17 tokens) is very close to our estimation. Based on all the assumptions, the overall reliability and performance were calculated as 98/076 and 8/53 for LAP using WSET.
7. 3. Customove Customove is a wellknown service based project in the form of eflow as shown in Figure 12. There is a checkbox provided for the user (customer) in which the customer can select the intended services. Based on the customer selection a certain scenario occurs and a new instance of the customove process is initiated. There is an input parameter which shows selected services.
Public CPNDiagram covertEFlowToCPN(EFlowDiagram){ Foreach (EFlowElement element: EFlowDiagram.getElements()){
switch typeof(element){ case StartFlowElement :
cpnElements.add(convertStartFlowElementToCPN(element)); case EndFlowElement :
cpnElements.add(convertEndFlowElementToCPN(element)); case MultiServiceFlowElement :
cpnElements.add(convertMultiServiceFlowElementToCPN(element)); case GFlowElement :
cpnElements.add(convertGFlowElementToCPN(element)); case ServiceFlowElement :
cpnElements.add(convertServiceFlowElementToCPN(element)); case AndFlowElement :
cpnElements.add(convertAndFlowElementToCPN(element)); case OrFlowElement :
cpnElements.add(convertOrFlowElementToCPN(element)); case NotifyFlowElement :
cpnElements.add(convertNotifyFlowElementToCPN(element)); case RequestFlowElement :
cpnElements.add(convertRequestFlowElementToCPN(element)); }
}
diagram = new CPNDiagram(cpnElements); Return diagram ;
}
Figure 5. General public method regarding conversion eflow elements to CPN
Private CPNElement convertStartFlowElementToCPN(EFlowElement element){ Rerurn new CpnTransition() ;
}
Private CPNElement convertEndFlowElementToCPN(EFlowElement element){ Rerurn new CpnQueue() ;
}
Private CPNElement convertMultiServiceFlowElementToCPN(EFlowElement element){ CpnTransition cpnMultiTransition = new CpnTransition(isMulti); cpnTransition.addInput(new CpnMultiAndSplit()); cpnTransition.addOutput(new CpnMultiAndJoin()); Rerurn cpnMultiTransition ;
}
Private CPNElement convertGFlowElementToCPN (EFlowElement element){ CpnPickSplit cpnPickSplit = new CpnPickSplit();
CpnPickJoin cpnPickJoin = new CpnPickJoin();
For (int i=0 ; i<((CpnGFlowElement)element).getServiceCount() ; i++ ){ CpnTransition cpnTransition = new CpnTransition(); cpnTransition.addOutput(cpnPickJoin); cpnPickSplit.addOutput(cpnTransition); }
Rerurn cpnPickSplit ; }
Private CPNElement convertServiceFlowElementToCPN (EFlowElement element){ Rerurn new CpnTransition() ;
}
Private CPNElement convertAndFlowElementToCPN (EFlowElement element){ If (element.getOutputCount()>1)
Rerurn new CpnAndSplit() ; Else
Return new CpnAndJoin() ; }
Private CPNElement convertOrFlowElementToCPN(EFlowElement element){ If (element.getOutputCount()>1)
Rerurn new CpnOrSplit() ; Else
Return new CpnOrJoin() ; }
Private CPNElement convertNotifyFlowElementToCPN(EFlowElement element){ Rerurn new CpnNotify() ;
}
Private CPNElement convertRequestFlowElementToCPN(EFlowElement element){ Rerurn new CpnRequest() ;
}
Public CPNDiagram covertBpelToCPN(BpelDiagarm bpelDiagram){ Foreach (bpelElement element: bpelDiagram.getElements()){
switch typeof(element){
case ActivityBpelElement : // all types of activities like : receive , reply , terminate , invoke , wait , …
cpnElements.add(convertActivityBpelElementToCPN(element)); case FlowBpelElement :
cpnElements.add(convertFlowBpelElementToCPN(element)); case SwitchBpelElement :
cpnElements.add(convertSwitchBpelElementToCPN(element)); case PickBpelElement :
cpnElements.add(convertPickBpelElementToCPN(element)); }
}
diagram = new CPNDiagram(cpnElements); Return diagram ;
}
Figure 7. General public method regarding conversion BPEL elements to CPN
Private CPNElement convertActivityBpelElementToCPN(BpelElement element){
If (element isTypeOf RecieveBpelActivity)
Rerurn new CpnTransition(isStart) ;
If (element isTypeOf ReplyBpelActivity)
Rerurn new CpnTransition(isEnd) ;
Rerurn new CpnTransition() ;
}
Private CPNElement convertFlowBpelElementToCPN (BpelElement element){
If (element.getOutputCount()>1)
Rerurn new CpnAndSplit() ;
Else
Return new CpnAndJoin() ;
}
Private CPNElement convertSwitchBpelElementToCPN (BpelElement element){
If (element.getOutputCount()>1)
Rerurn new CpnOrSplit() ;
Else
Return new CpnOrJoin() ;
}
Private CPNElement PickBpelElement (BpelElement element){
CpnOrSplit cpnOrSplit = new CpnOrSplit ();
CpnOrJoin cpnOrJoin = new CpnOrJoin ();
For (int i=0 ; i<((PickBpelElement)element).getServiceCount() ; i++ ){
CpnTransition cpnTransition = new CpnTransition();
CpnTransition.addOutput(cpnOrJoin);
CpnOrSplit.addOutput(cpnTransition);
}
Rerurn cpnOrSplit;
}
Figure 8. Private method regarding conversion BPEL elements to CPN
The generic service node shows which services should be called based on the customer selections through a check box. In this scenario it is assumed that the services inside generic node should be committed in
parallel according to the customer’s input and the generic service node specification. Simulation of customove using WSET is shown in Figure 13. Assuming dependent probabilities for firing each output in Pick split are 30, 25, 25, 20 and 20%. Likewise, it was assumed that Data collection and Billing service has the commotment ratio of 0.99. Assuming the services inside generic node have the commitment ratio of 0.99, 0.99, 0.99, 0.98 and 0.95, respectively, from the top in Figure 12. Similirly, assuming the services inside generic node consume average time of 5, 3, 3, 4 and 6, respectively, from the top in Figure 12. Both of Data collection and Billing service consume average time of 3. Based on the average time of initial transition it is expected 100/6 colored tokens would be fired to the CPN in Figure 14. Simulation result for fired tokens (19 tokens) is very close to our estimation. Based on all assumptions, the overall reliability and performance were calculated as 96/180 and 10/4 for customove using WSET.
Figure 9. LAP
Figure 11. Reliability and performance of LAP with WSET
Figure 12. Customove
Figure 13. Simulation of customove with WSET
Figure 14. Reliability and performance of customove with WSET
8. DISCUSSIONS AND CONLUSION
Clearly the QoS for a WSC depends on the quality level of each service it entails. The more qualified the
services, the more qualified the WSC. In this paper, instead of fuzzy thinking, now it can be said that the reliability is almost 98% and the performance is approximately 8 unit of time for LAP. SOA analysts, specially those who work in the field of web service composition can directly use the result of this paper to evaluate their eflow/BPEL numerically and detect the shortcomings in terms of QoS before delivering it to the final user or the customers. Generally, the majority of researches on WB-WSCs ignored the evaluation of eflow. However, there are plenty of researches on BPEL testing [2, 5-9]. But the majority of petri net based researches on evaluation of BPEL had the following limitations based on Table 2:1) implicit petri net view was applied and 2) lack of a case tool for evaluation process. Through this research the following four major achievements were obtained: 1) enhancement of explicit CPN with PICK split/join transition, 2) transformation of eflow and BPEL to CPN, 3) deterministic QoS measurement of WB-WSCs using explicit CPN and 4) implementing a case tool, WSET, for simulation of the findings.
TABLE 2. Comparison of proposed method with existing works
Method QoS PN type Scope Case
tool
[6] performance & reliability
Implicit
SPN BPEL NO
[8] Only performance
Implicit
SPN BPEL NO
[5] Only reliability Implicit
PN BPEL NO
[2] Only performance
Implicit
TPN BPEL NO
[7] Only performance
Implicit
CPN BPEL NO
[9] Only performance
Implicit
SPN BPEL NO
Proposed Method
performance & reliability
Explicit CPN
BPEL & eflow YES
9. REFERENCES
1. Tabatabaei, S.G.H., Kadir, W.M.N.W. and Ibrahim, S., "A comparative evaluation of state-of-the-art approaches for web service composition", in Software Engineering Advances, ICSEA'08. The Third International Conference on, IEEE., (2008), 488-493.
2. Song, W., Ma, X., Ye, C., Dou, W. and Lu, J., "Timed modeling and verification of bpel processes using time petri nets", in Quality Software, QSIC'09. 9th International Conference on, IEEE., (2009), 92-97.
4. Nematzadeh, H., Deris, S., Maleki, H. and Nematzadeh, Z., "Evaluating reliability of system sequence diagram using fuzzy petri net", International Journal of Recent Trends in
Engineering, Vol. 1, No. 1, (2009), 142-147.
5. Chen, L., Chen, L., Shao, Z., Fan, G., Ma, H. A Method for Analyzing and Predicting Reliability of BPEL Process. Journal of Software. Academy Publisher, Vol. 4, No.1, (2009). 11-18. 6. Zhong, D., and Qi, Z.. A Petri Net Based Approach for
Reliability Prediction of Web Services . In Meersman, R. (Ed). On The Move to Meaningful Internet Systems Springer Berlin Heidelberg (2006) 116-125
7. Mateo, A., Valero, V., Macia, H., and Diaz, G. A Coloured Petri Net Approach to Model and Analyse Stateful Workflows-Based on WS-BPEL and WSRF. Escuela Superior de Ingenier´ıa Inform´atica, Universidad de Castilla-La Mancha. (2012). Spain, 1-20
8. Dong, Fu., Yang, W., G., Mei, Y. and Dong, X., "Fuzzy petri net-based optimized semantic web service composition", in Grid and Cooperative Computing,. GCC'08. Seventh International Conference on, IEEE., (2008), 496-502.
9. Xia, Y., Liu, Y., Liu, J,. Zhu, Q. Modeling and Performance Evaluation of BPEL Processes: A Stochastic-Petri-Net-Based Approach, IEEE Transactions on Systems, Man, And Cybernetics—PART A: Systems and Humans, VOL. 42, NO. 2, (2012)
10. Motameni, H., Movaghar, A. and Amiri, M.F., "Mapping activity diagram to petri net: Application of markov theory for analyzing non-functional parameters", International Journal of
Engineering Transactions B Applications, Vol. 20, No. 1,
(2007), 65-72.
11. Motameni, H. and Nemati, M., "Mapping crc card into stochastic petri net for analyzing and evaluating quality parameter of security (technical note)", International Journal of
Engineering-Transactions B: Applications, Vol. 27, No. 5,
(2013), 689-697.
12. Casati, F., Ilnicki, S., Jin, L., Krishnamoorthy, V. and Shan, M.-C., "Adaptive and dynamic service composition in eflow", in Advanced Information Systems Engineering, Springer., (2000), 13-31.
Department of Computer Engineering, Islamic Azad University, Sari Branch, Sari, Iran
P A P E R I N F O
Paper history:
Received 09 February 2015
Received in revised form 25 March 2015 Accepted 03 September 2015
Keywords:
Web Service Compositions
BusinessProcess Execution Language Eflow
Colored Petri Net Reliability Performance
هديكچ
کینکت هزررما یفلتخم یاه
سیورس بیکرت یارب رتماراپ یبایزرا .دراد دوجو بو یاه
یمهم ریثات یفیک یاه ریثات رد
.دراد ییاهن لوصحم
BPEL
یکی هتفرگ تروص نآ یبایزرا یور رب یددعتم تاقیقحت هک تساه کینکت نآ زا .تسا
یکدنا تاقیقحت هچرگ یفیک تافص یبایزرا یور
eflow
نانیمطا تیلباق و ییاراک قیقحت نیا رد .تسا هدش ماجنا
BPEL
و
eflow
هکبش هب نآ تشاگن قیرط زا یگنر یرتپ یاه
هکبش ادتبا روظنم نیا هب لین یارب .دش یبایزرا حیرص یرتپ یاه
یگنر مان هب گنردلاب نشیزنرت کی اب
PICK split/join
دعاوق نداد ناشن یارب تشاگن لودج سپس .دش هداد هعسوت
زا تشاگن تیلاعف هکبش هب هتفایتخاس و هداس یاه یگنر یرتپ یاه
هزادنا تهج تلاامتحا یروئت زا اهتنا رد .دش هئارا
سیورس یبایزرا رازبا .دش هدافتسا سیورس تیفیک یریگ ( بو یاه
WSET
ن همانرب نابز هب یرازبا ،) اواج یسیو
، تهج
دش هداد هعسوت یزاس هیبش ماجنا
. doi: 10.5829/idosi.ije.2015.28.10a.06