*Corresponding author: Tuhin Bhadra ISSN: 0976-3031
Research Article
ASSESSING THE DEMAND, AVAILABILITY AND ACCESSIBILITY OF POTABLE WATER IN
INDIAN SUNDARBAN BIOSPHERE RESERVE AREA
Tuhin Bhadra
1*., Shouvik Das
1., Sugata Hazra
1and Bibhas Chandra Barman
21
School of Oceanographic Studies, Jadavpur University, Kolkata 32
2River Research Institute, West Bengal, Mohanpur, Nadia 741246
DOI: http://dx.doi.org/10.24327/ijrsr.2018.0903.1858
ARTICLE INFO ABSTRACT
Indian Sundarban Biosphere Reserve (SBR) area lies in the south-western part of Ganges Brahmaputra delta and supports 4.43 million population. Though crisscrossed by numerous rivers and bestowed by good amount of rainfall annually, scarcity of potable water is a major problem in SBR. Most of the rivers in Sundarbans have been disconnected from their sources and don’t receive upstream flows. Shallow ground water in SBR is brackish to saline while fresh groundwater occurs below 300m depth. To achieve the sustainable development goal of providing water for all in the region, assessment of water demand, its availability and accessibility are essential. From the population and its projection, the potable water demand has been estimated as 9.21 mcm and 22.68mcm in the SBR for the years 1991 and 2051 respectively. The available potable water in Sundarbans is not adequate to meet the need of the future population. The people of SBR mostly depend on spot water sources which are not always easily accessible. To improve the availability and accessibility of potable water in the region, switching to treated surface water, rainwater harvesting, artificial recharge in the shallow aquifers, desalinization of shallow groundwater might be helpful.
INTRODUCTION
Water scarcity is a major problem which occurs due to inadequate fresh water availability (Bandyopadhyay and Basu, 2017). Available freshwater for human consumption, comes from surface water bodies like rivers, lakes etc. and from aquifers (TWAS, 2002). With the increasing population, the freshwater sources are being exploited all over the world. Surface water is used more often than groundwater due to its easy accessibility. However, groundwater becomes the only source of potable water in the region where fresh surface water is not available. At least, half of the world’s population depend on ground water to meet their potable water need (UNESCO, 2015). About 2.1 billion people in the world lacked safely managed drinking water services at home in the year 2015 (WHO and UNICEF, 2017). Of this 2.1 billion people, 844 million did not have a basic drinking water service (ibid). Beside the availability, accessibility of safe potable water is another matter of concern. In 2015, 5.2 billion people used improved water sources located on their premises (WHO and UNICEF, 2017). Around 1.563 billion people had to travel (a round trip of 30 minutes or more) from their premises to collect
water, whereas 582 million people used unsafe sources to get potable water (ibid). Availability of safe potable water is directly linked with the health and wellbeing of population in a region. Around 80% of all the diseases in human beings develop due to contaminated water (Kaur et al., 2014). According to WHO (2017), drinking contaminated water is responsible for the death of 760,000 children (aged less than 5 years) in diarrheal disease every year. Safe drinking water is the utmost necessity to reduce the death as well to improve the quality of life (Lawson, 2011; Saana et al., 2016). In this backdrop, the present study has been designed to assess the demand, availability and accessibility of potable water in Indian Sundarban Biosphere Reserve (SBR) area inhabited by 4.43 million strong people (Hazra et al., 2015)in the south-western part of the world’s most populous delta (Akhtar et al., 2015; Ericson et al., 2006).
Water demand estimation for domestic use was initiated by Gottlieb in the year 1963.Thereafter a number of studies have been conducted over a large number of countries (Abu Rizaiza, 1991; Basani et al., 2008; Cheesman et al., 2008; Crane, 1994; David and Inocencio, 1998; Larson et al., 2006; Mu et al., 1990; Nauges and Strand, 2007; Nauges and van den Berg,
Available Online at http://www.recentscientific.com
International Journal of
Recent Scientific
Research
International Journal of Recent Scientific Research
Vol. 9, Issue, 3(K), pp. 25437-25443, March, 2018
Copyright © Tuhin Bhadra et al, 2018, this is an open-access article distributed under the terms of the Creative Commons Attribution License, which permits unrestricted use, distribution and reproduction in any medium, provided the original work is properly cited.
DOI: 10.24327/IJRSR
CODEN: IJRSFP (USA)
Article History:
Received 15th December, 2017
Received in revised form 25th
January, 2018
Accepted 23rd February, 2018
Published online 28th March, 2018
Key Words:
Tuhin Bhadra et al., Assessing The Demand, Availability And Accessibility of Potable Water In Indian Sundarban Biosphere Reserve Area
2006; Nauges and Whittington, 2010; Rietveld et al., 2000; Strand and Walker, 2005). In India, detailed studies on water demand have been carried out by Bhat (2014), Jain (2011) and Kumar et al. (2005). The usage of water for domestic purpose in India during 1997-98, was 30 km3 of which 17 km3 was surface water and 9 km3 was groundwater (Kumar et al., 2005). The study estimated that the water requirement for domestic use from the groundwater sources would be 42 km3 for low-demand scenario and 46 km3 for high-demand scenario by 2050 (ibid). In the next decade, the water demand in domestic sector in India is expected to grow by 40% from 41 to 55 trillion litres (Bhat, 2014). As estimated by the Ministry of Water Resource, Govt. of India, per capita water availability in the country will decrease almost 36% and 60% in the year 2025 and 2050 respectively from the 2001 level (Bhat, 2014). The water requirements for drinking and domestic purpose in West Bengal have been estimated by Rudra (2009). The same study indicated that the water requirement for drinking and domestic use in West Bengal were 0.088 billion cubic metre (bcm) and 1.981 bcm respectively in the year 2001. The drinking and domestic water demand would be 0.131 bcm and 3.215 bcm respectively by the year 2051 (ibid).Such studies, concerning water demand, availability and accessibility however is not available for the SBR area. Therefore assessment of the potable water demand, availability and accessibility are essential for sustainable water resource management in the vulnerable delta.
STUDY AREA
The SBR area of India lies in the south-western part of the Ganges-Brahmaputra delta and extends from 21°33'32.62" N to 22°38'15.66" N and 88°2'27.42" E to 89°5'46.06" E (Fig. 1). The total area of the SBR is 9630 sq.km comprising the reserve forest area of 4263 sq. km and the forest cleared habitation area of 5367 sq.km (Hazra et al., 2015). The habitation area is further subdivided into 19 community development (CD) blocks (sub-districts) of North and South 24 Parganas districts of West Bengal. SBR is crisscrossed by numerous creeks and rivulets, but most of the rivers have lost their connections with their parent rivers (Bhadra et al., 2017). The disconnected rivers don’t get freshwater from up streams and therefore have become saline. The shallow groundwater in SBR is also saline. The fresh water bearing aquifers occur at a depth of more than 250 meters (CGWB, 2006a; 2006b; Sinha Ray, 2010). Therefore the deep aquifers are the only source of potable water in the SBR.
Figure 1 Location Map of Indian Sundarbans
Scarcity of potable water is a common phenomenon in Sundarbans as the shallow groundwater is not suitable for drinking (Gayen, 2009; Sinha Roy, 2010; 2014; World Bank, 2014).Deep tube wells/ spot water sources are the main source of drinking water in the SBR. Almost 70% of the total people in the SBR have no or limited access to safe drinking water while only 32% households get piped water supply from deep aquifers (World Bank, 2014). Around 1925 deaths and over 1.5 million cases of diarrhoea were reported in 2008 (World Bank, 2014) due to inadequate household water supply, sanitation and hygiene. Salinity intrusion and coliform bacterial contamination during floods are two major problems which affect the quality of the spot water sources (ibid). In this perspective a quantitative and qualitative assessment of the potable water resource in Sundarbans has been carried out in the present study.
MATERIALS AND METHODS
The potable water demand in Sundarbans has been estimated using the total population in the region and the per capita potable water demand. The potable water includes the water for drinking (3 litres per capita per day) and cooking (5 litres per capita per day) (Govt. of India, 2011a).The population census data of 1991, 2001 and 2011 (Govt. of India, 1991a; 2001; 2011b) have been used to estimate the future population in the region. Based on the projected population, the future potable water demand in SBR has been assessed.
Among the four types of population projection methods (Smith et al. 2013), the trend extrapolation method with comparatively limited data requirement appear to be better suited for the field of demography as well as in other fields for small-area projections (Armstrong, 2001, Granger, 1989; Mahmoud, 1984; Makridakis et al., 2008; Schnaars, 1986; Siegel and Swanson, 2004; Smith et al., 2013).The population projection in the Indian Sundarbans has been done using the trend extrapolation method due the unavailability of required variables for other methods at block level. Five trend extrapolation methods namely Linear, Geometric, Exponential, Second-degree Polynomial and Logistic Curve have been used to estimate the projected population at the sub district (CD block) level in the SBR. However, the second degree polynomial method has finally been opted as its trend is close to average trend and it shows best fit with observed and predicted values for the SBR in sub district level.
International Journal of Recent Scientific Research
drinking water in the SBR has been assessed from the population census data (Govt. of India, 2011b). Some suggestions have been made at the end of the study to improve the potable water availability in the region.
RESULT
Potable Water Demand
Potable water demand in a region is directly linked with its total population. The total population of the SBR area has increased steadily in the past century. According to the census 1991, 2001 and 2011 the population of SBR was 3.16 million, 3.76 million and 4.43 million respectively (Fig.
estimates that with the existing trend, the total population in the SBR would be 5.16 million in 2021, 5.96 million in 2031, 6.83 million in 2041 and 7.77 million in 2051 (Fig. 2).
year 1991, the total population was the highes
(0.25 million) and the lowest in Sandeshkhali II (0.12 million). In 2051, the total population would be the highest in Canning (0.66 million) and the lowest in Namkhana (0.23 million).The increasing trend in population up to 2051 is ob
all the blocks. A declining or static trend has also been observed in Namkhana, Sagar, Kakdwip and Mathurapur
Figure 2 Projected Population (Trends of Different Extrapolation Methods) and Potable Water Demand in Indian Sundarban Bio
With the population growth, potable water demand increased from 9.21 mcm in 1991, to10.97 mcm in 2001 and to12.93 mcm in 2011 (Fig. 2). The projected potable water demand in 2021, 2031, 2041 and 2051 have been estimated to be15.07 mcm, 17.41 mcm, 19.95 mcm and 22.68 mcm respectively (Fig. 2). CD block wise estimation indicates that in the year 1991, potable water demand was the highest in Patharpratima (0.72 mcm) and the lowest in Sandeshkhali II (0.35 mcm) (Fig. 3). The future water demand (projected) would be however the highest in Canning I (1.94 mcm) and the lowest in Namkhana (0.67 mcm) in 2051 (Fig. 3). Therefore, understanding spatial variation of potable water demand and availability become imperative for effective water resource management to meet the sustainable development goal for this vulnerable delta.
Figure 3 CD Block wise Past, Present and Future Potable Water Demand in Sundarbans
International Journal of Recent Scientific Research Vol. 9, Issue, 3(K), pp. 25437-25443
en assessed from the population census data (Govt. of India, 2011b). Some suggestions have been made at the end of the study to improve
directly linked with its total population. The total population of the SBR area has past century. According to the census 1991, 2001 and 2011 the population of SBR was 3.16 million, 3.76 million and 4.43 million respectively (Fig. 2). The study estimates that with the existing trend, the total population in the SBR would be 5.16 million in 2021, 5.96 million in 2031, 6.83 million in 2041 and 7.77 million in 2051 (Fig. 2). In the census year 1991, the total population was the highest in Patharpratima the lowest in Sandeshkhali II (0.12 million). In 2051, the total population would be the highest in Canning-I (0.66 million) and the lowest in Namkhana (0.23 million).The increasing trend in population up to 2051 is observed in almost A declining or static trend has also been observed in Namkhana, Sagar, Kakdwip and Mathurapur-II.
Projected Population (Trends of Different Extrapolation Methods) and Potable Water Demand in Indian Sundarban Biosphere Reserve Area
With the population growth, potable water demand increased from 9.21 mcm in 1991, to10.97 mcm in 2001 and to12.93 mcm in 2011 (Fig. 2). The projected potable water demand in 2021, 2031, 2041 and 2051 have been estimated to be15.07 , 17.41 mcm, 19.95 mcm and 22.68 mcm respectively (Fig. 2). CD block wise estimation indicates that in the year 1991, potable water demand was the highest in Patharpratima the lowest in Sandeshkhali II (0.35 mcm) (Fig. emand (projected) would be however the highest in Canning I (1.94 mcm) and the lowest in Namkhana understanding spatial variation of potable water demand and availability become e management to meet the sustainable development goal for this vulnerable delta.
CD Block wise Past, Present and Future Potable Water Demand in Sundarbans
Water Availability
Potable water in the SBR area is only available in deep aquifers which are fresh in nature. There are three aquifer zones in the SBR (Sinha Roy, 2010; 2014). These aquifers occur below a confining clay layer of 20 to 50 m (ibid). The shallow aquifers within 60 m below ground level (bgl),
nature. The intermediate aquifer zone between 70 to 160 m bgl is also brackish to saline in nature. Fresh water is only available in the deeper aquifers between 160 to 400 m bgl(ibid). The recharge zone of these confined aquifers occurs above the Kolkata-Bashirhat region, where the confining clay aquitard disappears (Mukherjee, 2006). Estimation of fluid flow through these aquifer systems indicates that about11.68 mcm water flows through the shallow aquifers and about 18.25 mcm water flows through the deep aquifers
2014). About 59 mcm groundwater flows through the delta front area in North and South 24 Parganas annually (Mukherjee et al, 2007a). The fresh water bearing deep aquifers are being exploited increasingly as the shallow aquifers
potable water. Although the deep aquifers of Sundarbans are not affected by sea water intrusion process till date, the process may begin in near future due to the rapid depletion of groundwater in the region.
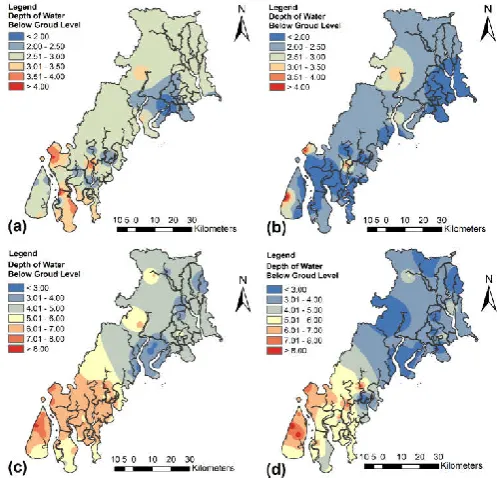
Water level fluctuations during
monsoon period for the shallow and deep aquifers have been studied. Water levels of deep aquifers are close (Within 4 m bgl) to ground level in central and northern blocks (Fig. 4). However, Water levels are not so close (More than 7
the southern blocks (Fig. 4). Water in shallow aquifers within 4 m bgl, but the water is not
4). In shallow aquifer, groundwater level fluctuates within 2 metres. However higher water level fluctuation of more t m in shallow aquifers is observed in Sagar and Kakdwip block. In deep aquifer groundwater level fluctuates within 3 metres. Higher water level fluctuation in deep aquifer is observed in Namkhana, Patharpratima, Mathurapur I, Mathurapur II and Sandeshkhali II.
Figure 4 Groundwater Level Fluctuation (a) Pre Post-monsoon Shallow Aquifer, (c) Pre
monsoon Deep Aquifer.
25443, March, 2018
Potable water in the SBR area is only available in deep aquifers which are fresh in nature. There are three aquifer zones in the SBR (Sinha Roy, 2010; 2014). These aquifers occur below a confining clay layer of 20 to 50 m (ibid). The shallow aquifers within 60 m below ground level (bgl), are mostly brackish in he intermediate aquifer zone between 70 to 160 m bgl brackish to saline in nature. Fresh water is only available in the deeper aquifers between 160 to 400 m bgl(ibid). The recharge zone of these confined aquifers occurs above the region, where the confining clay aquitard disappears (Mukherjee, 2006). Estimation of fluid flow through these aquifer systems indicates that about11.68 mcm water flows through the shallow aquifers and about 18.25 mcm water flows through the deep aquifers annually in SBR (Sinha Roy, 2014). About 59 mcm groundwater flows through the delta area in North and South 24 Parganas annually (Mukherjee , 2007a). The fresh water bearing deep aquifers are being exploited increasingly as the shallow aquifers are devoid of potable water. Although the deep aquifers of Sundarbans are not affected by sea water intrusion process till date, the process may begin in near future due to the rapid depletion of
Water level fluctuations during pre-monsoon and post-monsoon period for the shallow and deep aquifers have been studied. Water levels of deep aquifers are close (Within 4 m bgl) to ground level in central and northern blocks (Fig. 4). However, Water levels are not so close (More than 7 m bgl) in the southern blocks (Fig. 4). Water in shallow aquifers occurs within 4 m bgl, but the water is not suitable for drinking (Fig. 4). In shallow aquifer, groundwater level fluctuates within 2 metres. However higher water level fluctuation of more than 2 m in shallow aquifers is observed in Sagar and Kakdwip block. In deep aquifer groundwater level fluctuates within 3 metres. Higher water level fluctuation in deep aquifer is observed in Namkhana, Patharpratima, Mathurapur I, Mathurapur II and
Groundwater Level Fluctuation (a) Pre-monsoon Shallow Aquifer, (b) monsoon Shallow Aquifer, (c) Pre-monsoon Deep Aquifer (d)
Tuhin Bhadra et al., Assessing The Demand, Availability And Accessibility of Potable Water In Indian Sundarban Biosphere
Water Quality
Groundwater is the major, if not the only
water in Sundarbans. The quality of groundwater in Sundarban varies spatio-temporally. In shallow aquifer, Electrical conductivity (EC) varies from 2960 to 16688 µs/cm at 25°C and Chloride (Cl) ranges from 1854 to 13581 mg/l (Sinha Roy, 2014).It denotes that shallow groundwater is brackish to saline in nature. The shallow groundwater is neutral as the pH value ranges from 6.73 to 7.64 (Sinha Roy, 2014). The pH value of deep groundwater ranges from 7.4 to 8.1. Therefore, deep groundwater is slightly alkaline. The EC and Cl in deep aquifer range from 915 to 3960 µs/cm at 25°C and 64 to 1255 mg/l respectively (Sinha Roy, 2014). It reveals that the deep groundwater is comparatively fresh. According to Sinha Roy (2010, 2014), deep groundwater is potable and its q
within permissible limits of BIS drinking water standards. However, the quality of shallow groundwater lies above the BIS permissible limits(Sinha Roy, 2014). Calcium
(Ca-HCO3) and Sodium-Chloride (Na-Cl) are two dominant
water types in deltaic West Bengal (Mukherjee, 2009). The HCO3 enriched water is fresh and potable whereas,
type water occurs due to the groundwater saline water interaction in coastal aquifers of the SBR. As a result of saline water intrusion, significant modification of groundwater chemistry occurs in the coastal shallow aquifers of North and South 24 Parganas (Mukherjee et al., 2007b; Mukherjee and Fryar, 2008). Arsenic contamination is another problem in the study area. It affects the groundwater quality of eight blocks namely Haroa, Hasnabad, Minakhan, Hingalganj, Sandeshkhali II, Canning I, Canning II and Jaynagar I(Mukherjee, 2006) in the SBR. Shallow groundwater in these northern blocks is comparatively less saline and therefore is being overexploited for agriculture and other purposes. This over exploitation is mainly responsible for the arsenic contamination.
Water Sources & Their Accessibility
According to Census 2011, hand-pump (operated manually) is the major source of drinking water with access to almost 76% households in the SBR, which is much higher than the Rural India (43.6%). Tube well (operated through electrical or diesel pump) is another source of drinking water (15.5%), followed by tap water from treated and untreated sources (7.5%). The total percentage is below 1 for all other sources like covered and uncovered well, spring, river, pond etc. Among 19 blocks of the SBR, Kultali and Patharpratima have access to hand pump in more than 90 percent households, whereas the percentage is below 60 in Hasnabad and Hingalganj (Govt. of India, 2011b). The lower percentage of households havin access to hand pump in Hasnabad and Hingalganj does not imply that the households are deprived of the basic amenity as about 20 percent households have access to tap water which is the highest in the SBR area. Around 45% households in SBR have to travel a long distance (beyond 500 meters in rural areas) from their households to get drinking water (Fig. 5). This percentage is more than 55% in Hingalganj, Canning
Gosaba (Fig. 5). About 47%households have to travel near premises, which is within a distance of 500 meters (rural areas) to get drinking water. In Haroa, Minakhan, Sandeshkhali Hasnabad (northern blocks), 13% to32% households have the availability of drinking water within their premises.
Assessing The Demand, Availability And Accessibility of Potable Water In Indian Sundarban Biosphere
source of potable water in Sundarbans. The quality of groundwater in Sundarban temporally. In shallow aquifer, Electrical conductivity (EC) varies from 2960 to 16688 µs/cm at 25°C and Chloride (Cl) ranges from 1854 to 13581 mg/l (Sinha Roy, at shallow groundwater is brackish to saline in nature. The shallow groundwater is neutral as the pH value ranges from 6.73 to 7.64 (Sinha Roy, 2014). The pH value of deep groundwater ranges from 7.4 to 8.1. Therefore, deep . The EC and Cl in deep aquifer range from 915 to 3960 µs/cm at 25°C and 64 to 1255 mg/l (Sinha Roy, 2014). It reveals that the deep groundwater is comparatively fresh. According to Sinha Roy (2010, 2014), deep groundwater is potable and its quality is within permissible limits of BIS drinking water standards. However, the quality of shallow groundwater lies above the BIS permissible limits(Sinha Roy, 2014). Calcium-Bicarbonate Cl) are two dominant in deltaic West Bengal (Mukherjee, 2009). The enriched water is fresh and potable whereas, the Na-Cl type water occurs due to the groundwater saline water interaction in coastal aquifers of the SBR. As a result of saline water intrusion, significant modification of groundwater chemistry occurs in the coastal shallow aquifers of North and ., 2007b; Mukherjee and Fryar, 2008). Arsenic contamination is another problem in the study area. It affects the groundwater quality of eight blocks namely Haroa, Hasnabad, Minakhan, Hingalganj, Sandeshkhali g II and Jaynagar I(Mukherjee, 2006) in the SBR. Shallow groundwater in these northern blocks is comparatively less saline and therefore is being overexploited for agriculture and other purposes. This over exploitation is
contamination.
pump (operated manually) is the major source of drinking water with access to almost 76% households in the SBR, which is much higher than the Rural ll (operated through electrical or diesel pump) is another source of drinking water (15.5%), followed by tap water from treated and untreated sources (7.5%). The total percentage is below 1 for all other sources like covered er, pond etc. Among 19 blocks have access to hand-pump in more than 90 percent households, whereas the percentage is below 60 in Hasnabad and Hingalganj (Govt. of India, 2011b). The lower percentage of households having access to hand pump in Hasnabad and Hingalganj does not imply that the households are deprived of the basic amenity as about 20 percent households have access to tap water which is the highest in the SBR area. Around 45% households in SBR a long distance (beyond 500 meters in rural areas) from their households to get drinking water (Fig. 5). This percentage is more than 55% in Hingalganj, Canning-II, and Gosaba (Fig. 5). About 47%households have to travel near stance of 500 meters (rural areas) to get drinking water. In Haroa, Minakhan, Sandeshkhali-I &II, Hasnabad (northern blocks), 13% to32% households have the availability of drinking water within their premises.
Figure 5 Availability of drinking water fro
Management of Potable Water Resource
Some government initiatives have been taken by Public Health Engineering Department (PHED) and Sundarban Development Board of the Govt. of West Bengal to improve the availability and accessibility of potable water in Sundarban blocks. About 164 number of groundwater based piped water supply scheme have been implemented in different blocks of Sundarbans to serve a population of 2.16 million in near future. The number of on-going piped water supply project in the SBR is 45 which will additionally serve a population of 0.59 million. About 18 numbers (highest) of such schemes have been commissioned in Hasnabad. Numbers of schemes,
Gosaba, Kultali, Mathurapur I,
Patharpratima are 10, 13, 1, 16, 12, 16 and 13 respectively. In Falta-Mathurapur region, mega surface water based water supply scheme has been initiated by PHED. Water of the river Hugli will be treated and distributed through pi
project. Joynagar II, Kultali, Mathurapur
are the blocks which will be benefitted by that scheme. Sundarban Development Board installed a few solar pumps and RO plants to produce potable water from saline river water in Sundarbans(Govt. of India,2015). However, due to high sediment concentration and salinity (>15 ppt), the RO plants failed to produce potable water
DISCUSSION
Potable water is a scarce resource in Sundarbans as the rivers and shallow groundwater are saline and fresh groundwater is not easily accessible. The major rivers in the SBR, namely, Saptamukhi, Thakuran, Matla, Bidyadhari, Ichhamati have been disconnected from their parent rivers due to the siltation at their off-take point (Bhadra
disconnected rivers don’t get fresh water flow from upstream region (ibid). The people in Sundarbans depend on deep groundwater which is the only source of potable water in the region and occurs below a depth of more than
ground level. However, being a sensitive coastal ecosystem, there is a restriction of exploiting ground water for any purpose other than drinking. Withdrawal of ground water within 200 metres of the high tide line (HTL) is prohibited whereas, i area between 200 to 500 metres
withdrawal through ordinary well, is only permitted (Govt. of India, 1991b;2011c).
The study finds that the potable water demand in the region is increasing rapidly with the growing population.
2051 the demand will increase by 2.5 times compared to the 1991. CD block wise estimation shows that the potable water demand was the highest in Patharpratima in the year 1991 and will be the highest in Canning I by the year 2051. The estimated annual groundwater flow of 18.25 mcm (Sinha Roy, Assessing The Demand, Availability And Accessibility of Potable Water In Indian Sundarban Biosphere Reserve Area
Availability of drinking water from away of households in Sundarbans
Management of Potable Water Resource
Some government initiatives have been taken by Public Health Engineering Department (PHED) and Sundarban Development Board of the Govt. of West Bengal to improve the availability accessibility of potable water in Sundarban blocks. About 164 number of groundwater based piped water supply scheme have been implemented in different blocks of Sundarbans to serve a population of 2.16 million in near future. The number water supply project in the SBR is 45 which will additionally serve a population of 0.59 million. About 18 (highest) of such schemes have been commissioned in Hasnabad. Numbers of schemes, implemented in Basanti, Gosaba, Kultali, Mathurapur I, Mathurapur II, Kakdwip and Patharpratima are 10, 13, 1, 16, 12, 16 and 13 respectively. In Mathurapur region, mega surface water based water supply scheme has been initiated by PHED. Water of the river Hugli will be treated and distributed through pipes under that project. Joynagar II, Kultali, Mathurapur I and Mathurapur II are the blocks which will be benefitted by that scheme. Sundarban Development Board installed a few solar pumps and RO plants to produce potable water from saline river water in undarbans(Govt. of India,2015). However, due to high sediment concentration and salinity (>15 ppt), the RO plants failed to produce potable water from the river water.
Potable water is a scarce resource in Sundarbans as the rivers groundwater are saline and fresh groundwater is not easily accessible. The major rivers in the SBR, namely, Saptamukhi, Thakuran, Matla, Bidyadhari, Ichhamati have been disconnected from their parent rivers due to the siltation at adra et al., 2017). Therefore, the disconnected rivers don’t get fresh water flow from upstream region (ibid). The people in Sundarbans depend on deep groundwater which is the only source of potable water in the region and occurs below a depth of more than 300 m from ground level. However, being a sensitive coastal ecosystem, there is a restriction of exploiting ground water for any purpose other than drinking. Withdrawal of ground water within 200 metres of the high tide line (HTL) is prohibited whereas, in the area between 200 to 500 metres from the HTL, the manual withdrawal through ordinary well, is only permitted (Govt. of
International Journal of Recent Scientific Research Vol. 9, Issue, 3(K), pp. 25437-25443, March, 2018
2014) through deep aquifer would not be sufficient to meet the growing demand of potable water in future. In the northern and central CD blocks of Sundarbans, the water levels exist within 4 metres in the wells that tap the fresh water from deep aquifers. The water levels exist beyond 7 meters in the southern blocks of Sundarbans. This is due to the southward gradient of the deep aquifers. The groundwater quality in the northern blocks is affected by arsenic contamination which is a result of over exploitation of groundwater for agriculture and other purposes. Degrading water quality restricts the potability of water in SBR.
The people of Sundarbans mostly depend on hand-pump to get drinking water. The water sources are not always easily accessible. To improve the availability and accessibility of potable water in SBR, Govt. of West Bengal has initiated some groundwater based piped water supply schemes targeted to serve 2.75 million people in future. However, these schemes are not adequate to meet the potable water demand of the projected population of 2051. Therefore, switching to treated surface water, roof-top and large scale rainwater harvesting, artificial recharge to the shallow aquifer to bring down its salinity, establishment of RO plants to desalinize the sediment free and less saline shallow groundwater (Hazra et al., 2015, World Bank, 2014) might be helpful to manage the potable water resource in SBR.
CONCLUSION
Potable water in Sundarbans is under stress due to its increasing demand and limited supply. Deep Groundwater is the only source of potable water in the region as the rivers and shallow groundwater are saline in nature. As per the estimation, the demand of potable water in SBR was 12.93 mcm in 2011 and would be 22.68 mcm in 2051. The existing water sources and the estimated annual groundwater flow of 18.25 mcm through deep aquifers are not adequate to meet the potable water demand of the growing population in future. Almost 76% households in the SBR use hand-pump and around 45% households have to travel beyond 500 metres to get drinking water. Fresh water sources are not easily accessible in Sundarbans. The quality of groundwater is not always suitable for drinking. In northern blocks of Sundarbans arsenic contamination in fresh water bearing aquifers affects the quality of groundwater occurring in lenses within 100 meters of water depth. Shallow groundwater in the SBR is affected by saline water intrusion. Deep groundwater may also be affected by saline water intrusion process in near future due to the overexploitation of groundwater in the region. About 164 number of groundwater based piped water supply schemes have been implemented in Sundarbans by the Govt. of West Bengal to improve the availability and accessibility of potable water. However, these initiatives are not enough to support the potable water need of the growing population in near future. Therefore, to improve the potable water availability and accessibility, switching to treated surface water, rainwater harvesting, artificial recharge to the shallow aquifer, desalinization of shallow groundwater, conjunctive use of surface water and groundwater might be helpful in Sundarbans.
Acknowledgement
The authors would like to express their heartfelt gratitude to the University Grants Commission (UGC), India for providing
fund to conduct the study. Dr. S. P. Sinha Roy and Mr.Arnab Deb deserve special gratitude for their support to accomplish the study.
References
Abu Rizaiza, O.S. (1991): Residential water usage: a case study of the major cities of the western region of Saudi Arabia. Water Resour. Res., 27(5): 667-671.
Akter, J., Sarker, M.H., Popescu, I. and Roelvink, D. (2015): Evolution of the Bengal Delta and its prevailing processes. J. Coastal Res., 32(5): 1212-1226.
Armstrong, J.S. (2001): Extrapolation for time-series and cross-sectional data. In Principles of forecasting: A handbook for researchers and practitioners. Springer, Boston, pp. 217-243.
Bandyopadhyay, M. and Basu, R. (2017): Crisis of Fresh Water in South 24 Parganas District, West Bengal: Causes and Consequences. IOSR J. Humanit. Soc. Sci., 22(6): 04-15.
Basani, M., Isham, J. and Reilly, B. (2008): The determinants of water connection and water consumption: Empirical evidence from a Cambodian household survey. World Dev., 36(5): 953-968.
Bhadra, T., Mukhopadhyay, A. and Hazra, S. (2017): Identification of River Discontinuity Using Geo-Informatics to Improve Freshwater Flow and Ecosystem Services in Indian Sundarban Delta. In Hazra, S. et al (Eds.), Environment and Earth Observation, Springer Remote Sensing/Photogrammetry, Springer, Cham, pp.137-152.
Bhat, T.A. (2014): An analysis of demand and supply of water in India. J. .Environ. Earth Sci., 4(11): 67-72. CGWB. (2006a): Ground Water Information Booklet: North
24 Parganas District, West Bengal. Central Ground Water Board, Govt. of India, p.11.
CGWB. (2006b): Ground Water Information Booklet: South 24 Parganas District, West Bengal. Central Ground Water Board, Govt. of India, p.16.
Cheesman, J., Bennett, J. and Son, T.V.H. (2008): Estimating household water demand using revealed and contingent behaviours: Evidence from Vietnam. Water Resour. Res., 44(11): 1-11.
Crane, R. (1994): Water markets, market reform and the urban poor: results from Jakarta, Indonesia. World dev., 22(1): 71-83.
David, C.C. and Inocencio, A.B. (1998): Understanding household demand for water: the Metro Manila case. EEPSEA research report series/IDRC.Regional Office for Southeast and East Asia, Economy and Environment Program for Southeast Asia, p.32.
Ericson, J.P., Vörösmarty, C.J., Dingman, S.L., Ward, L.G. and Meybeck, M. (2006): Effective sea-level rise and deltas: causes of change and human dimension implications. Global Planet. Change, 50(1-2): 63-82. Gayen, A. (2009): Sustainable ground water management
options in the delta mouth area of Sundarban Islands, West Bengal. Bhujal News, 24(1): 79-84.
Gottlieb, M. (1963): Urban domestic demand of water in the United States. Land Econ., 39(2): 204-210.
Tuhin Bhadra et al., Assessing The Demand, Availability And Accessibility of Potable Water In Indian Sundarban Biosphere Reserve Area
West Bengal. Office of the Registrar General Census Commissioner.
Govt. of India. (1991b): Coastal Regulation Zone Notification 1991. Department of Environment, Forests & wildlife, Ministry of Environment & Forests. http://environmentclearance.nic.in/writereaddata/SCZM ADocument/CRZ%20Notification,%201991.pdf (Accessed 1st December 2017).
Govt. of India. (2001): Population Census 2001, Primary Census Abstract, North & South 24 Parganas District, West Bengal. Office of the Registrar General Census Commissioner.
Govt. of India. (2011a): Twelve Five Year Plan 2012-2017: Report of the Working Group on Rural Domestic Water and Sanitation, Ministry of Drinking Water and Sanitation.p.220.
Govt. of India. (2011b): Population Census 2011, Primary Census Abstract, North & South 24 Parganas District, West Bengal. Office of the Registrar General Census Commissioner.
Govt. of India. (2011c): Coastal Regulation Zone Notification 2011. Department of Environment, Forests & wildlife, Ministry of Environment & Forests. http:// http://www.moef.gov.in/sites/default/files/7_0.pdf (Accessed 1st December 2017).
Govt. of India. (2015): Water supply position in Sundarbans. Press Information Bureau, Ministry of Water Resource. http://pib.nic.in/newsite/PrintRelease.aspx?relid=121357 .
Granger, C.W.J. (2014): Forecasting in business and economics. Academic Press.
Hazra, S., Bhadra, T. and Sinha Roy, S.P. (2015): Sustainable Water Resource Management in the Indian Sundarban Delta. In proceeding of the International Conference on ‘Challenges to Ground Water Management: Vision 2050, CGWS, Kolkata, pp.324-332.
Jain, S.K. (2011): Population rise and growing water scarcity in India–revised estimates and required initiatives. Curr. Sci., 101(3): 271-276.
Kaur, B.J., George, M.P. and Mishra, S. (2014): Groundwater Quality and Water Quality Index of Delhi City, India. World Appl. Sci. J., 32 (5): 865-871.
Kumar, R., Singh, R. D. and Sharma, K. D. (2005): Water resources of India. Curr. Sci., 89(5): 794-811.
Larson, B., Minten, B. and Razafindralambo, R. (2006): Unravelling the linkages between the millennium development goals for poverty, education, access to water and household water use in developing countries: evidence from Madagascar. J. of Dev. Stud., 42(1): 22-40.
Lawson, E.O. (2011): Physico-chemical parameters and heavy metal contents of water from the Mangrove Swamps of Lagos Lagoon, Lagos, Nigeria. Adv. Biol. Res., 5(1): 8-21.
Mahmoud, E. (1984): Accuracy in forecasting: A survey. J. Forecasting, 3(2): 139-159.
Makridakis, S., Wheelwright, S.C. and Hyndman, R.J. (2008): Forecasting Methods and Applications. John Wiley & Sons.
Mu, X., Whittington, D. and Briscoe, J. (1990): Modeling village water demand behaviour: a discrete choice approach. Water Resour. Res., 26(4): 521-529.
Mukherjee, A. (2006): Deeper groundwater flow and chemistry in the arsenic affected Western Bengal Basin, West Bengal, India. University of Kentucky Doctoral Dissertations, p.248.
Mukherjee, A. (2009): Some recent advances in understanding the groundwater resources of Gangetic West Bengal. Bhujal News, 24(1): 18-27.
Mukherjee, A. and Fryar, A.E. (2008): Deeper groundwater chemistry and geochemical modeling of the arsenic affected western Bengal basin, West Bengal, India. Appl. Geochem., 23(4): 863-894.
Mukherjee, A., Fryar, A.E. and Howell, P.D. (2007a): Regional hydrostratigraphy and groundwater flow modeling in the arsenic-affected areas of the western Bengal basin, West Bengal, India. Hydrogeol. J., 15(7): 1397.
Mukherjee, A., Fryar, A.E. and Rowe, H.D. (2007b): Regional-scale stable isotopic signatures of recharge and deep groundwater in the arsenic affected areas of West Bengal, India. J. Hydrol., 334(1-2): 151-161.
Nauges, C. and Strand, J. (2007): Estimation of non-tap water demand in Central American cities. Resour. Energy Econ., 29(3): 165-182.
Nauges, C. and Van Den Berg, C. (2006): Perception of health risk and averting behavior: An analysis of household water consumption in Southwest Sri Lanka. Working Paper 08.09.253.LERNA, Toulouse, France. Nauges, C. and Whittington, D. (2010): Estimation of water
demand in developing countries: An overview. World Bank Res. Obs., 25(2): 263-294.
Rietveld, P., Rouwendal, J. and Zwart, B. (2000): Block rate pricing of water in Indonesia: an analysis of welfare effects. B. Indones. Econ. Stud., 36(3): 73-92.
Rudra, K. (2009): A state of Environment Report on Water Resource and Its Quality in West Bengal. West Bengal Pollution Control Board, Govt. of West Bengal, p.352. Saana, S.B.B.M., Fosu, S.A., Sebiawu, G.E., Jackson, N. and
Karikari, T. (2016): Assessment of the quality of groundwater for drinking purposes in the Upper West and Northern regions of Ghana. SpringerPlus, 5(1): 2001.
Schnaars, S.P. (1986): A comparison of extrapolation models on yearly sales forecasts. Int. J. Forecasting, 2(1): 71-85.
Siegel, J.S. and Swanson, D.A. (2004): The Methods and Materials of Demography. Elsevier Academic Press. California, USA.
Sinha Ray, S.P. (2010): Status of Ground Water Condition in Sundarban area, North & South 24 Parganas District, West Bengal. WWF-India.
Sinha Ray, S.P. (2014): Studies on the impact of global warming on the ground water resources and to develop strategies for fresh and sustainable drinking water supply of Sundarban area including Sagar Islands. Centre for Groundwater Studies, Kolkata.
International Journal of Recent Scientific Research Vol. 9, Issue, 3(K), pp. 25437-25443, March, 2018
Strand, J. and Walker, I. (2005): Water markets and demand in Central American cities. Environ. Dev. Econ., 10(3): 313-335.
TWAS. (2002): Safe Drinking Water The need, the problem, solutions and an action plan. Third World Academy of Sciences, Trieste Italy, p.23.
UNESCO (2015): The United Nations World Water Development Report 2015: Water for a Sustainable World. World Water Assessment Programme, The United Nations Educational, Scientific and Cultural Organization, Paris, p.122.
WHO. (2017): Diarrhoeal disease.
http://www.who.int/mediacentre/factsheets/fs330/ en/. Accessed 1st March 2018.
WHO and UNICEF. (2017): Progress on drinking water, sanitation and hygiene: 2017 update and SDG baselines. World Health Organization and the United Nations Children’s Fund, Geneva, p.108.
World Bank (2014): Building Resilience for Sustainable Development of the Sundarbans through Estuary Management, Poverty Reduction, and Biodiversity Conservation. World Bank Report No. 88061-IN, p. 273.
*******
How to cite this article: