How do population settlement patterns, agriculture and industry describe a place?
SSWG1B: Explain how human characteristics, such as population settlement patterns, and human activities, such as agriculture and industry can describe a place
CATEGORY INFORMATION
Where do most people live in the world?
Population Density
Average number of people living in an area
Reflects the size of country, its population, and environmental conditions Population densities varies in areas (countries, cities, regions)
Does not account for uneven distribution within a country
Countries with similar population may not have similar population densities Zambia & Belgium (11 million)
Zambia
Larger land area 37 people/ sq. mile Belgium
Smaller land area 881 people/ sq. mile
Uneven population distribution within a country
Population density in terms of land that can be used to support the population rather than total area
Egypt
186 people/ sq. mile 0r (5807 people/ sq mile) 99% of people live within 20 miles of the Nile River Rest of Egypt is desert
Population Distribution
90% of the world lives in the Northern Hemisphere 2/3 live between 200 N and 600 N latitudes
Live in lowland areas Along fertile rivers Edges of continents People live in areas with…
Mild climates Fertile soil Freshwater
People do not live in areas with… High mountain peaks
Barren deserts Frozen tundra Canada
31 million people
Large land area
Canada- 9 people/sq. mile
People live on southern border
Warmer temperatures Bangladesh
131 million people
Smaller land area
Bangladesh-2,361 people/sq. mile
Most of it rich farmland
Where do cities develop? Urbanization
1st cities in SW Asia over 5000 yrs ago Surplus food allowed growth of cities
People able to become merchants, traders, potters, weavers, government workers, preachers
City Location
Near key resources
Fresh water
Arable land
Mineral resources
▪ Johannesburg, South Africa (gold) ▪ Houston, TX (oil)
Transportation and trade routes
Along rivers
▪ London, UK ▪ Philadelphia, PA
Waterfalls or rapids
Railroad connection ▪ Chicago, IL
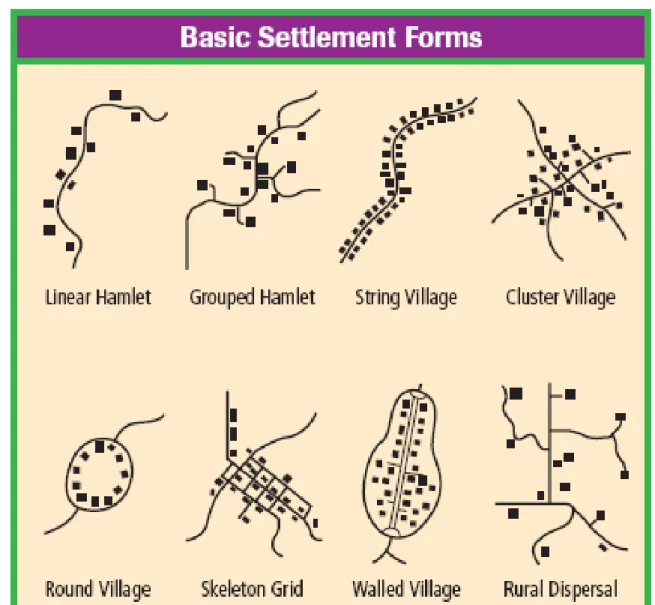
What do cities and rural areas look like?
See Diagram A – Basic Settlement Forms See Diagram B-Urban Area Models What are the current trends
in urbanization?
Developed countries 75% of population live in cities Less than half pe0ple in developing countries live in cities
Rapidly urbanized
Migration to cities for employment
Largest cities in developing countries Urban growth in rich countries is slow
Population are stable or increasing slowly
What are the different types of agricultural activity?
Subsistence Agriculture
Most widely practiced type of agriculture Food is produced by a family for its own needs Extra is sold
Uses little machinery
Africa, Asia, and Central and South America Shifting Cultivation
Tropical rain forest areas
Farmers clear trees or brush for planting (slash & burn) Fields are farmed for a few years (fertility decreases) Field is abandoned, new field is cleared
Pastoralism
Herding animals Animals provide milk
Animal skins or hair provide shelter or clothing Follow migration routes, follow herds
Animals may be sold
Herds represent wealth and prestige Market Oriented Agriculture
Commercial agriculture
Farmers grow products to sell to consumers
Mostly found in developed countries Scientific advances makes it productive
New animal breeds, fertilizers, pesticides, and plant varieties Ranches and farms are large owned by corporations
Agribusiness- operation of farms for efficiency and profit
How do people earn a living and use resources?
Industry-Primary Activities
Use natural resources directly Provide raw materials for industry Location
At the site of the natural resource being used Examples
Farming, fishing, forestry, herding, and mining Industry-Secondary Activities
Use raw materials to produce or manufacture something new Location
Close to the resource or close to the market for the finished product
Labor, energy, and land cost affects location Example:
Iron ore to Steel, processing wheat into flour, making lumber into plywood
Industry-Tertiary Activities
Provide services to people and businesses Location:
Usually near customers
Changing by the internet Examples:
Professional services (doctor, lawyer, teacher)
Retail and wholesale services (store clerks, truck drivers, restaurant staff)
Industry-Quarternary Activities
Process and distribute information
Not tied directly to resources, environmental conditions, or access to markets Require workers with specialize skills and knowledge
Location:
Anywhere
Access to skilled workers, good transportation and communication systems, places with pleasant climates and high quality of life Examples:
Research scientists, computer programmers, and government administrators
How do we classify the level of development of countries?
Measures of Development
Gross National Product (GNP)
Total value of goods and services that a country produces in a year
Includes goods and services made by citizens in foreign lands (Nike, Microsoft, IBM)
Gross Domestic Product (GDP)
Goods and services created within the country
Per capita GDP (GDP divided by number of people living there
Wide spread manufacturing based on machine power
Most people work in manufacturing, service and information industries
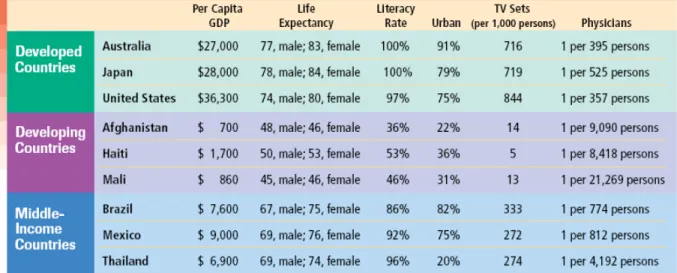
What are the characteristics of developed countries?
Developed Countries
High levels of industrialization High standard of living
High per capita GDP High levels of education Good health care High literacy rates Examples:
Most countries in Europe, USA, Canada, Japan, and Australia Most live in cities
Work in service or manufacturing industries Few work in agriculture
use advanced technology to produce large amounts of food) Good infrastructure
roads, ports, communication Global market economies
Developing Countries Poorer countries
Less productive economically Low standards of living High birth rates Low life expectancy Low education rate Examples:
Countries in Africa, Asia, Central and South America, and Pacific Islands Most people farm
Many homes without electricity
Few service businesses and manufacturing industries High urban migration rate
Middle Income Countries
Between rich and poorest countries
Have features of both developed and less developed factors Cities are modern
Rural areas and small towns are poor New industries
High urban migration Incomes rising Examples:
Mexico, Brazil, Thailand, Malaysia, Argentina, South Africa