A DAILY REPORT
by
Md Hasinur Rahaman Khan, PhD
Associate Professor of Applied Statistics University of Dhaka, Bangladesh
Report Number: 5-12042020
INTRODUCTION
NEW:
What is Covid-19?
First Covid-19 Infection in Bangladesh
Current Statistics (as of April 11)
482 36 No. of tests in last 24
30 416 hours: 954
8313 1
6.2 3
4 0.2 Male: 338
3 50 Female: 144
Total infections: Total deaths: Total tests: Case fatality rate:
Covid-19 (Coronavirus) in Bangladesh
According to Wikipedia [1], coronavirus disease 2019 (COVID-19) is an infectious disease caused by severe acute respiratory syndrome coronavirus (SARS-CoV-2). The disease was first identified in December 2019 in Wuhan, the capital of China's Hubei province, and has since spread globally,
resulting in the ongoing 2019–20 coronavirus pandemic. Common symptoms include fever, cough and shortness of breath. Other symptoms may include fatigue, muscle pain, diarrhea, sore throat, loss of smell and abdominal pain.
On 8 March, the first three coronavirus cases were confirmed. The IEDCR director Prof. Meerjady Sabrina Flora announced at a press conference that 2 men and 1 woman had tested positive for COVID-19. The patients were aged between 20 and 35. Of them, two men were Italy returnees and the woman was a family member of one of these two. Approximately about 111 tests were conducted in Bangladesh.
No. of days to double infections:
Total recovered: Total active cases: Current serious critical: Total cases per 1 million: Deaths per 1 million: Test per 1 million:
Gender-wise distribution of cases
This report is published by the author himself and the research results are based on the reported data including other secondary sources. The main objective of this report is to analyse the current situation of coronavirus in Bangladesh and to predict Covid-19 infections, deaths and other parameters on daily basis.
New projection for infections, severe and ICU patients by Polynomial Regression has been reported in Figure 1 and Table A.
PROJECTION
Infection Projection based on Polynomial Regression
Polynomial Reg based projection
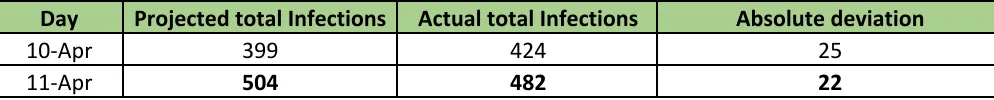
Day 10-Apr 11-Apr
Projection full table is given at the end of this report.
Absolute deviation 25
22
399 424
504 482
Actual total Infections Projected total Infections
Figure 1: Projected (based on polynomial regression)and Actual Covid-19 Total Infections in
Bangladesh for April 2020. Over 5000 infections are projected by end of April
Covid-19 infection cases have been projected based on the 2nd order polynomial regression. It appears that the regression fits the data very well (high R-square value, 0.988). The projection has been carried out on the April month's infection data that have been reported as of Apri 11, 2020. Figure-1 shows that projectied infections on April 15, 20 and 25 would be 1061, 2062, 3402
respectively. This graph also shows the actual number of infections as reported by IEDCR, Bangladesh for the respective day. These reported infections would be updated in this report on regular basis.
51 54 56 61 70 88 164218330424 482
62 45 42 53 76114165229308 399504 623756902 10611234 14211621 18352062 23032557 2825 3107 3402 3710 4032 4368 4718 5080 0 1000 2000 3000 4000 5000 6000 1 -Ap r 2 -Ap r 3 -Ap r 4 -Ap r 5 -Ap r 6 -Ap r 7 -Ap r 8 -Ap r 9 -Ap r 10 -Ap r 11 -Ap r 12 -Ap r 13 -Ap r 14 -Ap r 15 -Ap r 16 -Ap r 17 -Ap r 18 -Ap r 19 -Ap r 20 -Ap r 21 -Ap r 22 -Ap r 23 -Ap r 24 -Ap r 25 -Ap r 26 -Ap r 27 -Ap r 28 -Ap r 29 -Ap r 30 -Ap r To ta l n o of c as es
Actual and Predicted Total Cases of Covid-19 Infection in
Bangladesh for April 2020
(projection is based on 2-nd order polynomial regression)
Infection and Death Projection based on Adhoc Doubling Time Method
Figure 2: Projectedand Actual Covid-19 Total Deaths in Bangladesh for April 2020
Doubling time based projection
Day 10-Apr 11-Apr Absolute deviation 3 6 Projected total deaths Actual total deaths
24 27
24 30
Covid-19 infection cases have been projected based on the assumption that Bangladesh could experience the similar doubling time pathways (5 or 5.5days) as India and Pakistan experienced as of April 6, 2020. This is an adhoc non-parametric procedure. Figure 3 shows the actual number of actual infections as reported by IEDCR and the projection figure as found by the adhoc method for the month April 2020. Similarly, Covid-19 deaths are projected based on the assumption that Bangladesh could experience the average doubling time (5 days; average of 4 days for India and 6 days for Pakistan days) pathways like India and Pakistan. The doubling time is considered as of April 6, 2020. Following Figure--2 shows the projected number of deaths and the actual number of deaths as reported by IEDCR for the respective day (which to be updated on regular basis). Figure-3 shows the projected and actual number of infections and deaths together for the month April 2020. Both projections have been made on April 7, 2020.
17 24 34
48 68 136 192 272 384 0 50 100 150 200 250 300 350 400 450 6 -Ap r 7 -Ap r 8 -Ap r 9 -Ap r 10 -Ap r 11 -Ap r 12 -Ap r 13 -Ap r 14 -Ap r 15 -Ap r 16 -Ap r 17 -Ap r 18 -Ap r 19 -Ap r 20 -Ap r 21 -Ap r 22 -Ap r 23 -Ap r 24 -Ap r 25 -Ap r 26 -Ap r 27 -Ap r 28 -Ap r 29 -Ap r 30 -Ap r no o f c as es
Projected and Actual Covid-19 Deaths in Bangladesh for April
2020
(based on 5 days--doubling time as average of India (4 days) and Pakistan (6 days))
Doubling time based projection
Day 10-Apr
11-Apr 236
Bangladesh may get 3700 total infected people that are reported cases only by the end of April while the total death toll could be 384. Projection of deaths seems to be more accurate than projection of infections. The doubling time non-parametric procedure follows the straight pathways of India and Pakistan who are well ahead a few weeks in terms of infections and deaths. It can be mentioned that the people in this subcontinent have similarity in socio-economic, and food habits.
Figure 3: Projectedand Actual Covid-19 Infection and Deaths in Bangladesh for April 2020
Projected total Infections Actual total Infections Absolute deviation
231 424 193
246 482 328 492 840 1312 1968 3040 3696
17 24 34 48
68
136
192272 384
0 500 1000 1500 2000 2500 3000 3500 4000 6 -Ap r 7 -Ap r 8 -Ap r 9 -Ap r 10 -Ap r 11 -Ap r 12 -Ap r 13 -Ap r 14 -Ap r 15 -Ap r 16 -Ap r 17 -Ap r 18 -Ap r 19 -Ap r 20 -Ap r 21 -Ap r 22 -Ap r 23 -Ap r 24 -Ap r 25 -Ap r 26 -Ap r 27 -Ap r 28 -Ap r 29 -Ap r 30 -Ap r no o f c as es
Projected and Actual Covid-19 Infections and Deaths in
Bangladesh for April 2020
(projection on infections is based on 5 days--doubling time as average of India (4 days) and Pakistan (6 days))
(projection of deaths is based on 5 days--doubling time as avera
INFECTION TRAJECTORY
CASE FATALITY RATE
Figure-5 shows Bangladesh has the highest CFR rate which is the 6.4% (as of April 10) compared to south asian's other countries India, Pakistan and SriLanka. Note that CFR stands for the case fatality rate that is the ratio between the number of confirmed deaths from the disease and the number of confirmed cases, not total cases.
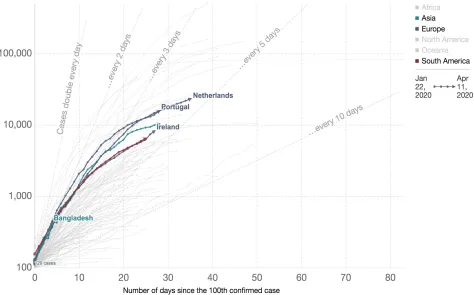
Figure 4: Infection Trajectory as of April 10, 2020 Data since 100 Confirmed Cases : Infection cases in the following days of April in Bangladesh would be following the similar pathways like Ireland, Portugal, Chile, Netherlands or Israel (figure source: our world in data).
0.70 0.30
Figure 5: Current Case Fatality Rate as of April 10 Data for Bangladesh, India, Pakistan and SriLanka (figure source: our world in data).
Figure 6: Scatter plot bet. no. of tests and repoted no. of infections based on April data.
Very strong positive correlation is found between the number of tests conducted in last 24 hours
and the reported number of infections by analysing data of
April month. The reported correlation coefficient is
0.92
Sex ratio (males to females) in infected population is
0 20 40 60 80 100 120
0 200 400 600 800 1000 1200 1400
No
o
f r
ep
or
te
d
in
fe
ct
io
ns
Tests in last 24 hours
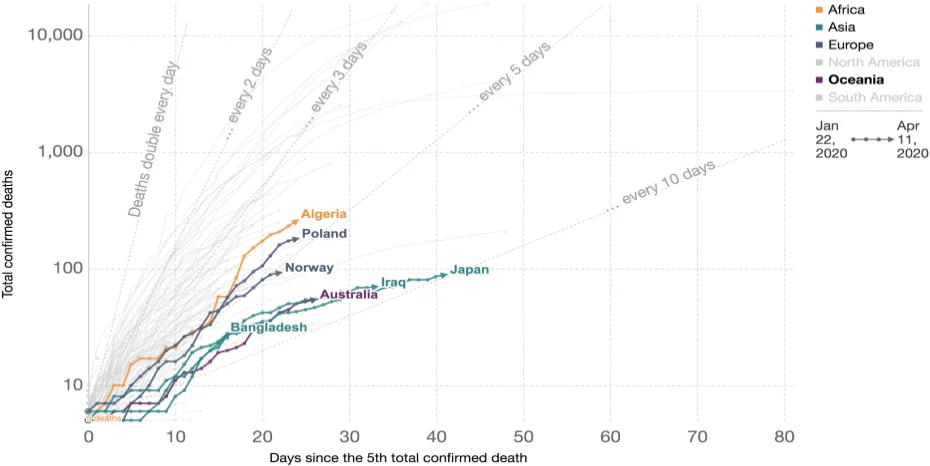
Figure 8: Death trajectory as of April 10 data. Death cases in the following days of April in Bangladesh would be the similar pathways like Poland, Algeria, Norway as high projection but like Iraq, Australia, Japan as low projection!
Figure 7: Number of beds and doctors per 1000 in Bangladesh (data source: our world in data)
0.1551
0.2158 0.22520.28780.3042
0.3081 0.3049
0.3 0.3
0.34 0.3
0.6 0.6
0.8
0.119 0.12 0.13 0.154 0.177
0.188 0.201 0.221 0.243
0.264 0.3
0.374 0.475
0.472
0 0.1 0.2 0.3 0.4 0.5 0.6 0.7 0.8 0.9
1970 1980 1981 1985 1990 1991 1994 1999 2001 2002 2005 2011 2014 2015
Be
ds
a
nd
d
oc
to
rs
p
er
1
00
0
Year
Hospital beds and doctors per 1000 in Bangadesh
Table: A
Date
Total
Infections
Tot. Severe
patients*
Tot. ICU
patients*
Total
Deaths
11-Apr 504 68 61 24
12-Apr 623 84 75 34
13-Apr 756 101 91 40
14-Apr 902 121 108 44
15-Apr 1061 142 127 48
16-Apr 1234 165 148 48
17-Apr 1421 190 170 68
18-Apr 1621 217 195 80
19-Apr 1835 246 220 88
20-Apr 2062 276 247 96
21-Apr 2303 309 276 96
22-Apr 2557 343 307 136
23-Apr 2825 379 339 160
24-Apr 3107 416 373 176
25-Apr 3402 456 408 192
26-Apr 3710 497 445 192
27-Apr 4032 540 484 272
28-Apr 4368 585 524 320
29-Apr 4718 632 566 352
30-Apr 5080 681 610 384
USEFUL LINKS
2. COVID-19 Resource Centre - The Lancet. https://www.thelancet.com/coronavirus
REFERENCES
1. Wikipedia. https://en.wikipedia.org/wiki/Coronavirus. Accessed on April 7, 2020 2. Our World in Data. https://ourworldindata.org/coronavirus. Accessed on April 11, 2020 3. Worldometer. https://www.worldometers.info/coronavirus. Accessed on April 11, 2020 4. IEDCR. https://www.iedcr.gov.bd. Accessed on April 11, 2020
How to cite: Khan, M.H.R. (2020). Covid-19 (Coronavirus) in Bangladesh, Report No. 5-12042020 5. Intensive care management of coronavirus disease 2019 (COVID-19): challenges and recommendations, Lancet resp med 2020.
*No of severe and icu patients have been estimated based on ref [5].
According to reference [5], 12% of all reported cases need ICU
admissions and 13.4% of all patients are treated as severe. All
severe patients need hospital admissions along with other
symptomatice patients with sufficient symptoms. We found that by the end of April, BD need over 600 ICU beds, which by mid April is 50. Here the deaths are calibrated with adhoc doubling time method while infections are
calibrated with polynomial regression.
Projection
1. Coronavirus disease (COVID-19) advice for the public: Myth busters. WHO.