W
all
y
Br
oe
cker
The Carbon Cycle
and Climate Change:
Memoirs of my 60 years
in Science
L
ianeG. B
enninGUniversity of Leeds, United Kingdom
Editorial Board
T
ime
LLioTTUniversity of Bristol, United Kingdom
e
ricH. o
eLkersCNRS Toulouse, France
s
usanL.s. s
TippUniversity of Copenhagen, Denmark
Editorial Manager
m
arie-a
udeH
uLsHoffGraphical Advisor
J
uand
ieGor
odriGuezB
Lanco University of Leeds, UKEach issue of Geochemical Perspectives
presents a single article with an in-depth view on the past, present and future of a field of geochemistry, seen through the eyes of highly respected members of our community. The articles combine research and history of the field’s development and the scientist’s opinions about future directions. We welcome personal glimpses into the author’s scientific life, how ideas were generated and pitfalls along the way. Perspectives articles are intended to appeal to the entire geochemical community, not only to experts. They are not reviews or monographs; they go beyond the current state of the art, providing opinions about future directions and impact in the field.
Copyright 2012 European Association of Geochemistry, EAG. All rights reserved. This journal and the individual contributions contained in it are protected under copy-right by the EAG. The following terms and conditions apply to their use: no part of this publication may be reproduced, translated to another language, stored in a retrieval system or transmitted in any form or by any means, electronic, graphic, mechanical, photo-copying, recording or otherwise, without prior written permission of the publisher. For information on how to seek permission for reproduction, visit:
www.geochemicalperspectives.org
or contact office@geochemicalperspectives.org.
The publisher assumes no responsibility for any state-ment of fact or opinion expressed in the published material.
ISSN 2223-7755 (print) ISSN 2224-2759 (online)
Principal Editors in charge of this issue
Susan L.S. Stipp, Eric H. Oelkers
Reviewers
Sigurður R. Gíslason, University of Iceland
Harry Elderfield, University of Cambridge, UK
Cover Layout Pouliot Guay Graphistes Typesetter Info 1000 Mots Printer J.B. Deschamps
ABOUT THE COVER
Tufa towers in Mono Lake, Central California. These tufa towers are formed from CaCO3 that
precipitates from the lake water as alkaline groundwater enters from springs; they have become exposed as the lake level dropped in response to natural processes and water diversion from the watershed.
Photo credit: Avraham Kushnirov/Veer
www.eag.eu.com
Geochemical Perspectives
is an official journal
of the European Association of Geochemistry
The European Association of Geochemistry, EAG, was established in 1985 to promote geochemistry, and in particular, to provide a platform within Europe for the presentation of geochemistry, exchange of ideas, publications and recognition of scientific excellence.
officers of the eaG council
Contents
Foreword . . . . III
The Carbon Cycle and Climate Change :
Memoirs of my 60 years in Science . . . . 221
Abstract . . . . 221
1 . Introduction . . . . 222
2 . Wheaton Days . . . . 223
3 . A Piece of Teflon . . . . 227
4 . A Long Ago Barbeque . . . . 231
5 . Espionage . . . . 234
6 . Ascarite . . . . 236
7 . Terminations . . . . 239
8 . Cornbread and the Deacon . . . . 242
9 . Whitings . . . . 247
11 . Milankovitch . . . . 253
12 . Magnetic Reversals . . . . 256
13 . GEOSECS . . . . 258
14 . David Schindler . . . . 263
15 . How to Cool a Planet . . . . 267
16 . The Missing Sink . . . . 270
17 . Redfield Ratios . . . . 273
18 . Global Warming . . . . 277
19 . The Conveyor . . . . 279
20 . Crying Wolf . . . . 283
21 . Atom Counting . . . . 285
22 . Diplomacy . . . . 287
23 . The Cult . . . . 289
24 . Armadas of Icebergs . . . . 292
25 . Ocean Acidification . . . . 295
26 . Rock Varnish . . . . 297
27 . Calcite Dissolution . . . . 300
28 . The Harvardton Bears . . . . 305
29 . Ruddiman . . . . 307
30 . The Mystery Interval . . . . 309
31 . Gary Comer . . . . 313
32 . Water . . . . 317
33 . Air Capture of CO2 . . . . 322
34 . Iceland . . . . 326
35 . What’s Left to Do? . . . . 328
References . . . . 331
Foreword
We are proud to present this issue of Geochemical Perspectives. It relates the
personal odyssey of Wally Broecker, from his first days at university to his
viewpoint now, looking back over a panorama of 60 years in science. Through
his broad and deep experience and his ability to think analytically, he has played
a central role in the development of our understanding of the carbon cycle. His
narrative tells some of the events in perhaps the most riveting geoscientific
story of our generation – the discovery of the interdependency of climate and
the oceans.
Over our careers, we have heard Wally giving talks on past climates,
ocean circulation and more recently, CO
2. We have heard his probing questions
at our talks or those of others and we have read the papers he has coauthored
with colleagues. Over the years, we learned the scientific story but we
under-stood very little about how the story developed. Now in this issue, we get a
glimpse inside. How does one set out to explore something as obscure as past
climate? How can one even begin to discover the controls on climate? Can the
geologic record reveal climate change over millions of years? Here, Wally tells
us some of the rest of the story.
We hope you will find it as enlightening as we have – about isotope ratios,
carbon, oceans and climate – but perhaps more important, about how a scientist
struggles after the truth.
the Carbon CyCle
and Climate Change :
memoirs oF
my 60 years in sCienCe
AbSTRACT
This manuscript presents the development of our current understanding of how the oceans operate and how past climates are reconstructed from the personal viewpoint of the author. It begins with the application of radiocarbon dating of carbonate rocks to deduce past climatic conditions. Age dating of carbonate sedi-ments and microfossils provides a history of sea level rise and fall that closely matches fluctuations in temperature, which in turn correspond with cyclic changes in the Earth’s orbit. The origins of our understanding of how ocean circulation can affect global climate are reviewed and the essential role of atmo-spheric carbon-dioxide content is explored. Central to this climate link is the rate of CO2 flux between the various terrestrial reservoirs including seawater, glacial
ice and the terrestrial biota. The manuscript concludes by describing how the collected knowledge about the carbon cycle provides insight into capture of CO2
1.
InTRoduCTIon
I summarise here my life as a scientist. Except for two six month sabbaticals at Caltech and one in Heidelberg, Germany, all 60 years have been spent here at Lamont. I say “Lamont” because when I arrived in June 1952, it was Lamont Geological Observatory. It then became Lamont-Doherty Geological Observa-tory and it is now Lamont-Doherty Earth ObservaObserva-tory. I am a lucky man to have been associated with this marvellous institution. Recently, I learned that our Earth science unit was ranked number one in the U.S. As far as I’m concerned, it has always been number one. During these 6 decades, I have published 480 papers and written 11 books. Along the way, I have worked with 50 graduate students and 35 post doctoral fellows. In this issue, I relate the accomplishments that stand out in my mind as meritorious and that hopefully will be of interest to at least some of the geochemistry community. At 80, it is not clear how long it will be before my memory becomes a fog so I’ve put aside two months to write it all down. Perhaps the product will inspire some young people to follow in my tracks. I hope so. It has been an exciting run. I wake up each day raring to pry loose more of nature’s closely guarded secrets.
I confine this summary to my life as a scientist. Of course, the things I discuss here were intertwined with my home life. I helped to raise 6 children and now have 7 grandchildren and 5 great grandchildren. I say “helped” because the giant share of the effort was that of my late wife, Grace. Without her support and understanding, my wheels would likely have come off, but all that is another story that will surely never be told. Since Grace’s death five years ago, with the help of my daughters and my second wife, Elizabeth Clark, I have kept on track. My spirits remain high and, thanks to the wonders of modern medicine, my health is quite good. I dedicate this issue to the late Paul Gast (Fig. 1). Not only did he steer me to Columbia, but he helped me through graduate school, and also later in life, directing the Lamont Geochemistry Group. Ph ot o c ou rt es y o f L am on t-D oh er ty E ar th O bs er va to ry A rc hi ve s.
Figure 1 The late Paul Gast, my
2.
WheATon dAyS
In September of 1949, my high school buddy, Ernie Sandeen, and I drove our jointly owned 1934 Ford Coupe 30 miles west from our homes in Oak Park, Illi-nois. In the rumble seat were the possessions we needed for studies at Wheaton College (Fig. 2). Although academically strong, students at Wheaties, as we called it, were immersed in Christian Fundamentalism. First off, to get admitted, you had to sign a pledge not to smoke, drink, dance or attend movies. Further, each day we were required to attend a chapel service. Grade points were deducted for absence. To top it off, each class began with a brief period of “devotions”. Because I had been brought up by parents who conducted their lives in a similar fashion, I was accustomed to this heavy religious overprint.
Figure 2 Wheaton College’s Blanchard Hall, the scene of many of my college day pranks.
student), Wheaties had only 1,600 students, so we ran into each other now and then. As will become clear, these encounters ultimately led me to a career in isotope geochemistry at Columbia University.
Although I don’t remember all that much about my three years at Wheaton, a few high points remain fixed in my mind. I was fortunate to have truly outstanding teachers in key classes. George Bate taught me basic physics. Peri-odically, he gave us what he called “bear problems.” To do them, while a struggle, for the first time in my life presented a serious challenge. Rather than coasting along, I had to dig in and think deeply. More than anything else, these problem sets turned me toward a career in science. Angelline Brandt taught my calculus class. Unheard of today, it was held at 7:30 a.m. but she made her subject live. Each morning, I eagerly jumped out of bed and went through the often frigid Illinois cold to attend her class. By the end of the year, I had a solid understanding of this important subject.
Lacking many of the outlets characteristic of college life, my free time was filled with sports and pranks. Because I never amounted to much in the former, I don’t have memories worth relating but I was a first class prankster so I will take a few paragraphs to relate a couple of my favourites. I do this because the inventiveness I pored into my college day pranks became the substance of my career as a scientist.
During the time I was at Wheaton College, its main library was housed in what was once the women’s gymnasium. The tables at which we studied faced a vertical array of stacks in which the books were stored. Sitting at a desk located just in front of this archive was a stern faced librarian. Miss Ball not only served as guardian of our collection, she also as disciplinarian of those who entered her kingdom. To say the least, she was not well liked so I decided to send her a reminder that she was not, after all, in total control. With the help of roommate Ernie, I placed an open topped box of moth balls on the floor of the highest level in the stacks directly above Miss Ball’s desk. A string attached to the bottom of the box was looped over the guard rail and then passed along the floor, out the window at the back of the stacks and down into the bushes below. We waited until Miss Ball was busy harassing a poor victim for not returning a book on time and we pulled on the string, tipping over the box and sending hundreds of moth balls raining down on Miss Ball and her desk. We continued to reel in the string until the empty box came through the window and fell to the ground. Perfect crime! Hoping to capture the perpetrator, Miss Ball sealed off the exit to the stacks, thereby trapping the students unlucky enough to be searching for books, but she had to release these innocent bystanders, when a note arrived explaining how the crime had been committed. Every time Miss Ball discovered yet another moth ball fragment, she redoubled her efforts to track down the pranksters – but she never succeeded.
“activities week”. If the theft succeeded, the slab was eventually returned to its place. During their junior year, the class of ‘52 not only succeeded in carrying off the bench but they tossed it off a bridge into a murky river. Instead of recovering it, they offered to create a replacement. Rather than obtaining another lime-stone slab, they installed a concrete bench, whose heavy base was buried several feet underground. It must have weighed over a ton. We, the class of ’53, were then faced with the challenge of removing and hiding this behemoth. Realising that this was impossible, we decided to dig a hole big enough to tip the bench over on its side but this would take hours of effort and during activities week, groups of students would be wandering about so we decided to do it during the wee hours of the Thursday preceding activities week. Sure enough, we had the campus to ourselves. Only the night watchman made his once an hour rounds. John Nuckolls (who subsequently became the Director of Lawrence Livermore National Laboratory) served as lookout and warned us of the approach of the watchman. We diggers would hide behind the growing dirt pile until he was safely past. As dawn approached, the hole was finally big enough to accommodate the bench, but try as we might, we were unable to push it over. It was stuck in what I later learned were the sticky clays deposited in a proglacial lake, so we ran and got a rope, looped it around the bench and attached one end to the ’34 Ford and the other to a second car. After initially spinning wheels, we were able to make traction and pull the bench over. With first light, the hole was filled in and the ground smoothed – no more bench.
The story didn’t end here, however. By the middle of the same morning, an enterprising senior probed the disturbed ground with a steel rod and located the missing bench. The Dean intervened and threatened to cancel activities week if the guilty parties didn’t replace the bench. Faced with this threat, we developed a plan. At that time, the foundation for a new building was being dug. We explained our dilemma to the construction boss and asked him to send over his steam shovel to retrieve the bench. He agreed and we set the time to correspond to the end of Friday’s chapel when there would be a maximum presence on campus. We joined the crowd to watch the resurrection of the senior bench and refilling of the hole. The steam shovel operator even gingerly smoothed the ground around the bench. Victory for the class of ‘53! Defeat for the class of ‘52!
also many of the faculty, awaiting their turn. The parade of confessions went on night and day for 72 hours. It made the Chicago newspapers and even attracted psychology researchers from the neighbouring University of Chicago. I was torn. Should I join the line? Certainly I had my own set of failings but would I be sincere in my confession? Or would I just be yielding to social pressure? I not only decided to opt out – but also that I would abandon Christianity – and I did, cold turkey.
Throughout my time at Wheaton, big brother, Paul Gast, took a continuing interest in me. Early in my sophomore year, he asked what I planned to do when I graduated. I was taken by surprise. “No idea” was my answer. “What about graduate school?”, he asked. I had to admit that I didn’t know anything about graduate school. He patiently explained that it was a continuation of one’s educa-tion allowing specialisaeduca-tion in a particular area, leading to a Masters and then to a PhD degree. To get him off my back, I promised to ponder my future. Each time we met, he inquired about my progress. I would blush and admit that I hadn’t made any. In November of my junior year, came a turning point. Instead of admitting no progress, based on a magazine article I had read while waiting in my dentist’s office, I told Paul that I was going to be an actuary. He was stunned. “Do you know how boring that would be?” I replied, “but I’m good at math.” A couple weeks later, I learned that my revelation had sparked Paul into action. He recom-mended me to a certain J. Lawrence Kulp, a young geochemistry professor who carried out research at Columbia University’s Lamont Geological Observatory. To my surprise, I was invited for an interview during the 1951-2 Christmas break. So I purchased a ticket on what was then known as a “non-scheduled” airline.
3.
A PIeCe oF TeFlon
Upon my arrival at Lamont (Fig. 3a), I was assigned to help out in the radiocarbon counting laboratory. In those days, there were only three or four labs in the world conducting such analyses and all used the method developed by Willard Libby, the inventor of this ever so important dating tool (Libby, 1955). Professor Kulp explained to me that the carbon in the sample to be dated was first converted to elemental carbon black. A slurry of this carbon was then spun onto the inside of a stainless steel cylinder. After drying, the cylinder was placed along side an identical blank cylinder inside what was referred to as a screen wall radiation Geiger counter. The idea was to count the electrons emitted as the result of decays of radiocarbon atoms in the sample. The older the sample was, the smaller was the number of these events. The air was then pumped out of the cylinder and replaced with a mixture of argon and ethylene gas. The cylinder was then placed in a massive iron box which served as a shield against the gamma rays emitted by radioactive sources in the surroundings, such as 40K from bricks and concrete
blocks (Fig. 3b). Also inside this shield surrounding the sample counter was a ring of permanently sealed
radia-tion detectors that acted to null the events created by the cosmic ray mesons which passed freely through the massive iron shield. Each time a meson passed through one of these guard ring counters, its electronic pulse was placed in anticoincidence with those from the sample counter. In this way, the meson induced events in the sample counter were eliminated. This was very important because the number of meson events greatly outnumbered those from radiocarbon in the sample.
In spite of these precautions, some additional “background” events not attributable to radio-carbon were recorded. These were corrected for by shifting the cylin-ders back and forth so that part of the time the cylinder containing the sample carbon faced the active counting area and part of the time the blank cylinder faced the active
Ph ot o c ou rt es y o f D ep ar tm en t o f E ar th a nd E nv iro nm en ta l S ci en ce s A rc hi ve s, C ol um bi a U ni ve rs ity .
Figure 3a Photo taken in 1953, when I
counting area. This was possible because the outer cylinder was half again as long as the combined length of the two inner cylinders. Once he had explained the princi-ples, Kulp went on to say that was where I fitted in. At 8 a.m., noon, 4 p.m. and 8 p.m., someone had to manually shift the cylinders. From 8 a.m. to noon, the counter recorded background, from noon to 4 p.m., it recorded sample plus background, from 4 p.m. to 8 p.m., background, and overnight, sample plus back-ground. That someone was to be me. Kulp hastened to point out that tilting the counter to allow the inner cylinder to shift had to be done gently because if it shifted too rapidly and smacked against the end of the chamber, the sample carbon could be dislodged and that was not to happen!
I was surprised when I encountered George Bate, my physics teacher, at Lamont that summer. He explained that he had only a Masters Degree so he had taken a leave of absence from Wheaton to be able to add a PhD to his vitae. Paul Gast was also there, preparing for his first year in grad-uate school at Columbia. Two other Wheaton graduates, Walter Eckelmann and Karl Turekian, were also doing their research toward PhD degrees under Kulp’s direction. The reason for the presence of this large Wheaton contingent became clear when I learned that Kulp was also a Wheaton College graduate. He made a point of latching on to promising science majors from his alma mater (group photo, Fig. 3c).
During a hot and very humid period in July, a serious problem developed in the counting lab. Electrical arcs occurred in the end seals of the counters causing spurious counts. The problem was associated with the Pyrex glass tubes used to insulate the high voltage centre wire from the metal housing in the coun-ters. Despite careful cleaning and handling of these tubes, the arcing persisted. Each arc triggered the device, adding an unwanted spurious pulse. Kulp’s dating program stalled but he was desperate to get results so we were urged to promptly
Ph ot o c ou rt es y o f L am on t-D oh er ty E ar th O bs er va to ry A rc hi ve s.
Figure 3b Professor J. Lawrence Kulp
solve the problem. In a corner of our cramped quarters, in a wing of what was once the Lamont family’s summer mansion, there was a small repair area. Passing by it one day, I spied a roll of Teflon insulated, high voltage wire. I cut off a piece, pulled the wire out and stripped off the orange silk wrap. I then cut two pieces of the Teflon to the length of the Pyrex tubes and trimmed the ends so that they looked nice. I then brought them to the counting lab and suggested that we give them a try as replacements for the Pyrex tubes. It was done and the problem went away. Kulp was delighted – and as it turned out, my career was launched.
Ph
ot
o c
ou
rt
es
y o
f L
am
on
t-D
oh
er
ty E
ar
th O
bs
er
va
to
ry A
rc
hi
ve
s.
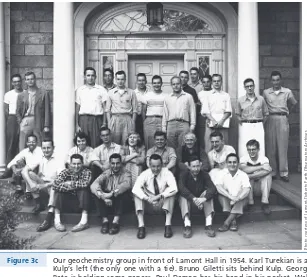
Figure 3c Our geochemistry group in front of Lamont Hall in 1954. Karl Turekian is at
Kulp’s left (the only one with a tie). Bruno Giletti sits behind Kulp. George Bate is holding some papers. Paul Damon has his hand in his pocket. Walt Eckelmann sits with his knee bent up. Paul Gast was making measurements in Washington, D.C. Where’s Waldo?
week remains until classes begin and I haven’t even applied”. Kulp replied, “No problem. Make me a list of your Wheaton courses and grades and I’ll see to it that you are admitted.” So that was that. Suddenly, thanks to Professor Kulp’s magic, I was a senior transfer student. In addition to seeing to it that Columbia accepted me, Professor Kulp awarded me a Research Assistantship, which not only paid me a modest stipend but also covered my tuition. So during my senior year, I commuted back and forth between Columbia’s main campus on Manhattan Island’s upper west side and the Lamont research campus about 15 miles away, on the other side of the Hudson River. I remember that my sense of direction was confused by the fact that the Hudson River flows almost due south. I had difficulty dispelling my intuition that east coast rivers should flow to the east.
My senior year course work was mainly in physics but I also enrolled in my first ever geology course. It was taught by a world renowned structural geologist named Walter Bucher. He had a twinkle in his eye and rambled on with a delightful German accent and as professors are known to be, he was absent minded. Our text book, “The Sequence of Layered Rocks” by Robert Shrock (Schrock, 1949) was the most boring I have ever encountered. Only with the help of Paul Gast, was I able to master the material. Both of us received a grade of B+ but when I tried to register for the second semester of Bucher’s course, I was told that as an undergraduate, I was not allowed to take his class. The rule was graduate students only, so I went to Professor Bucher and pleaded my case pointing out that I had already taken the first semester and received a respectable grade. He insisted, however, and told me that undergraduates were incapable of understanding his material. So I asked Larry (as I then called him) to intervene. He did and Bucher begrudgingly let me in. However, at the end of the semester, he proved his point by giving me a C-. Paul Gast, whom I studied with, received a B+.
In those days, it was important to be elected to the Phi Beta Kappa National Honor Society. Except for Bucher’s C-, I had close to an A average. Needless to say, I wasn’t elected. However, some 35 years later, the Columbia Chapter made me an honorary member and I received my “key”. At the induction ceremony, I was able to tell my sad tale about my C- in Structural Geology from Walter Bucher, who by then was long dead.
4.
A long Ago bARbeque
A turning point in my young career came as the result of a change in Professor Kulp’s plans. He had agreed to present a paper on radiocarbon dating at the Great Basin Archaeological Conference to be held at the Southwest Museum in Los Angeles, California. At the last minute, he decided not to go and asked me to take his place. I jumped at the opportunity and a few days later I was airborne headed west. I was greeted in LA by a record heat wave. On the day of my talk, the temperature reached 104 °F.
I listened with interest to papers dealing with the time of arrival of humans in the Americas. The speakers fell into two groups. While the contingent of university professors were convinced
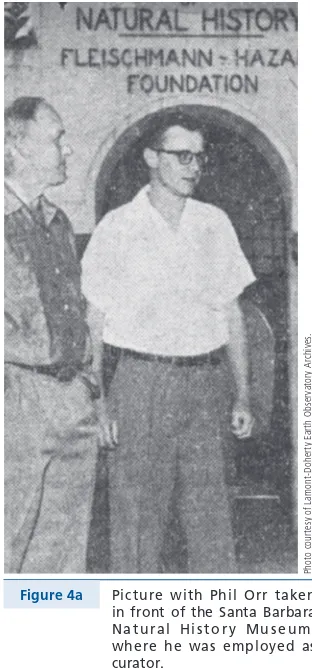
that humans first arrived in the Americas at the end of the last glacia-tion, the contingent of museum cura-tors presented evidence for a much earlier arrival. As my turn to speak approached, thoughts of my panic in my Wheaton speech class came to mind and the sweat from my palms intensified but once I got going, my fears evaporated. I knew that my grasp of radiocarbon dating exceeded that of the audience. My talk was the last in the morning session, so after a couple of questions, the audience started to file out for lunch. However, a man wearing cowboy boots and smoking a cigar butt in his curved pipe approached the podium. He intro-duced himself as Phil Orr (Fig. 4a). I distinctly remember his first words to me: “Young man, I can see that you know a lot about math and physics, but obviously you don’t know a gol darn thing about the Earth. Come with me for three weeks and I’ll change your life.” I was stunned but had the pres-ence of mind to ask where he would take me. The answer was, to dry Lake Winnemucca in Nevada and to Santa Rosa Island off the California coast.
Ph ot o c ou rt es y o f L am on t-D oh er ty E ar th O bs er va to ry A rc hi ve s.
Figure 4a Picture with Phil Orr taken
Who would pay? He would cover all my expenses. Although he didn’t say it, he clearly wanted free radiocarbon dates at a time when it was difficult to even purchase them. I was to be his ticket.
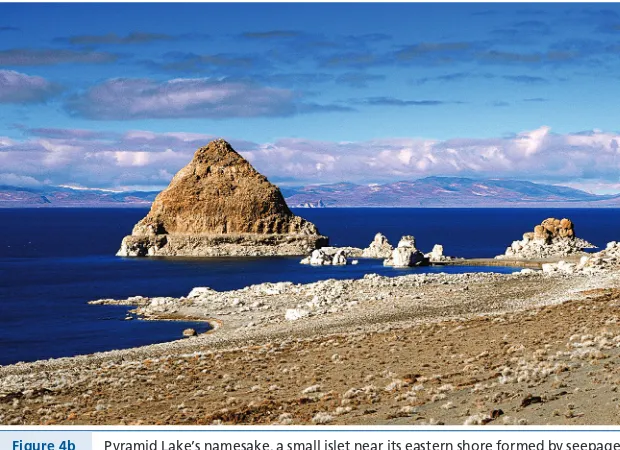
I accepted, and the next day, we were on our way in his rickety Ford station wagon. After a night in a Carson City motel, we headed for Fishbone Cave. On the way, we passed Pyramid Lake, a jewel in the desert (Fig. 4b), and then on east to its sister valley where, before the building of diversion dams along the Truckee River, there had been a lake comparable in size to Pyramid. The water that once had evaporated from Lake Winnemucca, now evaporated from desert farm land. A paved highway took us to the north end of the dry lake bed, but from there to its eastern side, we followed a very rough track. The station wagon was like a vacuum cleaner, sucking in copious amounts of dust. Along the way, we got stuck in a sandy stretch and to get out, Phil had to deflate the rear tires. Once we had escaped, he removed a spark plug and in its place, screwed in a long hose. Using engine compression, he pumped the tires back up. This, combined with the burlap water bag that hung from the front of the station wagon and supplied us with cool drinking water, I was much impressed by Phil’s desert savvy. At last, Phil parked and we climbed up to Fishbone Cave. It was about 50 feet deep and according to Orr, it had been created by wave action at a time when the lake was much larger than it had been when, during the 1850s, the first explorers arrived. One of Phil’s charges to me was to use radiocarbon dating to determine when the Winnemucca watershed last occupied the cave.
Figure 4b Pyramid Lake’s namesake, a small islet near its eastern shore formed by seepage
Phil’s primary interest in this cave was its archaeological record. It had been occupied by palaeo Indians on and off for at least 8,000 years. I obtained a
14C date of 7830 ± 350 years on fragments of netting from the lowest habitation
level (Broecker and Orr, 1958; Broecker et al., 1960c).As a budding geologist, my interest was in the history of the lake itself. Desert lakes, such as Pyramid and Winnemucca, often occupy closed basins, i.e. they have no outlet to the ocean. Hence, the water that enters them from rivers and direct precipitation must be lost by evaporation. Thus, at times of increased rainfall, for evaporation to match input, the lakes would have become larger. I asked Phil where we could get samples for 14C dating representing the time when the lake reached its maximum
size. He told me about tufa, the calcium carbonate deposited by algae, and recom-mended that we go to the top of Anaho Island in Pyramid Lake to collect samples. So, a couple of days later, one of the fisheries people ferried us out to the island. We climbed to near the top and found rock outcrops coated with beige coloured tufa several inches thick. With this experience, I began a continuing quest to understand the history of the climate changes that altered the hydrologic balance in the lakes in what is known as the Great Basin. It turns out that 56 years after collecting this first sample, I am busy using the histories of these and other of the world’s closed basin lakes to aid in predicting how the distribution of precipitation is likely to change as the world is warmed by the build up of CO2 released from
fossil fuel. More will be said about this in a subsequent section.
After a week of collecting samples in the Pyramid–Winnemucca area, we drove back to the coast, this time to Santa Barbara, where Phil was employed as a curator in the Natural History Museum. A small oceanographic vessel from Scripps Institution for Oceanography awaited us. We boarded and were off on the second leg of my geological education. Our destination was Santa Rosa, one of a series of Channel Islands located off the coast of California. We arrived at a dock associated with a small naval base and were taken by jeep to the home of the island’s owner, Al Vale. It turns out that Phil Orr had exclusive archaeological access to the island. Vale operated a cattle ranch but Santa Rosa is a very dry place, so it could support only a small number of animals. The sole human occupants were a few ranch hands and the small staff at the navy base. Otherwise, the only inhabitants, other than the cattle, were wild boars left behind by the Spanish conquistadors and endemic foxes the size of house cats. Once again, Phil’s interest lay in the archaeological remains and especially those left by early man. During a previous trip, he had found a human arm bone on which I subsequently did a radiocarbon date. Phil was disappointed that my result of 10,700 14C years was
not as old as he had hoped. Rather than pushing back the arrival of man in the Americas, it matched that for other early sites. It did, however, raise the question as to how those early human arrivals were able to cross 30 miles of often quite rough seas.
was in these exposures that Phil and I searched for radiocarbon datable material and signs of human occupation. After many hours of looking at walls of brown, largely featureless silt, I spotted some large bones sticking out of one of the arroyo walls. I yelled for Phil to come and have a look. When he arrived, he whooped “You’ve found the leg bones of a dwarf mammoth.” He explained that like the foxes, most animals isolated on islands evolve to smaller sizes. Soon he got even more excited when he spotted rib bones that had the appearance of being charred. While the leg bones were glistening white, the rib bones were a dull black. Phil’s excitement stemmed from his thought that the mammoth had been killed by man who then barbequed its ribs. This idea seemed to fit but when my radiocarbon date came out 29,500 years, the credibility of this interpretation became highly questionable because no other evidence for human occupation of the Americas dating even half this age had been found. As Phil promised, this trip changed my life. Many of my laboratory oriented contemporaries paid only scant attention to field observations. Phil taught me their value. So unlike many of my colleagues, I learned to put together apples and oranges, i.e. field and laboratory observa-tions. Because of experience in both domains, I could often push ahead faster than others so I place Phil Orr beside Paul Gast and Larry Kulp as people who played key roles in my development as a scientist.
5.
eSPIonAge
During my first year at Lamont, Professor Kulp got the idea that we should see if we could detect one of the A bomb fission products that remained airborne instead of being purged by rainfall. In particular, he focused on an isotope of the inert gas krypton, 85Kr, with a half life of about 10 years. Much of that produced
by the Alamogordo, Hiroshima and Nagasaki A bombs (Fig. 5) would not yet have undergone radio decay. Further, during the seven or so years that had elapsed since these explosions took place, the 85Kr would have become well mixed
throughout the atmosphere. Based on the published equivalent TNT tonnage of these three explosions and the fission yield of 85Kr, Kulp calculated that each
litre of krypton gas should contain enough 85Kr to produce about 10 radioactive
decay events per minute in the counters we used for 14C dating. So we purchased
a litre of krypton from Linde Air Reduction in Buffalo, New York and I mixed it with ethylene as the filling gas for our 14C counter. We were amazed when we
Figure 5 Picture of the mushroom shaped cloud created by an above ground atomic bomb test.
The same afternoon, back at Lamont, two men in suits and ties asked to see me. They flashed badges and announced that they were from the FBI. “Are you the kid who made 85Kr measurements?” I fessed up. “Well, tear up your notes
and never say a word to anyone about what you did. And never again conduct such measurements!” It took us some months to figure out why the fuss. Finally, we got the answer. We had stumbled on an espionage scheme. There was at that time great concern that the Soviet Union was close to succeeding in creating its own nuclear weapons. To do this, they had to make plutonium. This required a nuclear reactor in which controlled fission of 235U took place, which released
free neutrons that reacted with 238U to upgrade it to plutonium – and of course,
these fissions would also produce 85Kr. When the fuel rods were processed to
recover the plutonium, the 85Kr would escape to the atmosphere and join that
produced by the US and British allies. Tony Turkevich, a physicist at the University of Chicago, realised that if we could accurately inventory the atmosphere’s 85Kr
burden and subtract from it that produced by the allies, then any excess would provide a measure of Soviet plutonium production. Because I knew the facts and had been sworn to secrecy, I was subsequently invited to Argonne National Labo-ratory in Naperville, Illinois, to observe how they did the 85Kr measurements.
free to take it back to Lamont. It turned out to be very valuable because soon after my return, we set out to switch from black carbon to carbon dioxide for our
14C measurements.
6.
ASCARITe
One of the research projects that was being conducted by Kulp involved meas-uring the amount of radiocarbon in the dissolved inorganic carbon (CO2 +
HCO3- + CO32-) contained in seawater. The primary objective was to
deter-mine the water renewal rate in the deep Atlantic Ocean. This was to be done by comparing the 14C to total C ratio in deep water with that in surface waters. The
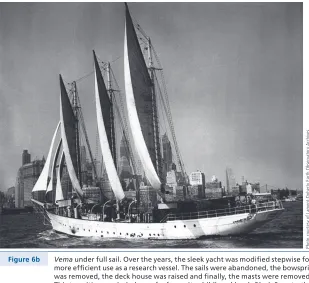
difference between these ratios could be converted to an isolation time. Assuming that the renewal rate had remained the same, this age could be converted to the renewal flux. We now know that this flux is about equal to the annual rainfall over the entire globe (i.e. 15 million cubic metres per second)! However, in the early 1950s, this flux was poorly constrained. Obtaining the 50 gallons of water required to get enough carbon for the measurement presented a challenge. Maurice Ewing, Lamont’s Director, joined Kulp in this enterprise. He supervised the construction of the first large volume water sampler from an oil drum and a ship’s porthole. On the way down, the porthole was propped open, allowing the barrel to be flushed. Once at the desired depth, a messenger weight was sent down the wire triggering a release that allowed a stretched elastic cord to pull the porthole shut. Subsequent genera-tions of this device manufactured in Lamont’s machine shop, although sleeker, were patterned after Ewing’s original design (Fig. 6a). Because it was impractical to store these large samples of water onboard the research vessel, Vema (Fig. 6b), the carbon was
Ph ot o c re di t: T re ve J oh ns on P ho to gr ap hy .
Figure 6a A Gerard barrel used to collect
extracted at sea by circulating air in a closed loop through the acidified seawater. Acid was added to convert HCO3- and CO32- ions to CO2 gas. The CO2 gas was
removed by circulating the air around and around through a commercial solid absorbent called ascarite. Then small bottles containing the ascarite were shipped back to Lamont for the radiocarbon analyses.
Ph
ot
o c
ou
rt
es
y o
f L
am
on
t-D
oh
er
ty E
ar
th O
bs
er
va
to
ry A
rc
hi
ve
s.
Figure 6b Vema under full sail. Over the years, the sleek yacht was modified stepwise for
more efficient use as a research vessel. The sails were abandoned, the bowsprit was removed, the deck house was raised and finally, the masts were removed. This transition reminded me of a favourite childhood book Black Beauty, the story of a beautiful horse who fell on bad times.
ran frequent blanks (in other words, carbon black prepared from radiocarbon free material such as ancient coal or limestone). I noticed that now and then the blank carbon yielded more counts than its companion blank cylinder. This stopped us dead in our tracks. Finally, we realised that the source of these extra counts was radioactive fallout from above ground nuclear testing that was being conducted at the faraway Nevada Test Site. Our carbon black was very absorbent so as it dried, it would pick up particulates from the air, including small traces of bomb test fission products.
At that time, there were reports that several labs were switching from measuring carbon black to measuring carbon in a gaseous form. Hans Suess, who directed the U.S. Geological Survey laboratory in Washington, D.C., converted the carbon in his samples to acetylene gas (C2H2). Realising we had to abandon
the carbon black method, Kulp arranged for us to visit Suess to see how he gener-ated acetylene. Soon after our arrival, Kulp excused himself to go to the men’s room. Left alone with this famous Austrian scientist, I couldn’t think of anything to say so I was relieved when he broke the silence. “Young man, too many of our best scientists are lost because they become administrators. It is a one way street; there is no return. You must in your career guard against this fate.” I asked, “How does one do this?” The reply was, “be a dynamic incompetent and no one will ask you to become an administrator!” Not knowing what a dynamic incompetent was, I asked. Suess replied, “at least three outrageous acts each year.” I took this advice and have lived by it. Except for a three year term as rotating chair person of our academic department, I have escaped administrative duty.
As it turns out, we did not switch to acetylene. Back to back visits by Hessel de Vries, the boss of a 14C lab in Groningen, Holland and by Gordon Ferguson
from New Zealand convinced us that carbon dioxide was a better choice. Further, an attempt by Chuck Tucek, a chemist in our lab, to duplicate the Suess C2H2
synthesis led to a nasty explosion which singed his eyebrows. CO2 generation
posed no such threat.
At this time, in 1953, plans to build a building for geochemical research were firming up so it was decided that we would limp along with black carbon until a CO2 lab had been set up in this new facility. I was given the task of
designing the lab. The building opened in October 1954, and several months later, the CO2 lab was up and running. One of the first things I did was to check
out one of the assumptions Kulp had made regarding the use of ascarite. He was aware that ascarite contained a significant amount of absorbed CO2 so for every
bottle that was sent to sea he had an aliquot analysed for its CO2 content but
he had never measured the 14C to C ratio in this CO
2. He was convinced that its
source must be the CO2 in ambient air and correspondingly corrected the
radio-carbon measurements. Concerned that this might not be the case, I took 8 bottles of fresh ascarite and obtained enough CO2 for a radiocarbon measurement. I
was shocked to find that instead of having the amount of radiocarbon equal to that in air, it had none at all. The upshot was that instead of raising the 14C to
contained in the ascarite decreased it. So, instead of making the apparent age of deep Atlantic water older, the ascarite correction made it younger. When the proper correction was made, the deep water age came out to be only a couple of hundred years, instead of many hundreds of years. Hence it lay within range expected by oceanographers.
When I learned this, Kulp was away on vacation and hence out of contact. A few days later, Ewing called me in for an update on this project so I had to tell him about my finding. When Kulp returned two weeks later, I urged his secretary to make sure that I spoke with him. She promised to try but said that he was fearfully busy catching up from his absence and getting ready to go to Mexico City for the Geological Society of America (GSA) meeting. Finally, on the day before he left, he stopped by the lab looking harried. “So, what’s so important?” he asked. I explained about the ascarite correction. He said “I can’t believe it. You should do it again.” I was about to say, “but Larry, there is simply no way that the CO2 in ascarite has the 14C content of today’s atmospheric CO2.” However,
he was on his way out the door and that was the end of our brief conversation. A week later, I got another call to appear before Ewing. “Why the hell,” he shouted, “didn’t you tell Kulp?” I explained that I had. Ewing then told me that Kulp had, in his GSA talk, presented the same old results with no caveats or mention of the change in the ascarite correction. This incident deepened an already sizable rift between Ewing and Kulp. Years later, it would lead to a similar rift between Ewing and me.
7.
TeRMInATIonS
Part of my PhD thesis research dealt with radiocarbon dating of records extending back to the time of the last glacial maximum. Included were: the record of sea level contained in the sediments of the Mississippi River delta, the record of the reappearance of the planktonic foraminifera, G. menardii, in the Atlantic after an absence during glacial time and the record of the fluctuations in area of Nevada’s closed basin, Lake Lahontan. In all three of these records, I noted that a marked transition from glacial to interglacial conditions occurred close to 11,000 14C
years ago. This finding was reported in a paper entitled “Evidence for an Abrupt Change in Climate Close to 11,000 Years Ago,” published in 1960 (Broecker et al., 1960a). It was coauthored with Lamont Director, Maurice Ewing.
Time would tell that even though I had put my finger on something very important, the evidence was flawed. Twenty years later, Glen Jones, a scientist at Woods Hole, showed that G. menardii didn’t reappear in the Atlantic until about 6,800 years ago. Although in many Atlantic sediment cores, G. menardii shells first appeared in sediment whose age was close to 11,000 years, these shells had
14C age of 6,800 years. Fortuitously, bioturbation had mixed them down to this
highest shoreline were later shown to be too young, because of the incorpora-tion of secondary calcite. The correct date placed them at 13,500 14C years, or
just before the onset of the profound Bølling Allerød warming. Finally, at the time, I failed to recognise that the Younger Dryas lapse back into cold conditions complicated the transition.
A decade later, in 1970, together with graduate student, Jon Van Donk, I made a point that the 18O to 16O ratio transitions marking the ends of each glacial
cycle were quite abrupt (Fig. 7). We called these sharp transitions “Terminations” and numbered them I, II, III and so on, going back in time (Broecker and Donk, 1970). However, even then, we did not appreciate the complication posed by the Younger Dryas relapse into cold conditions. The reason was that the 18O records
available at that time were all from sediments that accumulated at rates of a few centimetres per thousand years. As a result of stirring by worms to depths of 6 to 10 cm, core top radiocarbon ages ranged from 3 to 4 thousand years. Because the Bølling Allerød-Younger Dryas oscillation had a duration of only about 3 thousand years (Grootes and Stuiver, 1997), its presence had been obliterated by bioturbation in these sediment cores. It was only with the publication of the Camp Century ice core record (Dansgaard et al., 1969), that the importance of the Younger Dryas became clear. Recognising terminations was one thing; explaining them was quite another. They have proven to be a thorn in the flesh for all those who have attempted to model glacial cycles. I remember the long discussion John Imbrie and I had about them in a hotel room in Atlantic City, in the early 1970s. He had become enamoured with the pacing of glacial cycles by Milankovitch orbital cycles but was stumped by the sharpness of terminations. Years later, in the 1980s, when he was leading an effort by the Specmap group, he got the idea that they occurred at times when the precession and tilt cycles came into alignment (Imbrie et al., 1992).
I remember when Andre Berger, in a Lamont seminar, presented a model study in which he claimed to have solved the problem. When questioned as to how it was that his model so nicely produced terminations, he admitted that he sprinkled a dark substance on the ice sheets, changing their albedo and hence made them melt. The failed attempts to unify cyclic Milankovitch pacing with sharp terminations continued until the discovery in ice cores that steep sided millennial temperature changes punctuated the Milankovitch cycles and that some of these events were triggered by Heinrich’s ice armadas. Jerry McManus took a big step forward when he showed that there was a Heinrich event associ-ated with each of the last five terminations (McManus et al., 1999). Clearly, ice armadas in the North Atlantic played a key role in bringing ice ages to a sharp close.
Okay, but what trig-gered the Hei n r ich events? Maureen Raymo suggested that a prereq-uisite to creating a termi-nation is the generation of a very large Northern Hemisphere ice sheet. Her evidence comes from the 18O record in benthic
fora m i n i fera wh ic h shows that terminations occur only after the 18O
enrichment in the ocean reaches a certain level, i.e. the ice caps have reached a certain size. Heinrich events, which occurred at times when the ice caps were smaller, had impacts but they did not initiate terminations.
It is my feeling that until we understand how excess CO2 was stored in
the glacial deep sea, and what triggered its release back to the atmosphere, we won’t be able to close the case. This year, a group led by my close
colleagues, George Denton and Bob Anderson, published a paper in Science that attempted to explain terminations (Denton et al., 2010). They offered me coauthorship but I declined. My reason was that their argument involved shifts in the westerly wind belt. Although not opposed to this idea, my concern is that ocean atmosphere models have not succeeded in replicating the required shifts. Further, I’m convinced that the ocean could have done the job by itself. They got a bit closer to the answer but I feel that, until we understand what triggers Hein-rich events and why, in the presence of large ice sheets, these events can in turn trigger a release of CO2 from the ocean, we can’t close the book on terminations.
It’s been forty years since I coined the term, “terminations”. It might be another forty before we have a firm understanding of what they involve.
Figure 7 Diagram showing the 18O to 16O ratio record
8.
CoRnbReAd
And The deACon
I received my PhD degree from Columbia in 1958. Unlike several of Maurice Ewing’s geophysicists, who put in 5 to 10 years on the Lamont research staff before being offered a faculty position, once again Kulp performed his magic and, upon graduation, I was granted an assistant professorship in Columbia University’s Department of Geology. Nothing occurred during my first few years on the job that stands out in my memory so I’ll skip to 1962. Early in that year, John Imbrie, a fellow faculty member, asked me if I would like to join his group doing field research in the Bahamas. He had rented a house on Fraser’s Hog Key from Dr. Leroy Talcott, a young Miami surgeon. It was to serve as Imbrie’s base of operation. He had also chartered a small vessel from the Lerner Marine Laboratory on the island of Bimini. Never having done any field work involving the ocean, I conferred with Taro Takahashi, once a fellow graduate student who was at that time teaching at New York State College of Ceramics in Alfred, New York. In 1958, during the IGY (International Geophysical Year), he had spent 9 months on Lamont’s ocean going research vessel, Vema, measuring the partial pressure of CO2 in surface water. He agreed to join me and together we developed
a plan. I would take the lead in one project which involved measuring the radon gas content of the shallow bank water with an eye toward establishing the rate of gas transfer across the air-sea interface. Taro would direct a second project to establish the rate of CaCO3 deposition on the Bahama shallow banks and its
dependence on the degree of supersaturation.
The expedition was launched from Miami. Imbrie and two of his graduate students would go across the Florida Straits to Bimini aboard a World War II landing craft (i.e. a Landing Ship Tank, LST) owned by Miami Marine. Taro and I would fly to Bimini and join them. When we arrived, we fully expected the Imbrie group to be there but they were not, nor did the port authorities know their whereabouts. We waited ‘til midnight – still no Imbrie – so, we retired to our motel room. The next thing I remember was Imbrie shaking me and yelling in my ear, “Wally, get up and rinse this radio in fresh water.” It turns out that they had quite a voyage. After a delayed start from Miami, they had an uneventful trip across the straits. As they approached Bimini, they called in to report their arrival. However, because of engine noise, the Bimini authorities couldn’t hear them so they cut the engine and were able to make their radio report but then the trouble began. The battery was too weak to restart the engine. The mighty Gulf Stream took hold and carried the LST rapidly northward. Night fell. A storm raged. They bailed and they prayed that their iron tub wouldn’t swamp and sink like a rock. Finally, their salvation appeared in the form of a huge freighter. Using a flashlight, Imbrie sent an SOS.
It was decided that Taro and I should fly across the banks to join Ross Horowitz, our technician, who was already there setting up our lab. The Imbrie group would stay behind and test their shallow water coring device to be deployed from the open door of the LST, but that’s another story! I’ll never forget that as the sea plane taxied up to the Fraser’s Hog Key dock, we saw Ross jumping up and down like a banshee. Has he gone mad? When we stepped onto the dock, we realised why Ross was so animated. It was swarming with mosquitoes. After shaking hands, we all ran to the Talcott house and slammed the door. Ross sprayed us with RAID to kill any of the mosquitoes that came in with us. We were amazed to find that Ross had converted Talcott’s hideaway into a laboratory. Radon extraction boards, alpha counters, liquid air, vacuum pumps, infra red analysers and so on filled the living room and one of the bedrooms.
The next day, the small sea plane returned. It was to serve as our water sampling platform. We loaded it with 20 litre evacuated glass bottles that we had purchased from a spring water company. I took the copilot seat and off we went out over the huge Grand Bahama Bank. I would point out a place to land and once we had coasted to a stop and the pilot had opened the cabin door, I would jump into the water. Then he would lower one of the bottles in its wooden crate and I popped the valve allowing seawater to be sucked in. The pilot then hauled the filled bottle (and me) back into the plane. Fortunately, as the plane landed on its belly rather than on pontoons, the cabin door was only a foot or so above the water.
We repeated this at five more locations and then headed back to Talcott’s dock. The whole operation took only two hours. Enduring the myriad of mosqui-toes, we hauled the bottles inside and started extracting the radon. This involved circulating helium gas round and round and freezing out the extracted radon in a trap cooled with liquid nitrogen. Once captured, the radon was transferred to a small cell that was coated inside with phosphor. Each alpha particle, shot out from a decaying radon atom and from radon’s short lived daughter products, made a flash of light when it hit the phosphor and the flashes were recorded by a phototube.
To our amazement, we obtained more pulses than expected. Our idea was that some of the radon atoms produced in the water by the decay of its parent radium (226Ra) would have escaped to the overlying air. Hence, the radioactivity
of radon in our samples was expected to be less than that of the radium dissolved in the water. Because radon has a half life of only 3.65 days, if the half time for escape to the atmosphere were, for example, also 3.65 days, then half of the radon would be lost and half would undergo radioactive decay in the water. The problem with our Bahamas measurements was that the radon content proved to be greater than that expected if none were lost to the atmosphere.
it by submerging one of our evacuated bottles in the shallow waters just off Talcott’s dock and plunging an attached intake tube (equipped with a frit) into the carbonate sediment. We opened the valve and sediment pore water was sucked into the bottle, while the frit kept out the sediment. We processed this water in the same way as we had the bank water and soon had transferred the radon into the counting cell. We then turned on the counter. Instead of the ten or so events per minute produced by bank water samples, we got many hundreds. This, despite the fact that we had only filled the sampling bottle to about one tenth its capacity. Clearly, much of radon produced by the decay of the radium contained in the sediment was escaping into the surrounding pore water (Broecker, 1965).
So unfortunately, we had to terminate our gas exchange experiment but by serendipity, this finding led to much bigger game. In the open ocean, we could take advantage of the copious amounts of radon leaking out of the abyssal sediment by measuring its vertical distribution in the overlying water column. In this way, we could establish the rate of vertical mixing in the deep ocean. A decade later, in the 1970s, we made hundreds of measurements on water samples taken in the deep ocean in the zone extending 50 or so metres above the sea floor. This was done in connection with the global GEOSECS survey described in more detail, below.
Fortunately, the second project awaited us. It involved making traverses across the 40 mile wide Grand Bahama Bank. We had agreed to share the use of the Lerner Lab research vessel with the Imbrie team. Our time slot was scheduled to begin two days after our radon project came to its abrupt end. With the help of the Deacon, who captained the vessel, and his lone crew member, Cornbread (both native Bahamians), Taro, Ross and I loaded our gear and off we chugged. I say chugged because we were towing an intake pump that supplied a steady stream of water for our underway CO2 partial pressure measurements. We had
to keep the speed down to three knots in order to prevent the intake pump from popping out of the water.
Our plan was to measure five properties of the bank water: temperature (T), salinity (S), CO2 partial pressure (Pco2), total dissolved inorganic carbon
content (SCO2) and the 14C to C ratio in the dissolved inorganic carbon. Based
on the salinity, we could calculate the calcium (Ca2+) content. The Pco
2 and SCO2
(together with T and S) allowed Taro to calculate the CO32- ion content of the
water. The product of the concentrations of Ca2+ and CO
32- yielded a measure of
the extent of supersaturation and hence, of the drive for CaCO3 to precipitate. We
knew from published surveys, that as a result of intense summer evaporation, the salinity of the bank water increased from its western side, which was open to the Florida Straits, to Andros Island, which formed its closed eastern boundary. This increase was important to us because it led to an increase in the concentration product ([Ca2+] x [CO
32-]) and hence, the tendency to precipitate CaCO3. Although
approximate and there was no way to correct for salinity decreases produced by rain storms. Therefore, we decided a better approach was to use the across bank increase in 14C to C ratio.
To do this, we would take advantage of what I refer to as John Nuckoll’s gift to environmental science. As you remember, John was a fellow Wheaton student who helped with the burial of the senior’s bench. Along with Paul Gast, George Bate and me, John came to Columbia for graduate school but instead of joining us in geology, John went into physics. After his first year, he disap-peared. Only years later, did I learn that he had been recruited by Edward Teller at Livermore National Laboratory. When we finally met again, Nuckolls told me that he was the primary architect of our first hydrogen bomb. He even admitted that he had peeked from under a lead blanket to watch his “baby” go off on the far side of Eniwetok Atoll. Although, thank heavens, hydrogen bombs were never used for their primary purpose, during H bomb tests, collisions between the stray neutrons and atmospheric nitrogen nuclei temporarily nearly doubled the amount of 14C in the atmosphere’s CO2. The passage of these extra 14C tagged
CO2 molecules into the ocean and into the terrestrial biosphere constitutes an
invaluable environmental tracer.
Taro and I took advantage of this tracer by measuring the across Bahama Bank increase in the 14C to C ratio in the dissolved inorganic carbon. This worked
because the bank water was only 16 metres deep in contrast to the open ocean where the Nuckolls’ 14C was stirred to depths averaging several hundred metres.
Hence, the extent of dilution of this extra 14C on the banks was far smaller. The
longer the water remained, the higher its 14C to C ratio became (Fig. 8, Broecker
and Takahashi, 1966).
Unlike the radon strategy, which had backfired, our survey of the bank water yielded very nice results about the rate of CaCO3formation and its
depend-ence on the product of Ca2+and CO32-ion concentration. Years later, I went back
to this study when questions arose regarding the impact of fossil fuel derived CO2
on calcification by marine organisms. The fossil fuel CO2taken up by the ocean
would decrease its CO32- concentration and thus impede calcification. Although
our CaCO3study went well, we did experience a navigation problem. Our traverse
from Fraser’s Hog Key back across the bank took about a day and a half and the return trip another day and a half. During this time we saw no land, so we had only a rough idea where we were.
page because we had seen this word on our chart. It denoted a series of under-water dunes. Clearly, we had struck on the crests of two of them. This placed us well to the south of our planned course. The Deacon promptly turned the research vessel around and gingerly retreated from danger. We decided to call off any remaining research objectives and to proceed back to Fraser’s Hog Key. Not having heard from us for three days, Imbrie was in a dither. He was relieved to see us arrive safely at Talcott’s dock.
Figure 8 Map of Great Bahama Bank showing the locations at which measurements were
9.
WhITIngS
During my flight to obtain water samples for our radon measurements, I was struck by the white streaks in the bank water (Fig. 9). I asked the pilot what it was. He replied, “It’s a whiting”. When I asked what he meant, he said that it was made up of tiny calcium carbonate crystals which had spontaneously precipitated from the bank water. When we
got back to New York, I asked around and found that there were two schools of thought regarding the origin of whitings. One school agreed with the pilot that they were sponta-neous precipitates and the other viewed them as sediment stirred up from the bottom.
Intrigued by the results of the summer of 1962’s survey, Taro and I decided to repeat it during the summer of 1963. As a result of an international treaty banning above ground nuclear tests, which was to take effect on January 1, 1963, Russia, Great Britain and the U.S.
each tested huge H bombs in the closing weeks of 1962. While we knew that the 14C produced by these tests had been carried up into the stratosphere, we
also knew that much of it would be transferred down to the troposphere during the late spring of 1963. This would make the task of determining the isolation time of water on the Grand Bahama Bank much easier so we chartered the Lord Raleigh, a Miami Marine vessel and headed across the Florida Straits. Because of our interest in whitings, we brought along a continuous centrifuge. Our hope was that we would encounter a whiting and pass enough water through the centrifuge to recover about 30 grams of the suspended CaCO3 (i.e. the amount required for
a radiocarbon analysis). If formed by spontaneous crystallisation, the 14C to C
ratio in this CaCO3 would be equal to that in the bank water’s dissolved inorganic
carbon. On the other hand, if it was stirred up sediment, it would have a 14C to C
Ph
ot
o c
ou
rt
es
y o
f N
A
SA
.
Figure 9 Air photograph showing numerous whitings in
ratio equal to that in the top most sediment. The measurements made on samples from the previous summer showed that these two ratios were quite different so we would be able to make a clear distinction between the two hypotheses.
Fortunately, we did encounter a whiting. Before stopping to do the centri-fuging, Taro suggested that we do a couple of traverses across the whiting in order to measure the contrast in the partial pressure of CO2 between the water in the
whiting and that outside the whiting. He explained to me that if CaCO3
precipi-tation was occurring, it would raise the CO2 content of the water
(counterintui-tive, but true). On the other hand, if the CaCO3 was stirred up from the bottom,
then there would be no difference. Of course, there was a third possibility; the stirred up crystals might serve as nuclei for further CaCO3 precipitation. In this
case, there would also be an increase in the CO2 content of the whiting water.
Taro found no significant difference between the CO2 content of water in the
whiting and that outside, so he predicted that the 14C to C ratio in the CaCO 3
we recovered by centrifuging the whiting water would be identical to that in the underlying sediment. Months later, when we completed the 14C measurement,
it turned out that Taro was correct. The CaCO3 was stirred up from the bottom
(Broecker and Takahashi, 1966).
Decades later, I learned that despite our efforts, the debate still raged. The people involved had either forgotten or disregarded our publication. The argu-ment was fed by the failure to come up with a believable mechanism for creating the sediment suspension. Faced with this, I put on my thinking cap. I remem-bered that Captain George of the Lord Raleigh had forbidden scuba dives into the whiting. “They’re loaded with lemon sharks.” In answer to my inquiry as to why they might be there, I was told that while fish in the whitings were blind (as are airplane pilots in clouds), the sharks used electric sensors to locate the fish. I took this one step further and proposed that it was the sharks that stirred up the sedi-ment. Just as spiders spin webs to catch insects, the sharks stirred up sediment to catch fish but, as far as I know, there are still no converts to this explanation.
10.
The Mono MySTeRy
My first trip to Nevada’s closed basin lakes was not my last. Many more were to follow. Nor did my association with Phil Orr come to an end after that ever so important three week training trip. During the summers that followed, I made trips west to join Phil for the collection of more samples for 14C dating. We
expanded the scope of our investigations from Lake Lahontan, the glacial age predecessor of Pyramid and Walker Lakes to Lake Bonneville, the glacial age predecessor of Utah’s Great Salt Lake(Broecker and Orr, 1958; Broecker et al., 1960c). I decided that in addition to dating tufa and shells found on the shorelines of these once expanded lakes, I needed to determine the offset between the 14C to
refer to this offset as the reservoir correction. It must be applied to radiocarbon ages on materials whose carbon was derived from the SCO2 in water as opposed
to atmospheric CO2. Because this correction differs from one water body to the
next, it has to be measured in each so in 1957, I set out to do this for three of the Great Basin Lakes, Pyramid and Walker (remnants of glacial age Lake Lahontan) and Mono Lake (Fig. 10a; Broecker and Walton, 1959). I was aware that these lakes had higher dissolved inorganic carbon content than the ocean so I decided that I needed only 10 gallons of water. Phil and I used a bucket to fill a tank of this size with water obtained from a convenient beach and then transported it to our motel. There, we hooked up a system for recirculating air. In this case, we used liquid potassium hydroxide (KOH) instead of solid ascarite as the absorbent. The advantage was that KOH could be purified, avoiding the bothersome ascarite blank correction. Once set up, we added acid to the lake water and turned on the air circulation pump. All went well for the Pyramid and Walker samples but not for the sample from Mono Lake.
Ph
ot
o c
ou
rt
es
y o
f N
A
SA
.
Figure 10a Mono Lake sits immediately to the east of the steep front of California’s