ISSN 2324-805X E-ISSN 2324-8068 Published by Redfame Publishing URL: http://jets.redfame.com
Developing a Scale on “Factors Regarding Curriculum Alignment”
Erdal Bay
Correspondence: Erdal Bay, Department of Curriculum and Instruction, Gaziantep University, Üniversite Bulvarı 27310 Şehitkamil - Gaziantep, Türkiye
Received: January 15, 2016 Accepted: January 28, 2016 Online Published: February 19, 2016 doi:10.11114/jets.v4i5.1305 URL: http://dx.doi.org/10.11114/jets.v4i5.1305
Abstract
“Curriculum alignment” is the compatibility between a country’s centralized curriculum determined by the ministry of education and what teachers do during the teaching process. However, it is observed that teachers do not exactly implement the curriculum. The purpose of this study is to develop a scale that will determine the factors that influence the curriculum alignment. Validity and reliability analyses were carried out to improve the scale. A draft of the scale consisting of 76 items at the end of interviews and literature review was conducted to 573 teachers working in primary and secondary schools. The first sample size was found suitable in terms of such analyses as correlation, anti-image values, linearity, normality and reliability. On a further phase, exploratory factor analysis was carried out for validity examination. After the analyses, a four-dimension-structure that explained 49.5% of the total variance was carried out. The ranges of the items varied from .35 to .62 and the factor loads varied from .450 to .767. At the a-end of the analysis, the four dimensions were called “teacher, curriculum, education system, and school. A scientifically significant correlation was calculated among variables. The general reliability co-efficiency of the scale was calculated as .94. As a result, it can be said that this scale is efficiently valid and reliable enough to determine the factors that influence curriculum alignment.
Keywords: curriculum, compatibility, scale, correlation 1. Introduction
1.1 Curriculum Alignment
Within the literature, curriculum alignment generally used with such collocations of terms as “curriculum fidelity, curriculum alignment, coherent curriculum, and etc.” “Curriculum alignment” is defined as the compatibility between a country’s central curriculum determined by the ministry of education and what teachers do during the teaching process (Furtak, Ruiz-Primo, Shemwell, Ayala, Brandon, Shavelson and Yin, 2008; Bümen, Çakar and Yıldız, 2014). Pence et al. (2008:332) similarly define the term as “the application of a curriculum or an innovation by teachers in the way curriculum development experts design”. Ananda (2003:1) states that compatibility should be complementary for educational standards, assessment, and other constituents of the system, and have a collaboration to assess student learning effectively. In short, curriculum alignment is carrying out a curriculum in accordance with the designed form as the stakeholders (practitioners). Just as a vehicle operates thanks to the compatibility of all its parts, curriculum alignment can be explained with coherent operation of desired products during educational processes.
According to many studies (Webb, 1997; Aviles, 2001; Edglossary, 2014; Elsworth, 2014), there are two types of curriculum alignment as “vertical” and “horizontal”. Horizontal compatibility is defined as the match of course content with the teaching content (Aviles 2001). It can also be defined as the alignment of a designed curriculum and the practices teachers hold and the assessment they make. On the other hand, vertical compatibility is defined as the planning and application of a series of curricula from kindergarten to further twelve grades (Bergman et al., 1998). There are publications in the literature referring to the type of the curriculum as “intended curriculum”, “planned (designed) curriculum”, “transmitted curriculum” depending on the characteristics of curricula (Kurz, Elliot, Wehby and Smithson, 2010; Burti Jr., 2010). There are still other publications that defining these with different significance or naming with different terms as “written, taught, assessed, and etc” (Glatthorn & Jailall, 2009; Burti Jr., 2010; Christensen, 2014; Wilson, 2015).
1.2 Aspects of Curriculum Alignment
Journal of Education and Training Studies Vol. 4, No. 5; May 2016
theoretical education standards (Evans, 2014). It is stated that curriculum alignment is a very strong factor in school development and refers to a compatibility among all components of school curriculum –namely curriculum objectives, curriculum (teaching and using materials), and use of tests in assessment- (Crowell & Tissot, 1986). It can also be observed from the literature that in order to ensure standardization at a certain extent, the necessity and importance of compatibility between the curriculum designed by ministry of education for public and private school and the curriculum carried out by teachers at these schools (Crowell & Tissot, 1986; Webb, 1997; Armstrong & Suddards, 1999; Anderson, 2002; Bhola, İmpara and Buckendahl, 2003; Olson, 2003; Webb, 2007; Kopera-Frye, Mahaffy and Svare, 2008; Vasquez, 2014). According to Vartuli and Rohs (2009), compatibility to an educational curriculum is a desired component of assessment, practice, and quality of research. According to Elsworth (2014), likewise, the provision of curriculum alignment can both improve the quality of education and academic achievement, and may reduce the effects of factors such as socioeconomic status and gender inequalities that have a significant role in academic performance during the teaching process. It is mostly entitled as one of the most powerful strategy to improve student achievement (Villarreal, 2001; Glatthorn, 1999; Kercheval & Newbill, 2001; McGehee & Griffith, 2001; Villarreal, 2001; Ybarra & Hollingsworth, 2001; Supovitz & Christman, 2003; Squires, 2005; Squires, 2009; Squires, 2012).
It is emphasized that there are factors that influence curriculum alignment directly or indirectly, and positively or negatively. According to Bümen et al. (2014), these factors are listed as: the characteristics of a teacher, curriculum, teacher education, institutional characteristics, regional social-economic-cultural characteristics, future-determining tests, changes, complexity and education systems.
There are studies (Çobanoğlu, 2011; Kasapoğlu, 2010; Fullan, 2005) which claim that curricula are modified by teachers on their own request or depending on the characteristics of the school or students; and teacher requests lead to such differences stem from teacher beliefs and approaches. Similarly, Gwimbi & Monk (2003) assert that school conditions and facilities affect teachers’ decisions about teaching and their on-practice behaviors. In their studies, Caner & Tertemiz (2010) state that once the classroom door is closed, real school curriculum gets into practice and that teachers can endeavor their own beliefs and do what they have learnt. According to Öztürk (2012), in their classroom applications, teachers tend to reflect their individual preferences more broadly than what is envisaged on the annual curriculum. The author also refers to the fact that it is completely normal to differentiate between an annual curriculum and what is really carried out in classrooms. Explaining the reasons of the situation, he further asserts that unexpected situations might generally arise in education and therefore, the teacher might make certain changes on the curriculum due to some reasons derived from students and other factors.
1.3 Importance od Curriculum Alignment
Developed educational curricula are one of the key elements in the raising individuals desirable from a country's education system. There are numerous studies emphasizing the importance of curricula (Kaya, 2011; Glennerster, Kremer, Mbiti and Takavarasha, 2011; Demirel, 2012; UNESCO, 2015). Implementing curricula in the same way as they are intended is crucial to obtain expected results from education system. In order to implement curricula as they are intended, the factors affecting compatibility should carefully be analyzed and necessary measures should be taken accordingly. Some educators and administrators at all levels in various countries are said to assess and reshape to make their curricula aligned with the learning outcomes determined by their departments and government (Smith, 2014). It appears evident that there are no scales to determine the factors that affect curriculum alignment in the literature. The scale developed by this study is expected to bring significant contribution to the literature on curriculum alignment. The aim of this study is to develop a reliable and valid scale to determine the factors affecting ‘curriculum alignment’. 2. Method
This section describes the stages and data analysis in the development process of the scale. 2.1 Participants
The participants of the study consist of 1728 secondary school teachers from different branches in the central district of Adiyaman in Turkey during 2014-2015 academic year. For the actual application of the development phase of the ‘Scale for the Factors Influencing Curriculum alignment’, 573 volunteer teachers, 33% of the participants, from primary and secondary schools participated in the study.
2.2 Procedure
proposals para identified. Th the scale. The 2.3 Data Anal Exploratory fa multivariate a significantly c attain results f be explained. data more mea During the f determine the between varia explaining tot was conducted performed to d 3. Results In this section 3.1 Findings o Factor analys below. Phase One: After the pre confidence ef whole scale w was below .35 the items rang remaining 71
The analysis o skewness valu that the data a In the validat determine if th determine the
allel to expert he preliminary draft form wa lyze
factor analysis analysis techn correlated item from a large n
(Büyüköztürk aningfully and factor analysis e suitability of ables. In orde tal variance, an d to determine determine relia
n, findings obta on Validity
is technique w
paration of da fficiency level was calculated 5, "items 4, 15 ged from .35 to
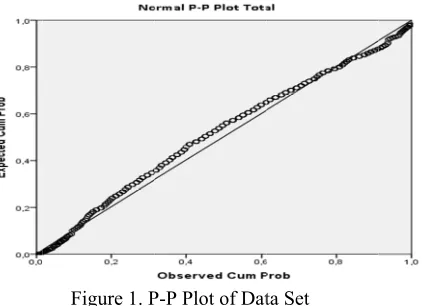
items, the P-P
of P-P plots in ue was calcula are normally di tion stage, the he sample size correlation be
opinion, items form consiste as applied to 57
was applied t nique that des ms under struc number of stru k, 2002; Özdam d in a summary
s process, Ka f the scale for er to determine nd the load of e whether there
ability co-effic
ained during th
was applied in
ata that was of the data s as .95. During , 18, 21 and 76 o .62. In the fo plot of the dat
n Figure 1 indi ated -.859 and istributed. e following fi es are suitable etween variable
s on factors re ed of 76 five-p 73 teachers wo
to determine th scribes the rel cturally related uctures (items)
mar, 2002). In y by depending aiser-Meyer-Ol factor analys e the suitability f each item on
e is a relations cient.
he developmen
n the developm
analyzed in te set was primar
g the reliability 6" were remov following phas
ta set was exam
Figure 1. P icates that the d Kurtosis 1.66
findings in the e for factor ana es were obtain
egarding teach point Likert–st orking in Adiy
he validity of lationships wh d but relativel
to definable f n other words, g on the correl lkin Measures is, and Barlett y of the scale, n the factor wa ship between f
nt of the scale a
ment process o
erms of valid rily determine y analysis pro ved from the s e, to determin mined, and the
P-P Plot of Dat distribution o 63. Since these
e Kaiser-Meye alysis, and the ned.
er, curriculum tyle items. A f yaman.
f the measurem hich are quite ly independen few significan it is a multiva ation between s of Sample t test was con
also, anti-imag as calculated. P factors on the s
are presented.
of the scale. T
dity and reliab d. Cronbach's cess, because cale. The total ne whether the e skewness and
ta Set f the data was e values are b
er-Olkin Meas e following res
m, school, and e five-point ratin
ment instrumen e difficult to nt factors. Fact nt structures (fa ariate analysis
variables. Adequacy Te nducted to det
ge values, item Pearson produ scale. Cronbac
The findings o
bility at the en alpha reliabil their correlati l scores of corr
data are norm d kurtosis valu
s found to be l etween -2 and
sures of Samp sults in the Ba
education syst ng system was
nt. Factor anal interpret, and tor analysis in factors) that ca that allows to
est was condu termine the co m variance, fac uct-moment co ch's alpha anal
obtained are p
nd of the app lity coefficien on with the to relations for th mally distribute ues were calcul
linear and norm d +2, it was co
ple Adequacy artlett's Test an
em were s used in
lysis is a d gathers ntends to n jointly o present
ucted to rrelation ctor rates rrelation lysis was presented plication, t for the tal score he rest of ed on the
lated.
mal. The oncluded
Journal of Education and Training Studies Vol. 4, No. 5; May 2016
Table 1. KMO and Barlett’s Test values
Kaiser-Meyer-Olkin Measures of Sample Adequacy Test ,924
Bartlett's Test Chi Square 19911,391
Independence 2485
P ,000
KMO value of the data in Table 1 (KMO = 0.924) appears to be convenient for factor analysis in terms of sample size. Also, the findings for Barlett’s Test are found to be scientifically significant, i.e. there are high correlations between the variables, and data is obtained from multiple normal distributions.
Another test that can be used in factor analysis is the ‘anti-image’ technique to determine whether each item is suitable for factor analysis. Anti-image values of the scale items ranged from .877 to .952. Therefore, it can be concluded that the material is suitable for factor analysis.
In the next stage, "principal components factor analysis" technique was applied to the data. The following results were obtained by applying this technique.
Table 2. Total variance exploratory percentages (a)
Component Initial Basic Values The sum of rotated square load
Total Variance % Cumulative % Total Variance % Cumulative %
1 17,602 24,791 24,791 17,602 24,791 24,791
2 4,608 6,491 31,282 4,608 6,491 31,282
3 3,671 5,170 36,453 3,671 5,170 36,453
4 2,845 4,007 40,460 2,845 4,007 40,460
5 2,101 2,959 43,419 2,101 2,959 43,419
6 1,893 2,666 46,085 1,893 2,666 46,085
7 1,721 2,424 48,508 1,721 2,424 48,508
8 1,506 2,122 50,630 1,506 2,122 50,630
9 1,407 1,981 52,611 1,407 1,981 52,611
10 1,298 1,829 54,440 1,298 1,829 54,440
11 1,212 1,707 56,147 1,212 1,707 56,147
12 1,185 1,668 57,815 1,185 1,668 57,815
13 1,133 1,596 59,411 1,133 1,596 59,411
14 1,073 1,512 60,923 1,073 1,512 60,923
15 1,030 1,450 62,373 1,030 1,450 62,373
Analyzing the findings in Table 2, it was attained at the end of the factor analysis that the eigenvalue of the scale accumulated on 15 factors greater than one. Total variance exploratory rate of these 15 factors was calculated %62.37. Item variances ranged from .47 to .77.
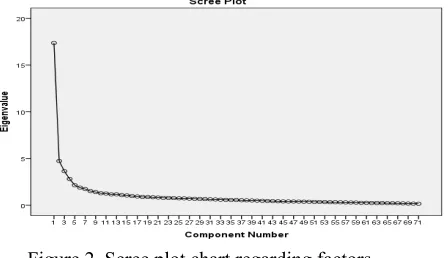
During the application of Principal Component Factor Analysis, Scree Plot was also investigated. The following chart was obtained as a result of this analysis.
Figure 2. Scree plot chart regarding factors
As shown in Figure 2, the scale seems to be suitable on Scree Plot curve for decomposition from 2 to 5 factors. The scale was concluded to be based on four factors by investigating Scree Plot curve, and considering the results obtained from the interviews and four dimensional theoretical framework of the scale.
Second Phase:
(1-2-3-13-20-22-23-24-25-26-27-28-29-30-31-33-34-43-44-45-51-53-58) were excluded and the analysis was re-conducted. The following results were obtained with repeated analysis.
Table 3. Exploratory percentages of total variance (b)
Variance Initial eigenvalue The sum of rotated square loads
Total Variance % Cumulative % Total Variance % Cumulative %
1 13,072 28,417 28,417 7,478 16,256 16,256
2 4,041 8,785 37,202 5,599 12,172 28,428
3 3,153 6,854 44,056 4,997 10,863 39,290
4 2,505 5,446 49,502 4,697 10,212 49,502
Examining the findings in Table 3, it can be seen that through conducted factor analysis the scale was explained with four factors, and the eigenvalue of the factors ranged from 12,505 to 13,072. The exploratory ratio of total variance for these four factors was calculated as 49.5%. In this phase, because their item variance value fell below .35, items 19 and 32 were excluded from the scale. The item variance value of the remaining items ranged from .35 to .62. These findings were considered sufficient for the validity of scale as a measurement tool.
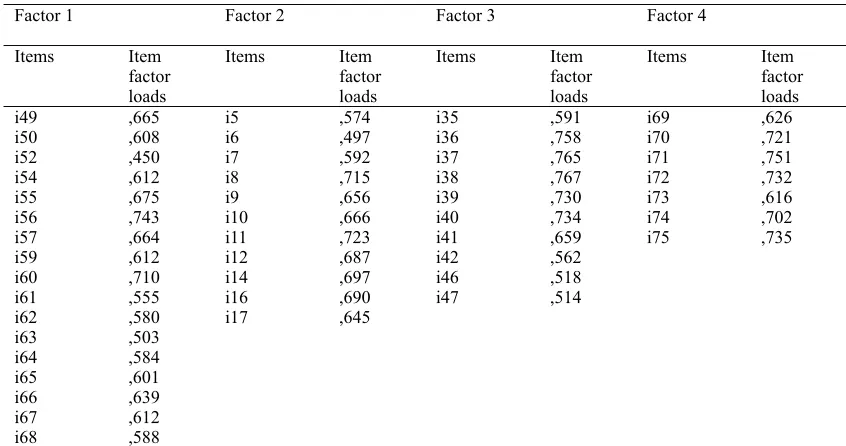
After all these phases, the variable scope of each item, the load value in the variable, and common factor variances were calculated. The findings are presented in the following table.
Table 4. The items in the factors and load values
Factor 1 Factor 2 Factor 3 Factor 4
Items Item factor loads
Items Item factor loads
Items Item
factor loads
Items Item factor loads
i49 ,665 i5 ,574 i35 ,591 i69 ,626
i50 ,608 i6 ,497 i36 ,758 i70 ,721
i52 ,450 i7 ,592 i37 ,765 i71 ,751
i54 ,612 i8 ,715 i38 ,767 i72 ,732
i55 ,675 i9 ,656 i39 ,730 i73 ,616
i56 ,743 i10 ,666 i40 ,734 i74 ,702
i57 ,664 i11 ,723 i41 ,659 i75 ,735
i59 ,612 i12 ,687 i42 ,562
i60 ,710 i14 ,697 i46 ,518
i61 ,555 i16 ,690 i47 ,514
i62 ,580 i17 ,645
i63 ,503
i64 ,584
i65 ,601
i66 ,639
i67 ,612
i68 ,588
It can be observed from the findings in Table 3.5 that item factor loads ranged from .450 to .767. Item 48 was excluded as its factor load fell below .45. Based on the findings from institutional and individual interviews, the factors were entitled as the factors regarding ‘teacher, curriculum, school, and education system’. Identified factors, items under these factors, the number of items, and sample items are provided in the table below.
Table 5. Factors and number of items
Factors Number
of items Item number Sample item
Regarding teachers 11 i5-i6-i7-i8-i9-i10-i11-i12-i14-i16-i1
7 Teacher’s attitude towards a new curriculum Regarding curriculum 10 I35-i36-i37-i38-i39-i40-i41-i42-i46
-i47 Indicating teaching content clearly in the curriculum Regarding school 17
i49-i50-i52-i54-i55-i56-i57-i59-i60-i61-i62-i63-i64-i65-i66-i67-i68 Schools having necessary physical infrastructure Regarding education
system 7 I69-i70-i71-i72-i73-i74-i75 The existing centralized education system in our country Total number of items 45
Journal of Education and Training Studies Vol. 4, No. 5; May 2016
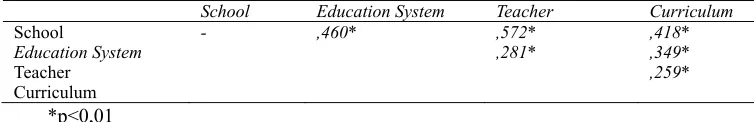
Table 6. The inter-factor correlation values
School Education System Teacher Curriculum
School - ,460* ,572* ,418*
Education System ,281* ,349*
Teacher ,259*
Curriculum *p<0,01
Analyzing findings in the table, scientifically significant correlations between each factor can be observed based on p<,01. The highest correlation can be seen between the factors regarding school and teacher (r=,572). The correlation between education system and teacher is the lowest compared to the rest. Consequently, it can be stated that the dimensions on the scale are all correlated with each other.
Findings on Reliability
In this phase, the reliability analysis of the scale was re-conducted after excluding some items and identifying factors. The reliability value of identified factors was also calculated as the scale was finalized.
Table 1. The findings regarding reliability
Factors Cronbach alpha
Factors regarding teacher .886
Factors regarding curriculum .881
Factors regarding school .924
Factors regarding education system .865
General .940
The findings obtained indicate that the scale is a reliable measuring tool. As a result, it can be said that the scale is sufficiently reliable and valid.
4. Discussion
The aim of this study was to develop a scale to determine the factors that affect curriculum alignment. Based on a review of literature and seeking answers to ‘What are the factors affecting curriculum alignment?’ interview question, the first draft of the 76-item scale was conducted to a sample 573 participants.
It is indicated in the literature that it would be sufficient to apply the scale to at least five times as many participants as the number of items on developed draft. For a scale with 76 items, as this was applied to 573 participants, it meets the criteria. It is further stated that 300 participants for a factor analysis is ‘good’, 500 is ‘very good’, and 1000 is ‘excellent’ (Büyüköztürk, 2010; Tabachnick & Fidell, 1996). Consequently, it can be claimed that the sample size is sufficient for the development of a scale.
In order to identify the validity and reliability of the findings obtained in the application of the study, analyses were carried out. Factor analysis was applied for the validity of the scale. Before the factor analysis, the data was examined whether it was appropriate for analysis. The distribution of the data obtained from the scale was found to be linear and normal, and the reliability coefficient was found to be sufficient for analysis. The results of KMO, conducted to determine the suitability of the sample size, was found .90 ‘excellent’, and Bartlett's test results, conducted to determine the relationship between variables showed that it was ready to analyze the data. During factor analysis, anti-image value of the items was calculated. Normally, anti-image value of the items is expected to be above .50. Obtained results indicated that anti image value was acceptable.
After determining that the data was ready for factor analysis, it was carried out for the principal components. In the first step of this two-phase analysis, a 15-factor structure explaining 62,373% of total variance was obtained. Considering qualitative analysis results and the theoretical framework used in the examination of Scree plot graphs and turning the scale into a draft, the analyses were repeated in four dimensions. In the end of these analyses, the scale had a four-dimensional structure and explained 49.50% of total variance. The analyses continued as this result was acceptable. Some items were excluded due to their item variance values.
According to Büyüköztürk (2002:473), items in the factors must have high load values. It is considered to be a good criterion of selection for factors to have a load value of 0.45 or higher. In this study, the value of item factor load was accepted as 0.45. The factor loads of four-dimensional items were acceptable, too.
The second dimension related to factors affecting curriculum alignment emerged as factors regarding ‘curriculum’. The vagueness of teacher roles in curricula, the unclear statement of objectives, content, teaching activities, assessment and evaluations in curricula, the complexity of innovations made in curricula, non-applicability of innovations, the difficulty of curricula, and the preparation of curricula without considering in-class processes were identified as factors affecting curriculum alignment.
Another dimension in the scale was regarding ‘school’. Under this scope there were such factors as inconvenience of school’s physical infrastructure, school climate, crowded classrooms, support from school administration, leadership of executives, insufficiency of teaching materials, the environment in which the school is located and characteristics of students.
The final dimension in the scale was on “education system”. The inclusion of bureaucracy into educational process by the ministry of education, frequently changed national education policies, centralized education system, future-determining exams, out-of-field teacher assignments, and not considering the characteristics of the nation during curriculum development were included in the scale as affecting factors.
The correlations between identified four dimensions of the scale were calculated, and they were acknowledged to be scientifically significantly correlated. The reliability coefficient of the 45-item scale was found to be adequate. It can be claimed that this 5-point Likert-type scale is reliable and valid with its 45 items.
Consequently, it can be asserted that the scale has proper characteristics to be used by researchers who want to identify factors affecting curriculum alignment.
References
Anderson, L. W. (2002). Curricular Alignment: A Re-Examination. Theory Into Practice, 41(4), 255-260, http://dx.doi.org/10.1207/s15430421tip4104_9
Armstrong, D. H., & Suddards, C. (1999). Focus on curriculum alignment: Edmonton public schools introduces a strategy to improve student achievement. ATA Magazine, 79(2), 7-9.
Aviles, C. B. (2001). Curriculum alignment: Matching what we teach and test versus teaching to the test. Social Work Dept. Buffalo State College. Educational Resources Information Center (ERIC).http://files.eric.ed.gov/fulltext/ED448402.pdf
Bergman, D., Calzada, L., LaPointe, N., Lee, A., & Sullivan, L. Vertical Alignment and Collaboration. Doctoral Dissertation, University of Texas A&M, Texas.
Bhola, D. S., Impara, J. C., & Buckendahl, C. W. (2003). Aligning tests with states’ content standards: methods and issues. Educational Measurement: Issues and
Bümen, N., T., Çakar, E., & Yıldız, D. G. (2014). Curriculum dependency in Turkey and the factors affecting curriculum dependency. Kuram ve Uygulamada Eğitim Bilimleri, 14(1), 203-228.
Burti Jr., N. (2010). Curricula Alignment and Its Impact on End of Course Assessment Scores. Doctoral Dissertation, University of Wilmington, Wilmington
Büyüköztürk, Ş. (2002). Faktör analizi: Temel kavramlar ve ölçek geliştirmede kullanımı. Kuram ve uygulamada eğitim yönetimi, 32(32), 470-483.
Caner, A., & Tertemiz, N. (2010). The assessment of primary school 1st grade teaching applications in terms of factors affecting practice: Teacher views. Türkiye Sosyal Araştırmalar Dergisi, Ağustos, 14(2), 155-187.
Christensen, V. (2014). Types of curriculum alignment.
http://www.ehow.com/info_8573111_types-curriculum-alignment.html
Çobanoğlu, R. (2011). Teacher Self-Efficacy and Teaching Beliefs as Predictors of Curriculum Implementation in Early Childhood Education. Master’s thesis, Middle East Technical University, Ankara. http://tez2.yok.gov.tr/
Crowell, R., & Tissot, P. (1986). Curriculum alignment. Developing guidelines for building effective instructional designs: Status Report, 1-14.
Demirel, Ö. (2012). Eğitimde Program Geliştirme “Kuramdan Uygulamaya”. 19. Baskı, Pegem Akademi Yayınları, Ankara, ss.122-135.
Edglossary.org (2014). The glossary of education reforms for journalists, parents and community members: “coherent curriculum”. http://edglossary.org/coherent-curriculum/
Elsworth, S. (2014). The definition of curriculum alignment.
Journal of Education and Training Studies Vol. 4, No. 5; May 2016
Evans, M. (2014). Curriculum alignment process.
http://www.ehow.com/facts_7555322_curriculum-alignment-process.html
Fullan, M. (2005). The New Meaning of Educational Change (3rd ed.). Teachers College Press, New York.
Furtak, E. M., Ruiz-Primo, M. A., Shemwell, J. T., Ayala, C. C., Brandon, P., Shavelson, R. J., & Yin, Y. (2008). On the fidelity of implementing embedded formative assessments and its relation to student learning. Applied Measurement in Education, 21(4), 360-389. http://dx.doi.org/10.1080/08957340802347852
Glatthorn, A. (1999). Curriculum alignment revisited. Journal of Curriculum and Supervision, 15(1):26-34.
Glatthorn, A. A., & Jailall, J. M. (2009). The Principal as Curriculum Leader: Shaping What is Taught and Tested. (3rd ed.). Corwin Press, California.
Glennerster, R., Kremer, M., Mbiti, I., & Takavarasha, K. (2011). Access and Quality in the Kenyan Education System: A Review of the Progress, Challenges and Potential Solutions. Pp. 2-54. http://www.povertyactionlab.org/publication/access-and-quality-kenyan-education-system
Gwimbi, E. M., & Monk, M. (2003). Study of classroom practice and classroom contexts amongst senior high school biology teachers in Harare, Zimbabwe. Science Education, 87, 207-223 http://dx.doi.org/10.1002/sce.10056
Kasapoğlu, K. (2010). Relations Between Classroom Teacher’s Attitudes Toward Change, Perception’s of “Constructivist” Curriculum Change and Implemention of Constructivist Teaching and Learning Activities in Class at Primary School Level. Master’s thesis, Middle East Technical University, Ankara. http://tez2.yok.gov.tr/ Kaya, M. F. (2011). A comparison of Geography curricula in Turkey and Germany. Eğitim Bilimleri Araştırmaları
Dergisi, 1(1), 57–78. http://ebad‐jesr.com/.
Kercheval, A., & Newbill, Sharon L. (2001). A case study of key effective practices in Ohio’s improved school districts. Indiana Center For Evaluation. Pp. 1-49.
http://ceep.indiana.edu/projects/PDF/200107_Key_Effec_Prac_Interim_Report.pdf
Kopera-Frye, K., Mahaffy, J., & Svare, G. M. (2008). The map to curriculum alignment and improvement. Collected Essays on Teaching and Learning, 1, 8-14.
Kurz, A., Elliot, S. N., Wehby, J. H., & Smithson, J. L. (2010). Alignment of the intended, planned and enacted curriculum in general and special education and its relation to student achievement. The Journal of Special Education, 44(3), 131-145. vhttp://dx.doi.org/10.1177/0022466909341196
Marcano, C. L. (2013). An Assessment of the Alignment of The Puerto Rico’s English Curriculum Framework and Classroom Teaching Practices at the High School Level in the Metropolitan Area. University of Turabo, Gurabo, pp. v-vi, 103-105.
McGehee, J. J., & Griffith, L. K. (2001). Large-scale assessments combined with curriculum alignment: agents of change. Theory into Practice, Spring, 40(2), 137-144. http://dx.doi.org/10.1207/s15430421tip4002_8
Olson, L. (2003). Standards and tests: keeping them aligned. Research Points: Essential Information for Education Policy, 1(1), pp. 1-4.
Özdamar, K. (2002). Paket Programları İle İstatistiksel Veri Analizi (Çok Değişkenli Analizler) 2, 4. Baskı, Eskişehir. Öztürk, İ. H. (2012). Teacher’s Role and Autonomy in Instructional Planning: The Case of Secondary School History
Teachers with regard to the Preparation and Implementation of Annual Instructional Plans. Kuram ve Uygulamada Eğitim Bilimleri, 12, 271-299.
Pence, K., Justice, L., & Wiggins, A. (2008). Preschool teachers’ fidelity in implementing a comprehensive language-rich curriculum. Language, Speech, & Hearing Services in Schools, 39(3):329-341. Practice, 22(3), 21-29. http://dx.doi.org/10.1044/0161-1461
Smith, N. (2014). How to assess curriculum alignment.
http://www.ehow.com/how_8064701_assess-curriculum-alignment.html (28.08.2014)
Squires, D. A. (2005). The Relationship between Aligned Curriculum and Student Achievement. A Research Brief. Appalachia Educational Laboratory (AEL) at Edvantia. Pp. 1-7. http://files.eric.ed.gov/fulltext/ED489150.pdf (18.09.2014)
Squires, D. A. (2009). Curriculum Alignment: Research-Based Strategies for Increasing Student Achievement. Corwin Press, California, p.3.
Clearing House, 85, 129–135. http://dx.doi.org/10.1080/00098655.2012.657723
Supovitz, J., & Christman, J. (2003). Developing communities of instructional practice: Lessons for Cincinnati and Philadelphia, Philadelphia Consortium for Policy Research in Education, University of Pennsylvania. www.researchforaction.org. (12.02.2015)
Tabachnick, B. G., & Fidell, L. S. (1996). Using multivariate statistics (3 Ed.). New York: Harpercollins College Publishers.
UNESCO (2015). Curriculum.
http://www.unesco.org/new/en/education/themes/strengthening-education-systems/quality-framework/core-resourc es/curriculum/ (21.12.2014)
Vartuli, S., & Rohs, J. (2009). Assurance of outcome evaluation: curriculum fidelity. Journal of Research in Childhood Education, 23(4), 502-512. http://dx.doi.org/10.1080/02568540909594677
Vasquez, K. (2014). What curriculum alignment is and is not. Seattle Public Schools. http://district.seattleschools.org/modules/cms/pages.phtml?pageid=210607&sessionid (16.06.2014)
Villarreal, L. T. (2001). The Effect of Curriculum-Aligned Instruction on Reading and Mathematics Achievement. Doctoral Dissertation, University of Houston, pp. 2-23.
Webb, N. L. (1997). Determining alignment of expectations and assessments in mathematics and science education. NİSE Brief, Jan, 1(2), 1-10. http://www.wcer.wisc.edu/nise (08.09.2014)
Webb, N. L. (2007). Issues related to judging the alignment of curriculum standards and assessments. Applied Measurement in Education, 20(1), 7–25. http://dx.doi.org/10.1080/08957340709336728
Wilson, L. O. (2015). The second principle-types of curriculum.
http://thesecondprinciple.com/instructional-design/types-of-curriculum/ (25.01.2015)
Journal of Edu
Appendix
The Scale on F
Factors regard
1 Tea
2 Tea
3 Tea
4 Tea
5 Tea
6 Tea
7 Tea
8 Tea
9 Tea
10 Tea
11 Tea
Factors regard
12 Vag
13 Vag
14 Vag
15 Vag
16 Vag
17 Com
18 Unp
19 The
20 The
21 The
real Factors regard
22 Sch
23 Sch
24 Cro
25 Sup
26 Opp
27 Sch
28 Effe
29 The
30 Acc
31 Insu
32 Inst
etc.
33 The
34 Cul
35 Eco
36 Cha
37 Aca
38 Indi
Factors regard
39 The
40 Freq
41 Exi
42 Futu
43 Tea
dete
44 Out
45 The
This work is l
ucation and Tr
Factors Regard
ding teacher acher’s motivatio acher’s job satisf acher’s attitude t acher’s openness acher’s self-con acher’s teaching acher’s content k acher’s having up acher’s profess acher’s self-effic acher’s prepare ding curriculum gueness of teach gueness of objec gueness of teach gueness of teach gueness of asses mplexity of the i practicality of th e difficulty of cu e development o e development o
lity ding school hools’ not having hool climate owded classroom pport from schoo portunities provi hool administrati ective leadership e motivation of s cessibility to ma ufficiency of tea titutions and org
)
e society’s not ha ltural characteris onomic characte
aracteristics of th ademic achievem ividual learner d ding education e inclusion of bu quent changes in sting centralized ure determining achers’ ignoranc ermining exams t-of-field teache e development o
icensed under
raining Studies
ding Curriculu
on faction
owards a new cu s to innovations
nfidence enthusiasm knowledge p-to-date knowl sional competen cacy edness (towards m
her roles in the cu ctives in the curr hing content in th hing activities in sment and evalu innovations mad he innovations m urriculum conten of curriculum wi
of curriculum w
g necessary phy ms
ol administration ided by school e ion’s attitude in p of school exec school staff (sch aterials during cu aching materials
ganizations prom aving relevant c stics of school e ristics of school he student in cla ment of the stude differences in cla
system ureaucracy into e
n educational po d education syst g exams (TEOG, ce of certain tea (TEOG, LYS, e r assignments of curricula with
a Creative Co
um Alignment
urriculum
ledge on curricu nce teaching proces urriculum riculum he curriculum the curriculum uation in the cur de in the curricu made in the curri
nt
ithout the basis o without the bas
sical infrastructu
n
executives to tea problem solving cutives
hool principal, p urriculum applic s
moting the curr characteristics fo
nvironment l environment assrooms (physi
ent in classroom assrooms educational proc olicies
tem , LYS, etc.) aching contents etc.)
hout considering
ommons Attrib
ulum (e.g. branch
ss)
rriculum ulum
iculum of practicality sis of teaching
ure
achers for teachi g
ersonnel, etc.) cation process riculum (institut or curriculum ap
ical, mental, affe ms
cess by ministry
because they a
the characterist
ution 3.0 Licen
hed grid usage,
processes, dista
ing process
tions related to pplication
ective, etc.)
y of education
are not covered
tics of the nation
nse. Vo (1) (2) (3) (4) (5) ( ( ( ( ( ( ( etc.) ( ( ( ( ( ( ( ( ( ( ( ( ( ance from (
( ( ( ( ( ( ( ( ( ( the field, ( ( ( ( ( ( ( ( ( ( ( d in future ( (
n (
l. 4, No. 5; M
) definitely not e ) not efficient ) partly efficient ) efficient ) very efficient
) ) ) ) ) ) ) ) ) ) ) ) ) ) ) ) ) ) ) ) ) ) ) ) ) ) ) ) ) ) ) ) ) ) ) ) ) ) ) ) ) ) ) ) )
May 2016