RESEARCH ARTICLE
Application of response surface
methodology for optimization of metal–
organic framework based pipette-tip solid
phase extraction of organic dyes from seawater
and their determination with HPLC
Sayyed Hossein Hashemi
1, Massoud Kaykhaii
2*, Ahmad Jamali Keikha
3, Elahe Mirmoradzehi
1and Ghasem Sargazi
4Abstract
This paper describes the application of response surface methodology (RSM) to develop a miniaturized metal organic framework based pipette-tip solid phase extraction for the extraction of malachite green (MG), rhodamine B (RB), methyl orange (MO) and acid red 18 (AR) dyes from seawater samples and their determination by high performance liquid chromatography. The effects of various parameters such as pH of the sample solution, type and amount of added salt, type and volume of eluent solvent, concentration of surfactant (triton X-114), sample volume, and number of cycles of extraction and desorption were investigated and optimized by two methods of one-variable-at-a-time and RSM based on Box–Behnken design. Under optimum conditions, the linear range of the method was 0.5–200.0 µg/L for RB and MG and 1.0–150.0 µg/L for AR and MO. Limits of detection of the analytes were obtained in the range of 0.09–0.38 µg/L. Reproducibility of the method (as RSD %) was better than 6.4%. The method has been successfully used for analysis of four dyes in seawater of Chabahar Bay.
Keywords: Azo dyes, Metal–organic framework, Pipette tip solid phase extraction, Response surface methodology, Box–Behnken design, Seawater analysis
© The Author(s) 2019. This article is distributed under the terms of the Creative Commons Attribution 4.0 International License (http://creat iveco mmons .org/licen ses/by/4.0/), which permits unrestricted use, distribution, and reproduction in any medium, provided you give appropriate credit to the original author(s) and the source, provide a link to the Creative Commons license, and indicate if changes were made. The Creative Commons Public Domain Dedication waiver (http://creat iveco mmons .org/ publi cdoma in/zero/1.0/) applies to the data made available in this article, unless otherwise stated.
Introduction
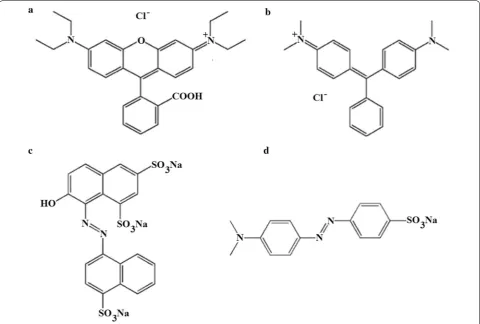
Rhodamine B (RB) (Fig. 1a), is among the oldest and most commonly used synthetic dyes that have been recently identified as possible illegal additives in foods exported from European Union and China [1]. It belongs to the class of xanthenes dyes, a basic red cationic dye that is highly soluble in water, methanol and ethanol. This dye is used widely as a colorant in textiles and plastic industries. RB is harmful if swallowed with human beings and cause irritation to the skin, eyes and respiratory tract. Also, it has been shown to have carcinogenicity, reproductive
and developmental toxicity, neurotoxicity and chronic toxicity towards human and animals [2]. Malachite green (MG, Fig. 1b), although a forbidden dye, has been widely applied illegally as a fungicide and parasitical and in the fish industry as an antimicrobial, antiseptic and ectoparasitic agent, because of its high efficiency and low cost [3–5]. Acid red 18 (AR, Fig. 1c), is a popular food color, not toxic but can be harmful if used in excess [6, 7]. Methyl orange (MO, Fig. 1d), have many application as textile dyeing stuff and staining agents in laboratories [8]. These dyes are of the most abundant applied dying agents throughout the world and therefore can find their way to the environmental sources such as seawater as hazardous pollutants [9, 10].
Open Access
*Correspondence: [email protected]
2 Department of Chemistry, Faculty of Sciences, University of Sistan and Baluchestan, Zahedan 98155-674, Iran
Different techniques such as liquid chromatography– mass spectrometry (LC–MS) [11, 12], liquid chromatog-raphy–tandem mass spectrometry (LC–MS/MS) [13], gas chromatography–mass spectrometry (GC–MS) [14], capillary electrophoresis [14], high performance liquid chromatography (HPLC) [14, 15], high performance liq-uid chromatography–mass spectrometry (HPLC–MS) [16] and spectrophotometry [8, 17] have been used for determination of dyes in complex samples. Each of these techniques has disadvantages. Spectrophotometry lacks the required selectivity and sensitivity, while LC– MS, LC–MS/MS, GC–MS and HPLC–MS are relatively expensive techniques and capillary electrophoresis is slow for the determination of analytes.
Use of an enrichment step for determination of dyes is normally required. This is mainly due to their low concentration or the severe matrix interference in real samples such as seawater [18–20]. Several extraction methods such as liquid–liquid extraction (LLE) [21], liquid phase microextraction (LPME) [22], solid phase extraction (SPE) [23], solid phase microextraction [24], molecular imprinted polymer (MIP) [25], cloud point
extraction (CPE) [26] and micro-cloud point extraction [8, 17] have been developed to determine organic dyes in different matrices.
Metal–organic frameworks (MOFs) are three dimen-sional crystalline porous materials having different geom-etries and functional groups within the channels/cavities, which are synthesized using mixing organic linkers and metal salts, often under hydrothermal or solvothermal conditions. The unique characteristic of the hybrid sol-ids are adjustable pore-sizes and controllable structural properties, extra ordinarily large porosity, low density and their very high surface areas. MOFs have been con-sidered as promising candidate materials for different applications including adsorption, removal, separation, selective extraction and pre- concentration of various analytes [27, 28].
Pipette-tip solid phase extraction (PT-SPE) is a represent-ative SPE technique because of its miniature device and use of reduced amount of reagents and less time consumption [29]. For PT-SPE, an ordinary pipette tip acts as the extract-ing column, packed with sorbent. This technique has been successfully used in many applications [30, 31].
Response surface methodology (RSM) can be summa-rized as a compilation of statistical tools and method for constructing and exploring estimated function relation-ship between a response variable and set of design vari-able. It is the collection of mathematical and numerical methods that are suitable for modeling and analysis of the problems having numerous variables influencing the response, and objective is to optimize the response. The most extensive application of RSM can be found in industrial world, where a number of input variables affect some performance measures, called the response, in ways which are not easy or unfeasible to depict by a rigorous mathematical formulation [32, 33].
In the present work, we synthesized a novel Co-MOF and used it for simple, fast and sensitive PT-SPE of RB, MG, AR and MO organic dyes in seawater samples and their determination with HPLC. Parameters affecting PT-SPE were optimized by two methods of one variable-at-a-time and RSM, based on Box–Behnken design. This is the first report on using Co-MOF for pipette-tip solid phase extraction of dyes in Chabahar Bay (Oman Sea).
Experimental
Apparatus
A Knauer HPLC (Germany) equipped with a EA4300F smart line pump and a smart line auto sampler 3950, was used for all analyzes. Detection system was a diode array spectrophotometer, used at wavelengths of 448 nm for MO, 510 nm for AR, 555 nm for RB and 618 nm for MG. Analytical column was a 250 × 4.6 mm Eurospher 100-5 C18 utilizing the same pre-column. ChromGate
V3.1.7 software was used for chromatographic data han-dling. The injection loop volume was 20 µL. A model 630 Metrohm (Switzerland) pH meter was employed for pH determination.
Reagents
All dyes and chemical reagents were of analytical grade and were purchased from Merck KGaA (Darmstadt, Germany). The HPLC grade methanol, acetonitrile and water were also obtained from the same company. Milli-Q® water (18.3 MʹΩ/cm) was used throughout the run after filtering through 0.22 mm Nylon membrane. Tri-ton X-114 (5% v/v) solutions was prepared at 70:30 (v/v) water/methanol and used as the surfactant. Stock solu-tion of each dye with a concentrasolu-tion of 500 mg/L was prepared with dissolving of 0.0500 g of each dye in dis-tilled water in 100 mL flasks. Working solutions were prepared daily by proper dilution of stock solutions.
Synthesize and characterization of Co‑MOF adsorbent
Synthesize of Co-MOF was according to the work of Sar-gazi et al. [34]. Briefly, 5.62 mmol of cobalt nitrate and
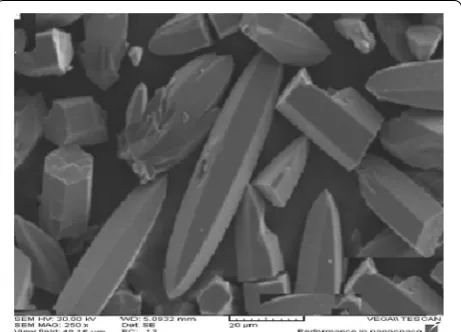
1.85 mmol of pyridine 2, 6-dicarboxylic acid were dis-solved in 14 mL of ethanol. Obtained solution was trans-ferred into a Teflon reactor with a tight cap and kept for 7 h at 85 °C. The product was washed with dimethylfor-mamide. After mixing and dissolving the reactants, the clear solution radiated in the ultrasound bath for 13 min at working condition of 160 W, 1 kJ, and 21 kHz. Synthe-sized adsorbent was stored in 4 °C. Scanning electron microscopy (Fig. 2) showed an average size of 17 µm for synthesized MOF. By BET (Brunauer, Emmett and Teller), the specific surface area of Co-MOF was deter-mined 3000 m2/g.
Pipette‑tip solid phase extraction procedure
PT-SPE of dyes was performed using an Extra GENE tip mounted on a variable 150 µL volume pipettor (Dragon Labs, USA). 8 mL of an aliquot of sample solution con-taining appropriate amounts of dye was transferred into a 10 mL flask and proper amount of triton X-114 (0.15% v/v for MG and AR and 0.20% v/v for RB and MO) and 150 mg of KCl was added. Then pH of solutions were adjusted to the desired value (pH = 3.0 for MG and RB, 6.0 for AR and 6.9 for MO) with drop-wise addition of either 1 mol/L of HCl or 1 mol/L of NaOH. PT-SPE car-ried out by loading the sample solution into the cartridge and washing out with 0.5 mL of methanol–water (1:1). After the analyte retained on the MOF sorbent, it was eluted using 300 µL (for RB, MO and AR) and 250 µL (for MG), of methanol contain 5% acetic acid. Finally eluted solvent was filtered through a 0.45 µm filter and was injected into HPLC for analysis.
Results and discussion
Chromatographic conditions
Various mobile phases were investigated consist-ing of methanol, acetonitrile and water in different
combinations and pH settings. Finally a gradient of 85% B at 0–3.5 min and 100% B at 3.5–10 min was selected; in which eluent A was water and eluent B was acetoni-trile which was adjusted to the pH 5.25 using acetic acid at a flow rate of 0.8 mL/min. The column oven tempera-ture was maintained at room temperatempera-ture and the mobile phase was degassed using a stream of helium prior to use.
Optimization of MOF‑PT‑SPE
In order to achieve the best efficiency of the MOF-PT-SPE, different factors affecting extraction efficiency were optimized using two methods of one-variable-at-a-time and RSM based on Box–Behnken design. A standard aqueous solution at concentration of 150.0 µg/L for AR and MO and 250 µg/L for RB and MG was used for opti-mization experiments. Each experiment repeated at least three times.
Effect of type of the eluent solvent
Different solvents as eluent were studied for elution of dyes from the MOF sorbent, including methanol, nol/acetic acid (1:2), methanol/acetic acid (1:1), metha-nol/acetic acid (2:1), methanol containing 5% acetic acid, acetonitrile, ethanol, methanol/H2O (1:1), H2O, acetone
and acetic acid. Methanol containing 5% acetic acid showed the best efficiency for all analytes.
Effect of amount of sorbent
The effect of amount of MOF for preconcentration and determination of selected dyes in pipette tip was inves-tigated in the range 1.0–2.5 mg. The results showed that the percent of extraction increases to 2.0 mg of MOF and then the recovery decreases. So, 2.0 mg of sorbent in pipette tip was used for further experiments.
Effect of type and amount of salt
To investigate effect of type and amount of salt on extrac-tion efficiency of dyes, NaCl, KCl and Na2SO4 as common
salts were selected and used for MOF-PT-SPE of dyes. Among them, KCl improved the extraction better than the other salts and hence selected as spiked salt in fur-ther works. To study effect of amount of KCl on extrac-tion efficiency, various brine sample soluextrac-tions containing different quantity of KCl in the range of 25–200 mg were prepared. The results indicated that the extraction effi-ciency of dyes is quantitative for amount of KCl greater than 200 mg. Hence, next runs were performed with sat-uration of the samples using 200 mg of KCl.
Effect of concentration of triton X‑114
The concentration of triton X-114 as surfactant can effect on the extraction efficiency of dyes by MOF-PT-SPE; so, we tried to optimize its concentration. We found that by
increasing the concentration of the surfactant, the extrac-tion efficiency was also increases, but in the amounts more than 0.20 (for RB and MO) and 0.15 (for MG and AR) %v/v of triton X-114, a decrease in the extraction efficiency of dyes was observed. This is probably due to the dilution of the analytes in larger volumes of the surfactant.
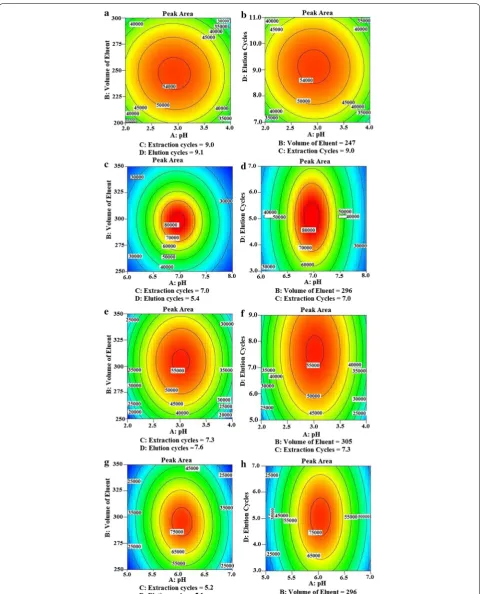
Box–Behnken design
Four factors in three levels were utilized to consider and optimize the process factors which potentially have an effect on the extraction efficiency of the analytes by MOF-PT-SPE. The investigated factors and input variable for four dyes were pH (X1 or A), eluent volume (µL) (X2
or B), number of extraction cycles (X3 or C), and
num-ber of eluent cycles (X4 or D). Table 1 shows the levels
of these variable which were coded as − 1 (low), 0 (cen-tral point) and 1 (high). The design of real runs is given in Additional file 1: Table S1.
The following quadratic equation (Eq. 1) can be used to explain the behavior of the system:
In Eq. 1, Y is output; i.e. is the response of HPLC, which is the dependent variable; i and j are the index numbers of the model; β0 is the free or offset term, called intercept
term; X1, X2, …, Xk are coded independent variables; Bi
is the first-order (linear) main effect,; Bii is the quadratic
(squared) effect; βij is the interaction effect; and ε is the
random error which allows for description or uncertain-ties between predicted and determined values [35].
For 4 selected dyes, subsequent equations explain the relationship between the four variables and response of HPLC (output, Y):
(1) Y=β0+
βiXi+
βiiXii+
βijXiXj+ε
Table 1 Levels or variables chosen for the trials
A B C D
MG 2 (− 1) 200 (− 1) 7 (− 1) 7 (− 1)
3 (0) 250 (0) 9 (0) 9 (0)
4 (+ 1) 300 (+ 1) 11 (+ 1) 11 (+ 1) MO 6 (− 1) 250 (− 1) 3 (− 1) 3 (− 1)
7 (0) 300 (0) 5 (0) 5 (0)
8 (+ 1) 350 (+ 1) 7 (+ 1) 7 (+ 1) RB 2 (− 1) 250 (− 1) 5 (− 1) 5 (− 1)
3 (0) 300 (0) 7 (0) 7 (0)
4 (+ 1) 350 (+ 1) 9 (+ 1) 9 (+ 1) AR 5 (− 1) 300 (− 1) 3 (− 1) 3 (− 1)
6 (0) 250 (0) 5 (0) 5 (0)
For MG:
For MO:
For RB:
For MO:
By solving these equations for the condition of (∂Y/∂A) = 0, (∂Y/∂B) = 0, (∂Y/∂C) = 0, (∂Y/∂D) = 0, the critical point in the surface response can be achieved [33]. These critical points for this research are as fol-lows: pH (A) = 3.02 for RB, 2.93 for MG, 6.04 for AR and 6.88 for MO, eluent volume (B) (µL) = 305 (for RB), 247 (for MG), 296 for AR and MO, the number of extrac-tion cycles (C) = 7.3 for RB, 9 for MG, 5.2 for AR, and 7 for MO, the number of elution cycles (D) = 7.6 for RB,
(2)
Y=Peak Area= [(−75684600000)+(7470240000×A)+(218693000×B)+(4422710000×C)
+(4548290000×D)−(1902720×A×B)−(40418800×A×C)−(25967400×A×D)
+(480709×B×C)−(175761E×B×D)+(12474500×C×D)−
1091510000×A2
−
436650×B2
−(251059000×C2)−(248871000×D2)]0.5
(3) Y=Peak area=1.01.33912×10−3−
2.53546×10⁻⁴×A−
3.45465×10⁻⁶×B
−
3.20448×10⁻⁶×C
−
1.68106×10⁻⁵×D
+
1.53607×10⁻⁸×A×B
+
6.59639×10⁻⁸×A×C−
4.18401×10⁻⁸×A×D−
5.80433×10⁻¹⁰×B×C
−
1.43491×10⁻⁹×B×D
+
6.02261×10⁻⁷×C×D
+
2.08619×10⁻⁵×A2
+
5.65699×10⁻⁹×B2−
5.83979×10⁻⁸×C2+
1.31577×10⁻⁶×D2
(4)
Y=Peak Area= −1485340+(150129×A)+(7179.167×B)+(146027×C)+(16775.55×D)
−(636.35×B×C)+(35.525×B×D)−
24853.63333×A2−
11.46755×B2
−
5954.37708×C2
−
1814.84583×D2
+
0.77035×B2×C
+(14.24000×B×C2)
(5)
Y0.1=(Peak Area)0.1= −14.76252+(3.78391×A)+(0.037973×B)+(0.13524×C)+(0.18010×D)
−
4.60647×10⁻⁴×A×B+
3.48312×10⁻³×A×C
−
6.21428×10⁻⁴×A×D
−
1.29913×10⁻⁴×B×C
+
1.28132×10⁻⁴×B×D−
5.02127×10⁻⁴×C×D
−
0.30314×A2
−
5.9497810−5×B2
−
0.011142×C2−
0.020918×D2
9.1 for MG, 5.1 for AR, and 5.4 for MO. The ANOVA of regression of each model (indicated in Additional file 1: Table S2) demonstrates which model is of higher signifi-cance and with the determination coefficients (R2), the
goodness-of-fit of each model can be checked. The value of adjusted R2 (0.946, 0.713, 0.885 and 0.956 for RB, MG,
good relation between the experimental and predicted values of the response was obtained, since the values of determination coefficient are close to unity (R2= 0.969,
0.856, 0.942 and 0.978 for RB, MG, AR and MO, respec-tively). The quadratic model is statistically significant for the response, because the lack-of-fit is > 0.05. Moreover, based on what reported by Yetilmezsoy et al. [33], with low values of coefficient of variations (CV = 9.99, 37.30,
1.91, 8.41 for RB, MG, AR and MO, respectively), a high degree of precision and a good deal of the reliability of the conducted experiments is obtained. Based on the Fisher’s F-test results (Fmodel= 41.61, 5.96, 16.33 and
44.21 for RB, MG, AR and MO, respectively) and a very low probability value (p), the ANOVA of the regression models shows that quadratic models are also significant. In Fig. 3 two dimensional response surfaces as the func-tion of other variable are shown.
Analytical performance
Linear range, limit of detection and enrichment factor
The linearity of the proposed method was examined under the optimized conditions. Over a concentra-tion range of 0.5–200.0 µg/L for RB and MG; and 1.0– 50.0 µg/L for AR and MO, the calibration curve was linear. The least square equations over the dynamic lin-ear range are indicated in Table 2. The limit of detection of the method for all target analytes was calculated using
3Sb/m equation (where Sb is the standard deviation of 7
consecutive measurements of the blank and m is shop of the calibration curve) and was 0.09, 0.17, 0.33 and 0.38 for RB, MG, AR and MO, respectively.
To achieve a high enrichment factor (EF), the effect of the sample volume on the recovery of dyes was investi-gated in the range of 2 to 10 for all of the analytes. The results showed that the extraction efficiency of selected dyes were very efficient (> 97%) in a sample volume of 8 mL and at the eluent solvent of 300 µL (for RB, MO and AR), 250 µL (for MG).
By mathematical calculation from the volume ratio of the sample to extracting phase, and a recovery of 97%, it is expected to have a pre-concentration factor of 26.6 (for RB, MO and AR), 32.0 (for MG). The real enrichment factors were experimentally achieved were 25.8 (for RB, MO and AR), 31.0 (for MG), and 28.2 (for AR). Table 3
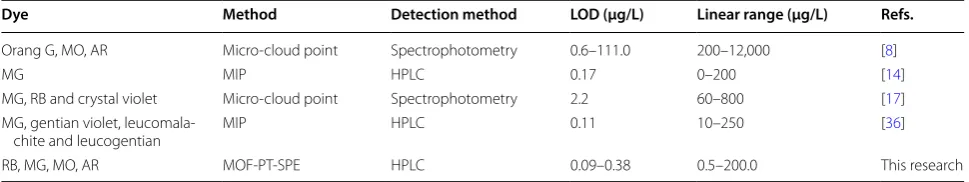
compares the characteristic data of present method with those reported in the literature.
Determination of dyes in seawater samples
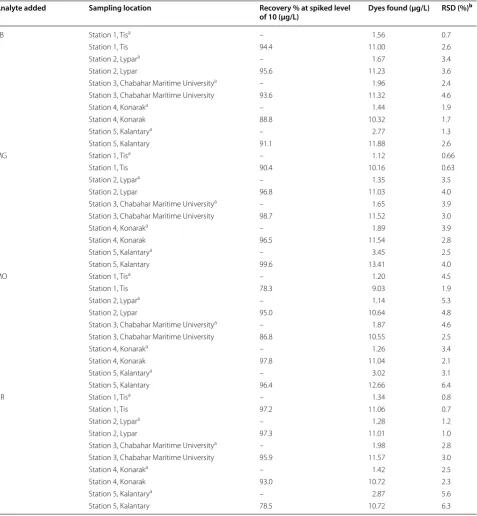
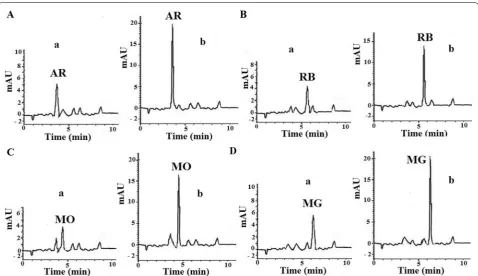
The performance of proposed method was investigated by extraction and determination of dyes in five seawater samples taken from different spots of Oman Sea, close to Chabahar Bay (southern-east part of Iran). No salt was added to the real samples since they are fully salt satu-rated by themselves. Since no dyes could be detected in them, to evaluate the effect of sample media on recovery, they were spiked at the concentration of 10 µg/L with dyes. Results are presented in Table 4. Figure 4 shows sample chromatograms obtained for the analysis of sea-water sample, taken from station 3. Significant raise of signal can be observed. Reproducibility of the method (as RSD%) was found to be in the range of 0.7–4.6% for RB, 0.6–4.0 for MG, 1.9–6.4 for MO and 0.7–6.3 for AR.
Table 2 Analytical figure of merit for MOF-PT-SPE combined by HPLC for determination of dyes (C and A are the concentrations of dyes and HPLC response as peak area, respectively)
Analyte Linearity range
(µg/L) Equation of calibration Determination coefficient (R2) Limit of detection (µg/L) Enrichment factor
RB 0.5–200.0 A = 225.7 C + 7435 0.9908 0.09 25.8
MG 0.5–200.0 A = 267.43 C + 1190.6 0.999 0.17 31.0
AR 1.0–150.0 A = 476.6 C + 6973.8 0.9953 0.33 25.8
MO 1.0–150.0 A = 467.95 C + 7909.7 0.9970 0.38 25.8
Table 3 Characteristic data of the suggested technique with other methods
Dye Method Detection method LOD (µg/L) Linear range (µg/L) Refs.
Orang G, MO, AR Micro-cloud point Spectrophotometry 0.6–111.0 200–12,000 [8]
MG MIP HPLC 0.17 0–200 [14]
MG, RB and crystal violet Micro-cloud point Spectrophotometry 2.2 60–800 [17]
MG, gentian violet,
leucomala-chite and leucogentian MIP HPLC 0.11 10–250 [36]
These results show that the proposed technique can be used for determination of selected dyes in very compli-cated matrices such as seawater.
Conclusion
In this paper, the combination of pipette tip solid phase microextraction by means of a novel metal organic framework with HPLC was successfully used for the
Table 4 Recovery results for real sample achieved from several points of Chabahar Bay (Iran)
a No spiking
b RSD, relative standard deviation for three replicate measurement
Analyte added Sampling location Recovery % at spiked level
of 10 (µg/L) Dyes found (µg/L) RSD (%) b
RB Station 1, Tisa – 1.56 0.7
Station 1, Tis 94.4 11.00 2.6
Station 2, Lypara – 1.67 3.4
Station 2, Lypar 95.6 11.23 3.6
Station 3, Chabahar Maritime Universitya – 1.96 2.4
Station 3, Chabahar Maritime University 93.6 11.32 4.6
Station 4, Konaraka – 1.44 1.9
Station 4, Konarak 88.8 10.32 1.7
Station 5, Kalantarya – 2.77 1.3
Station 5, Kalantary 91.1 11.88 2.6
MG Station 1, Tisa – 1.12 0.66
Station 1, Tis 90.4 10.16 0.63
Station 2, Lypara – 1.35 3.5
Station 2, Lypar 96.8 11.03 4.0
Station 3, Chabahar Maritime Universitya – 1.65 3.9
Station 3, Chabahar Maritime University 98.7 11.52 3.0
Station 4, Konaraka – 1.89 3.9
Station 4, Konarak 96.5 11.54 2.8
Station 5, Kalantarya – 3.45 2.5
Station 5, Kalantary 99.6 13.41 4.0
MO Station 1, Tisa – 1.20 4.5
Station 1, Tis 78.3 9.03 1.9
Station 2, Lypara – 1.14 5.3
Station 2, Lypar 95.0 10.64 4.8
Station 3, Chabahar Maritime Universitya – 1.87 4.6
Station 3, Chabahar Maritime University 86.8 10.55 2.5
Station 4, Konaraka – 1.26 3.4
Station 4, Konarak 97.8 11.04 2.1
Station 5, Kalantarya – 3.02 3.1
Station 5, Kalantary 96.4 12.66 6.4
AR Station 1, Tisa – 1.34 0.8
Station 1, Tis 97.2 11.06 0.7
Station 2, Lypara – 1.28 1.2
Station 2, Lypar 97.3 11.01 1.0
Station 3, Chabahar Maritime Universitya – 1.98 2.8
Station 3, Chabahar Maritime University 95.9 11.57 3.0
Station 4, Konaraka – 1.42 2.5
Station 4, Konarak 93.0 10.72 2.3
Station 5, Kalantarya – 2.87 5.6
analysis of dyes in seawater. This technique has enough simplicity and sensitivity to be employed for routine analysis of dyes in such complicated media. An additional advantage of the suggested technique is its easy opera-tion. Besides, the technique is feasible for high number of samples due to its short processing time.
Additional file
Additional file 1: Table S1. Box–Behnken design observed and predicted values (this table shows how close are the values obtained by real runs to what obtained by design of experiments for all of the analytes studied). Table S2. ANOVA for preconcentration of dyes (this table shows which model is of higher significance and what are the total variations which were not explained with these models).
Abbreviations
RSM: response surface methodology; MG: malachite green; RB: rhodamine B; MO: methyl orange; AR: acid red 18; LC–MS: liquid chromatography–mass spectrometry; LC–MS/MS: liquid chromatography–tandem mass spec-trometry; GC–MS: gas chromatography–mass specspec-trometry; HPLC: high performance liquid chromatography; HPLC–MS: high performance liquid chromatography–mass spectrometry; LLE: liquid–liquid extraction; LPME: liquid phase microextraction; SPE: solid phase extraction; MIP: molecular imprinted polymer; CPE: cloud point extraction; MOFs: metal–organic frame-work; PT-SPE: pipette-tip solid phase extraction; CV: coefficient of variation; LOD: limit of detection.
Authors’ contributions
SHH, MK, EM and GS did the practical work. Both MK and SHH co-wrote the manuscript and MK planned the study. Design of experiments were per-formed by AJK and SHH. All authors read and approved the final manuscript.
Author details
1 Department of Marine Chemistry, Faculty of Marine Science, Chabahar Maritime University, Chabahar, Iran. 2 Department of Chemistry, Faculty of Sciences, University of Sistan and Baluchestan, Zahedan 98155-674, Iran. 3 Department of Mechanical Engineering, Faculty of Marine Engineering, Chabahar Maritime University, Chabahar, Iran. 4 Department of Nano Chemis-try, Graduate University of Advanced Technology, Kerman, Iran.
Acknowledgements
We gratefully acknowledge the financial support of the Research Council of Chabahar Maritime University.
Competing interests
The authors declare that they have no competing interests.
Availability of data and materials
All data generated or analyzed during this study are included in this published article.
Funding
This work was financially supported by the Research Council of Chabahar Maritime University.
Publisher’s Note
Springer Nature remains neutral with regard to jurisdictional claims in pub-lished maps and institutional affiliations.
Received: 28 September 2018 Accepted: 9 April 2019
References
1. EFSA, European Food Safety Authority (2005) Opinion of the scientific panel on food additives, flavourings, processing aids and materials in contact with food on a request from the commission to review the toxicology of a number of dyes illegally present in food in the EU. EFSA J. 263:1–71
2. Jain R, Mathur M, Sikarwar S, Mittal A (2007) Removal of the hazardous dye rhodamine B through photocatalytic and adsorption treatments. J Environ Manage 85:956–964
3. Stammati A, Nebbia C, Angelis ID, Albo AG, Carletti M, Rebecchi C, Zampaglioni F, Dacasto M (2005) Effects of malachite green (MG) and its major metabolite, leucomalachite green (LMG), in two human cell lines. Toxicol In Vitro 19:853–858
4. Arroyo D, Ortiz MC, Sarabia LA, Palacios F (2008) Advantages of PARAFAC calibration in the determination of malachite green and its metabolite in fish by liquid chromatography-tandem mass spectrometry. J Chromatogr A 1187:1–10
5. Dowling G, Mulder PPJ, Duffy C, Regan L, Smyth MR (2007) Confirmatory analysis of malachite green, leucomalachite green, crystal and leucocrys-tal violet in salmon by liquid chromatography-tandem mass spectrom-etry. Anal Chim Acta 586:411–419
6. Rao P, Bhat RV, Sudershan RV, Krishna TP, Naidu N (2004) Exposure assess-ment to synthetic food colours of a selected population in Hyderabad, India. Food Addit Contam. 21:415–421
7. Arnold LE, Lofthouse N, Hurt E (2012) Artificial food colors and attention deficit/hyperactivity symptoms: conclusions to dye for. Neurotherapeu-tics. 9:599–609
8. Ghasemi E, Kaykhaii M (2016) Application of a novel micro-cloud point extraction for preconcentration and spectrophotometric determination of azo dyes. J Braz Chem Soc 27:1521–1526
9. Saratale RG, Saratale GD, Chang JS, Govindwar SP (2011) Bacterial decolorization and degradation of azo dyes. J Taiwan Inst Chem Eng. 42:138–157
10. Petrella A, Petrella M, Boghetich G, Mastrorilli P, Petruzzelli V, Ranieri E, Petruzzelli D (2013) Laboratory scale unit for photocatalytic removal of organic micropollutants from water and wastewater. Methyl orange degradation. Ind Eng Chem Res 52:2201–2208
11. Xu YJ, Tian XH, Zhang XZ, Gong XH, Liu HH, Zhang HJ, Huang H, Zhang LM (2012) Simultaneous determination of malachite green, crystal violet, methylene blue and the metabolite residues in aquatic products by ultra-performance liquid chromatography with electrospray ionization tandem mass spectrometry. J Chromatogr Sci 50:591–597
12. Guerra E, Celeiro M, Lamas JP, Llompart M, Garcia-Jares C (2015) Determi-nation of dyes in cosmetic products by micro-matrix solid phase disper-sion and liquid chromatography coupled to tandem mass spectrometry. J Chromatogr A 1415:27–37
13. Hidayah N, Abu Bakar F, Mahyudin NA, Faridah S, Nur-Azura MS, Zaman MZ (2013) Detection of malachite green and leuco-malachite green in fishery industry. Inter Food Res J. 20:1511–1519
14. Lian Z, Wang J (2012) Molecularly imprinted polymer for selective extraction of malachite green from seawater and seafood coupled with high-performance liquid chromatographic determination. Mar Poll Bull. 64:2656–2662
15. Vachirapatama N, Mahajaroensiri J, Visessanguan W (2008) Identification and determination of seven synthetic dyes in foodstuffs and soft drinks on monolithic C18 column by high performance liquid chromatography. J Food Drug Anal. 16:77–82
16. Mitrowska K, Posyniak A, Zmudzki J (2008) Determination of malachite green and leucomalachite green residues in water using liquid chroma-tography with visible and fluorescence detection and confirmation by tandem mass spectrometry. J Chromatogr A 1207:94–100
17. Ghasemi E, Kaykhaii M (2016) Application of micro-cloud point extraction for spectrophotometric determination of malachite green, crystal violet and rhodamine B in aqueous samples. Spectrochim Acta A Mol Biomol Spectrosc 164:93–97
18. Hashemi SH, Kaykhaii M, Tabehzar F (2016) Molecularly imprinted stir bar sorptive extraction coupled with high performance liquid chromatogra-phy for trace analysis of naphthalene sulfonates in seawater. J Iran Chem Soc 13:733–741
19. Khajeh M, Kaykhaii M, Mirmoghaddam M, Hashemi H (2009) Separation of Zinc from aqueous samples using a molecular imprinting technique. J Environ Anal Chem. 89:981–992
20. Khajeh M, Kaykhaii M, Hashemi H, Mirmoghaddam M (2009) Imprinted polymer particles for iron uptake: synthesis and analytical applications. Polym Sci Ser B. 51:344–351
21. Zou T, He P, Yasen A, Li Z (2013) Determination of seven synthetic dyes in animal feeds and meat by high performance liquid chromatography with diode array and tandem mass detectors. Food Chem 138:1742–1748 22. López-Jiménez FJ, Rubio S, Pérez-Bendito D (2010) Supramolecular
sol-vent-based microextraction of Sudan dyes in chilli-containing foodstuffs prior to their liquid chromatography-photodiode array determination. Food Chem 121:763–769
23. Tang B, Xi C, Zou Y, Wang G, Li X, Zhang L (2014) Simultaneous determina-tion of 16 synthetic colorants in hotpot condiment by high performance liquid chromatography. J Chromatogr B Anal Technol Biomed Life Sci 960:87–91
24. Cioni F, Bartolucci G, Pieraccini G, Meloni S, Moneti G (1999) Develop-ment of a solid phase microextraction method for detection of the use of banned azo dyes in coloured textiles and leather. Rapid Commun Mass Spectrom 13:1833–1837
25. Yan H, Qiao J, Pei Y, Long T, Ding W, Xie K (2012) Molecularly imprinted solid-phase extraction coupled to liquid chromatography for determina-tion of Sudan dyes in preserved beancurds. Food Chem 132:649–654 26. Bişgin AT, Narin İ, Uçan M (2015) Determination of sunset yellow (E 110)
in foodstuffs and pharmaceuticals after separation and preconcentration via solid-phase extraction method. Int J Food Sci Technol 50:919–925 27. Li JR, Sculley J, Zhou HC (2012) Metal-organic frameworks for separations.
Chem Rev 112:869–932
28. Safaei Moghaddam Z, Kaykhaii M, Khajeh M, Oveisi AR (2018) Synthesis of UiO-66-OH zirconium metal-organic framework and its application for selective extraction and trace determination of thoriumin water samples by spectrophotometry. Spectrochim Acta A Mol Biomol Spectrosc 194:76–82
29. Wang LH, Wang MY, Yan HY, Yuan YN, Tian J (2014) A new graphene oxide/polypyrrole foam material with pipette-tip solid-phase extrac-tion for determinaextrac-tion of three auxins in papaya juice. J Chromatogr A 1368:37–43
30. Sun N, Han YH, Yan HY, Song YX (2014) A self-assembly pipette tip graphene solid-phase extraction coupled with liquid chromatography for the determination of three sulfonamides in environmental water. Anal Chim Acta 810:25–31
31. Kumazawa T, Hasegawa C, Lee XP, Hara K, Seno H, Suzuki O, Sato K (2007) Simultaneous determination of methamphetamine and amphetamine in human urine using pipette tip solid-phase extraction and gas chroma-tography-mass spectrometry. J Pharmaceut Biomed. 44:602–607 32. Sharma P, Singh L, Dilbaghi N (2008) Optimization of process variables
for decolorization of disperse yellow 211 by Bacillus subtilis using Box– Behnken design. J Hazard Mater 164:1024–1029
33. Yetilmwzsoy K, Demirel S, Vanderbei RJ (2009) Response surface mod-eling of Pb(II) removal from aqueous solution by Pistacia vera L.: Box– Behnken experimental design. J Hazard Mater. 171:551–562 34. Sargazi G, Afzali D, Ghafainazari A, Saravani H (2014) Rapid synthesis of
cobalt metal organic framework. J Inorg Organomet Polym 24:786–790 35. Hosseinpour V, Kazemeini M, Mohammadrezaee A (2011) Optimization of Ru- promoted Ir- catalyzed methanol carbonylation utilizing response surface methodology. Appl Catal A 394:166–175