WordBytes: Exploring an Intermediate
Constraint Format for Rapid
Classification of Student Answers on
Constructed Response Assessments
Kerry J Kim
SimBiotic Software, Inc [email protected]
Eli Meir
SimBiotic Software, Inc [email protected]
Denise S Pope
SimBiotic Software, Inc [email protected]Daniel Wendel
Massachusetts Institute of Technology
1.
I
NTRODUCTION1.1. TRADEOFFS BETWEEN HIGH- AND LOW-CONSTRAINT ASSESSMENTS
Highly-constrained questions such as multiple choice (MC) are widely used in education for both formative and summative assessments, and can be reliable indicators of student knowledge and misconceptions (Smith et al., 2008). As formative assessments, they enable a student to receive instant feedback, which is known to aid learning (Shute, 2008; Black and William, 1998). However, MC questions provide poor measures of higher-level thinking and some learning outcomes in science courses (Nehm et al., 2012; AAAS, 2011). Additionally, MC provide only coarse-grained measures of student understanding that poorly capture how many students learn science (National Research Council, 2001; Vosniadou, 2008).
Low-constraint questions, like written open response (OR), provide much more detailed insight into student thinking (Beggrow et al., 2014). Student thinking about higher-level tasks such as problem solving and scientific explanation/application are better measured with short open response questions than MC (Batistta et al., 2010; Nehm et al., 2012). These questions better represent real-world tasks where students are forced to construct an answer rather than picking from a handful of predefined choices.
Open response questions require far more instructor time to grade compared to MC and are difficult to scale to large classes or student populations. Automated classification of OR answers is possible using various machine learning algorithms. Development of such classifiers is time-consuming, usually requiring humans to classify hundreds or thousands of answers as a training set for a machine learner. Automated classification often bins answers into just a few categories (e.g. Nehm et al., 2012), resulting in less specific feedback for each student than would be found with instructor grading. Classification around many key concepts is possible (Moharreri et al., 2014), but requires large training sets. Because of these issues, OR questions are particularly difficult to use for formative assessment. Instructor grading results in a long delay between the student doing the work and receiving feedback and fewer opportunities to use such questions because of the effort involved.
Here we ask whether there is a middle ground between those two extremes that can capture some of the benefits of each – rapid development of automated classifiers from highly constrained formats such as MC, and the insight into student understanding from low-constraint formats such as OR. In this paper we address the technical feasibility of using a new intermediate constraint (Scalise and Gifford, 2006) format to capture those benefits. A future paper (Wendel et al., in prep) will explore how students interact with and learn from intermediate constraint formats.
1.2. WORDBYTES: INTERMEDIATE-CONSTRAINT ASSESSMENT
• Freedom to construct an answer • Thousands of possible answer choices
• Limited choice of vocabulary from which to construct an answer • Multiple ways to form correct and incorrect answers
• Possibility to construct an answer containing correct, incorrect or a mixture of concepts • Possibility to construct answers that were not anticipated by the question author
Certainly, other question formats could be developed that are in-between the WB constraint level and MC on one side, or OR on the other, but the level of constraint represented by WB is both novel (to our knowledge) and an interesting level of constraint in that it still allows a tremendous flexibility to the student. As we discuss in the conclusion, the details of our WB format surely influenced our findings, but some of the results reported here may apply to other question formats with a similar level of constraint.
However, compared to OR/MC, WB may have some disadvantages. Care must be taken to select tiles for composing the answer to allow students to answer with a variety of correct and incorrect statements, and thus WB questions take longer to author compared to OR or MC questions that cover the same concepts. Additionally, answers requiring a large and varied vocabulary or questions requiring long (multi-sentence) answers are likely a poor match for WB, as students may have difficulty parsing and effectively composing answers when choosing from many tiles or attempting to compose long answers.
We hypothesized that the constraint level in WB would reduce the answer space (range of possible answers) compared to OR but preserve a wide variety of student answers. A small answer space might allow us to quickly construct a classifier by bypassing or greatly reducing the number of training examples needed by machine learners, and in part because of this, allow us to classify answers into finer-grained categories to provide more specific feedback for each student. To test this, we made two WB questions in the domain of college evolutionary biology and tested different approaches to making an automated classifier. We tested classifiers using both machine-learning and human-specified rules. In this paper, we focus on these research questions:
1. Can we quantify how much WB constrains student answers? How many unique answers are there?
2. What is the performance of a human-specified prospective classifier generated without seeing student answers?
3. How many answers are needed for training a machine classifier for WB? 4. What are differences between machine and human graders? (Performance,
systematic error differences)
2.
B
ACKGROUND2.1. MACHINE CLASSIFICATION OF LOW-CONSTRAINT ASSESSMENTS
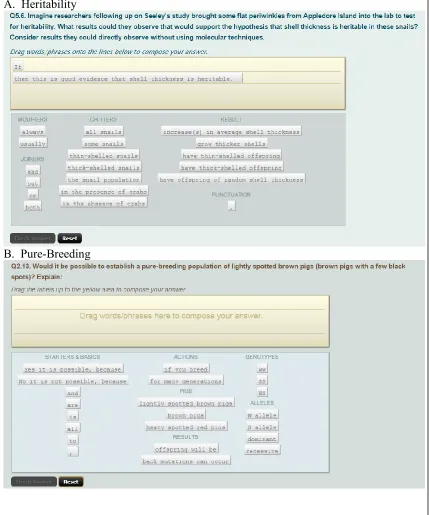
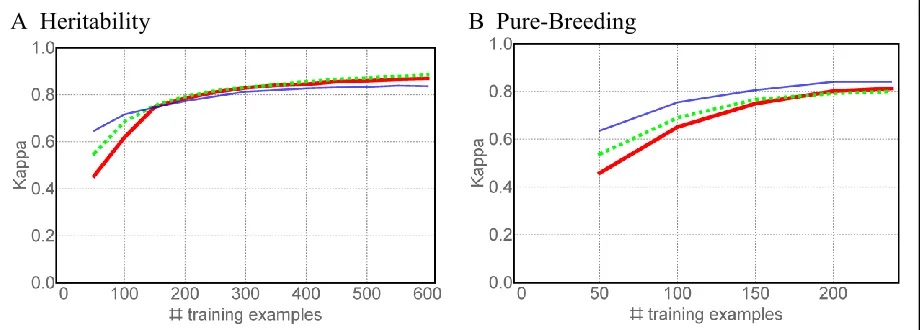
Figure 1: WordBytes questions on heritability of shell thickness (A) and pure-breeding of a heterozygous phenotype (B). Students construct an answer by dragging tiles from the bottom area to the upper answer area(yellow). Tiles can be used once, multiple times, or not at all in answers. In the Heritability question, there are pre-placed tiles which cannot be removed and bracket the start and end of the student’s answer.
A. Heritability
human error but automated classification is always consistent and can be as accurate as that achieved between different human graders using the same rubric (Klein, 2008; Yang et al., 2002; Ha el al., 2011). Computer-based assessments offer the possibility of providing instant feedback to student answers, which has been shown to improve student learning (Shute, 2008; Black and William, 1998).
Several programs have increased the accessibility of automated scoring to educators (Moharreri et al., 2014; Nehm et al., 2012; Nehm and Haertig, 2012; Ritthoff et al., 2001). These systems allow both efficient training of a variety of machine learning/classification algorithms and performance analysis of the classifier. As one example, Nehm et al. (2012) have used well-researched evolutionary biology questions targeted closely to specific misconceptions to develop classifiers that can identify answers with numerous different misconceptions or errors. Machine learners need numerous training examples for each category to generalize, however, so as the number of answer categories grows, the number of training examples usually increases as well.
There are numerous machine learning and classification systems (Romero et al., 2010). For questions such as ours that have a well-defined rubric, decision trees and support vector machines (SVM) have been used successfully (Nehm et al., 2012; Ha et al., 2012). Such algorithms require a training set of already-classified answers. Compared to humans, such systems do not ‘understand’ the student answer or parse logic, but rather search for sets of features that are general to answers of a given category. These classification algorithms are affected by the distribution of training answers but have been shown to successfully generalize across different schools at the college level (Ha et al., 2012).
3.
M
ETHODS3.1. STUDENTS AND PROCEDURES
We recruited instructors in United States colleges or universities to use SimBiotic Software’s “Mendelian Pigs” (Herron et al., 2014) or “Darwinian Snails” (Herron and Meir, 2014) labs in undergraduate introductory-level general or evolutionary biology courses over the course of two semesters. The labs were used as part of the regular coursework in each course. Each lab contained one WB question, which we label Heritability (Darwinian Snails – Fig 1A) and Pure-Breeding (Mendelian Pigs – Fig 1B). We collected student answers to these questions through a back-end called the SimUText System, built by SimBiotic Software to support those and other labs. We included students in the study only if they gave consent (via an ‘opt-in’ question at the start of the lab), and dropped any classes with fewer than five consenting students with non-empty answers. The data was collected in accordance with the MIT Committee on the Use of Human Subjects (COUHES #1206005102).
WordBytes (WB) questions prompt students to construct an answer by choosing and ordering tiles consisting of a limited set of words and phrases, as shown in Figure 1. Students are allowed to use tiles multiple times in their answer and are also free to omit any tiles. Tiles can be removed or rearranged after being placed in the answer area. The Heritability WB (Fig. 1A) has some pre-placed tiles (“If” and “then this is good evidence that shell thickness is heritable”) that could not be removed, and constituted the first and last tile in the student answers. The Pure-Breeding WB does not have any pre-placed tiles. Once students placed their tiles, they press the ‘check answer’ button to record their answer and receive feedback.
answer exceeds the visible answer area and that tells students their answer is too long (thus discouraging run-on sentences). While in principle WB could be used for multi-sentence answers, and we have experimented with this in other questions, the two WB questions here were designed to be answered with a single sentence, as dragging many tiles becomes tedious for students. Additionally, very long answers usually require more tiles and searching through a long list of tiles becomes burdensome.
Each of these WB questions went through a validation process with students. The Heritability question was based on an OR question that was previously part of the Darwinian Snails lab, however we did not have student answers to use in constructing the WB. We interviewed 31 students who each answered the question first as an OR, and then immediately afterward in the WB format. After every couple of students, the WB tiles were revised to add or remove tiles that might have helped each student give a similar answer in WB format to their answer in open response format. The tiles were held constant for the last 10 students to give a larger sample with the final wording.
The Pure-Breeding WB was built by examining answers to a previous open response question with a very similar stem. In part because of this prior data, the validation process was reduced. After internal review by several team members, the question was tested by three students in individual interviews where they went through the whole Mendelian Pigs lab. In each case, when the student reached the Pure-Breeding question, we had them first answer verbally, without looking at the available tiles. Then we compared their verbal answer to the answer they composed with the tiles. When the composed answer was conceptually different than the verbal answer, we asked the student to help us come up with changes to the tiles that would have allowed them to express their verbal answer better.
The Mendelian Pigs lab with the Pure-Breeding WB question was then released to classes for a year, and we used answers collected from approximately 80 students to further refine the question. One realization we had was that our initial number of tiles (35) was too large for most students to scan through easily. Consistent with this, we also observed frequent blank answers. We removed rarely-used tiles or tiles which were generally used only in nonsensical answers or in a single unique sentence that could be expressed differently. This reduced the number of tiles to 22. Student data from that version of the question is what is used here.
Across both semesters, we collected 404 unique first answers from 1131 students for the Heritability WB and 366 unique first answers from 495 students for Pure-Breeding. The number of unique answers is less than the number of students because multiple students would sometimes submit the same answer. Such a result is not surprising from the limited tile choice and length restriction. For clarity, when referring to student answers, we refer to answers
(first answers including repeats) to distinguish from unique answers, which has the repeats removed (union of the set of first answers).
The WB questions gave students automated feedback (through algorithms described below), and students could submit multiple answers to the question as they tried to develop a correct answer. These classifiers did not always correctly classify answers (resulting in feedback that did not address the student’s answer), and we changed the wording and details of the feedback between semesters. In this paper, we focus on quantifying the performance of various classifiers of student WB answers, and not how students responded to/learned from feedback. Thus, we analyzed only the first answer to remove the effect of feedback on subsequent answers.
students) from Spring 2014 and 494 students in 14 courses (range 8-125 students) from Fall 2014. The breakdown of students among courses, the level of each course (lower or upper), and school Carnegie Classification of Institutions of Higher Education™ (n.d.) is shown in Appendix Table A1.
3.2. HUMAN GRADING & CLASSIFICATION
Two of us specified a rubric for categorizing answers for the WB (EM for Pure-Breeding and DW for Heritability). Both were experienced in the teaching of and on misconceptions in evolutionary biology--though they were not instructors for any of the classes in our data.
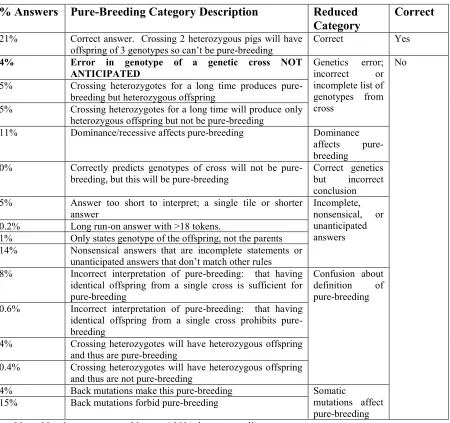
Table 1A: Categories used for classification of student answers for Pure-Breeding WB. Categories were further grouped by those sharing a common misconception (reduced category column) and correctness (correct column).
% Answers Pure-Breeding Category Description Reduced Category
Correct
21% Correct answer. Crossing 2 heterozygous pigs will have
offspring of 3 genotypes so can’t be pure-breeding Correct Yes 4% Error in genotype of a genetic cross NOT
ANTICIPATED
Genetics error; incorrect or incomplete list of genotypes from cross
No
5% Crossing heterozygotes for a long time produces pure-breeding but heterozygous offspring
5% Crossing heterozygotes for a long time will produce only heterozygous offspring but not be pure-breeding
11% Dominance/recessive affects pure-breeding Dominance affects pure-breeding 0% Correctly predicts genotypes of cross will not be
pure-breeding, but this will be pure-breeding
Correct genetics but incorrect conclusion 5% Answer too short to interpret; a single tile or shorter
answer Incomplete, nonsensical, or unanticipated answers 0.2% Long run-on answer with >18 tokens.
1% Only states genotype of the offspring, not the parents 14% Nonsensical answers that are incomplete statements or
unanticipated answers that don’t match other rules 8% Incorrect interpretation of pure-breeding: that having
identical offspring from a single cross is sufficient for pure-breeding
Confusion about definition of pure-breeding 0.6% Incorrect interpretation of pure-breeding: that having
identical offspring from a single cross prohibits pure-breeding
4% Crossing heterozygotes will have heterozygous offspring and thus are pure-breeding
0.4% Crossing heterozygotes will have heterozygous offspring and thus are not pure-breeding
4% Back mutations make this pure-breeding Somatic
mutations affect pure-breeding 15% Back mutations forbid pure-breeding
Each rubric assigns each student answer to exactly one category based on domain and integrative knowledge concepts. Tables 1A and 1B show the answer categories for the two questions. Both questions were used for formative assessment to aid student learning, so answer categories are fine-grained to provide specific feedback to the student about what is wrong with their answer. Such fine-grained feedback is a benefit we hypothesized might be aided by the constraints in the WB format, as opposed to broader categories generally used for scoring OR questions (e.g. as in Nehm et al., 2012 and others). Our categories are distinguished by the specific misconception or error with the student answer. Finally, the rubric indicated which answer category constituted a correct answer. Each answer category encompasses many possible student answer phrasings.
Table 1B: Categories used for classification of student answers for Heritability WB. Categories were further grouped by those sharing a common misconception (reduced category column) and correctness (correct column).
% Answers Heritability Category Description Reduced Category
Correct
21% Correct answer stating that thin snails have thin
offspring and thick snails have thick offspring Correct Yes 0.3% Stating that heritable if thick snails have thick offspring
or thin snails have thin offspring Incomplete, nonsensical, or unanticipated answers
No 17% Incomplete answer stating either thick snails have thick
offspring or thin snails have thin offspring but not both 0% Long run-on answer with >12 tokens
8% Nonsensical answers that are incomplete statements or
unanticipated answers that don’t match other rules
3% Vague answers ambiguous which snails produce what
offspring Natural selection
1% Both thin and thick shelled snails have offspring with same shell thickness
7% Confuses natural selection with heritability saying that predation favors thicker shells
6% Shell thickness is random Confusion about definition of heritable
7% Answer about presence or absence of crabs
14% Answer stating shell thickness changes over time
without mentioning crabs Acclimation 7% No mention of crabs and thin shelled snails produce
thicker shelled offspring NOT ANTICIPATED 10% Answer stating shell thickness changes over time when
crabs present
4% Snails have thick offspring when crabs are present
and/or thin when crabs are absent Directed inheritance
Note: Numbers may not add up to 100% due to rounding.
optional tiles. Both researchers realized they could not anticipate every single phrasing of different answers, so both rule sets contained a default category that captured answers that failed to match any rule. This category is assigned to both unanticipated answers and nonsense/vague answers since researchers could not conceive of rules to distinguish between these. Additional information on the rules is in appendix section 9.3.
The Heritability rubric and prospective rules (described below) were made without looking at any student answers, while the Pure-Breeding rubric and rules were made after the researcher briefly viewed a few dozen student WB answers. This may have inflated the performance of the Pure-Breeding classifier compared to that for Heritability. For clarity, we refer to these rules (made before collecting and grading many WB answers) as ‘prospective rules’ to distinguish them from machine classifiers, and from rules revised after researchers read and classified a semester’s worth of WB answers (as described later in results).
Human grading of student answers was performed as follows. We randomly picked 50 (Heritability) or 55 (Pure-Breeding) unique answers from the first semester. Two researchers graded these answers: one of whom wrote the prospective rules and the other was not involved in creation of the rules. To reduce researcher burden, researchers graded unique answers (skipping the need to repeat grading of the already seen answers). After discussing the rubric, the graders independently graded these initial 50-55 answers and then met to resolve any discrepancies. They then classified all the remaining unique answers from the first semester. Both researchers read the prospective rules, but classified according to what would best address the student’s answer (i.e. emulating a classroom instructor following a rubric; not trying to emulate a computer implementation of the prospective rules).
3.3. AUTOMATED GRADING & CLASSIFICATION
We used Rapidminer version 5.3 (http:/rapidminer.com; Hoffman and Klinkenberg, 2013; Ritthoff et al. 2001) for machine classification, validation, and parameter optimization. Word vector creation used each tile as a token (tiles were not split apart by word for tokenization). The comma tile was removed since human graders ignored its presence and it did not change the meaning of the answer. The LibSVM learner (Chang and Lin, 2011) received the following for input: word vectors composed of unpruned term occurrences for token bi-grams, total token count (number of tokens in answer), and human graded category (label).
We used the first semester of student answers as the training set, and explored the performance of J48 decision trees and support vector machines (SVM) using both the radial basis function (RBF) and polynomial (poly n=2) kernels. Since performance depends on kernel parameters (Chang and Lin, 2011; Hsu et al., 2003), and WB answers may have important statistical differences compared to free-form text, we performed a grid optimization that varied the following parameters over 5 log values from 0.01 to 100: C, epsilon, gamma, and coef0 (only for the polynomial kernel). Parameters were optimized by batch validating the training semester answers by course. We found the SVM using polynomial (n=2) kernel performed slightly better than the RBF kernel or J48 decision trees, though the difference was usually a few percent or less. Following parameter optimization on the first semester answers, we measured the performance of the SVM on the second semester of student answers.
optimization across all possible combinations, we did not find any of these to significantly increase performance or alter our conclusions and most changes resulted in decreased performance or increased training time without performance increase.
Further analysis, statistics, and visualization were performed in Mathematica (Wolfram Research) version 10.4.
4.
R
ESULTS4.1. HOW MANY UNIQUE ANSWERS ARE SUBMITTED TO WORDBYTES QUESTIONS?
Compared to OR questions, WB limit student choice of words and phrases to those available in the tiles. This eliminates some sources of variation in open responses: misspellings, verb conjugation, specific noun choice, synonyms, etc. There is still, however, a very large potential answer space. In practice, how large is the student answer space?
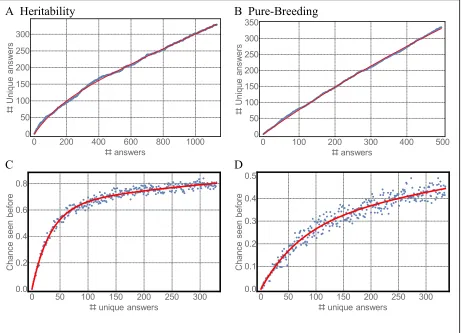
There is a discrepancy between the two WB in how often answers were repeated. We collected almost as many unique (distinct) answers from the Pure-Breeding question as from Heritability, despite having over double the number of students. To estimate the amount of answer variation in the two WB independent of sample size, we used a bootstrap method to estimate the average number of unique answers from a given subsample of students as shown in Figure 2A and B. Had the Heritability sample size equaled Pure-Breeding (494 students), we would have about 185 unique answers, far fewer than the 366 unique answers observed. We fit saturating exponential functions to the two distributions (red lines), and the number of unique answers for Pure-Breeding WB grows more quickly and likely has a higher asymptote than for the Heritability WB.
The greater answer variation to the Pure-Breeding question may be partially due to tiles for both the genotype (WS, SS, WW) and phenotype (the corresponding pigmentation pattern). In some contexts, the two were effectively synonymous, but we included them because in some contexts they have subtle but important differences (i.e., a student says “brown pigs are WW”). Additionally, the pre-placed tiles in the Heritability WB constrained the student’s sentence structure, which may have contributed to the decreased variability.
A trivial approach to WB classification is a look-up table (LUT) to classify the most common answers. What size LUT is required for WB? To measure this, we plot the probability that a randomly-chosen student answer has been seen before if we have already seen X unique answers. Bootstrap estimates are shown in Figure 2C and D. For Heritability, we estimate a LUT with 300 unique answers will capture 80% of answers. However, collecting 300 unique answers requires 1000+ student answers, because some answers are repeated many times. The Pure-Breeding question would require thousands of answers to build a similarly accurate LUT. Thus, WB do not constrain student answers sufficiently for a LUT alone to be a practical classifier.
4.2. HOW MUCH TIME DOES SCORING WB ANSWERS TAKE?
since no additional changes to the rubric or categories were needed, and because graders did not re-grade answers that were already seen in the first semester.
Figure 2: Bootstrap analysis of repeated answers visualized two ways for Heritability WB (left column: A, C) and Pure-Breeding WB (right column: B and D). A and B show the average of 100 samplings (blue). The red line is best fit double (Heritability) or single (Pure-Breeding) saturating exponential. Blue markers C and D show the bootstrap estimate of the probability that an answer has been seen before if we collect a new student answer after seeing a given number of unique answers.
4.3. HOW ACCURATE ARE PROSPECTIVE RULES?
We had two researchers classify all answers according to the rubric as described in Methods. Inter-rater reliability between the human-assigned categories was calculated based on all but the initial 50-55 and is shown in the “Human IRR” column of Table 2. Values indicate inter-rater agreement using Cohen’s kappa statistic (Cohen, 1960; Bejar, 1991). Kappa represents average agreement rescaled so that chance agreement is 0, and complete agreement is 1. Kappa was calculated across all answers (including repeats), so the most common (repeated) answers are effectively weighted heavier.
Our categories also neatly divide answers into correct or incorrect answers, with one category corresponding to correct answers (Table 1). If we use this to simplify our classification into purely correct/incorrect, kappa increases substantially to 0.88 or higher as
A Heritability B Pure-Breeding
0 200 400 600 800 1000 0 50 100 150 200 250 300 answers U ni qu e an sw er s
0 100 200 300 400 500 0 50 100 150 200 250 300 350 answers U ni qu e an sw er s
C D
0 50 100 150 200 250 300 0.0 0.2 0.4 0.6 0.8 unique answers C ha nc e se en be fo re
0 50 100 150 200 250 300
shown in Table 2 (middle rows, ‘Correctness’). Comparing this to agreement on the exact classification, researchers almost always agreed on whether an answer was correct.
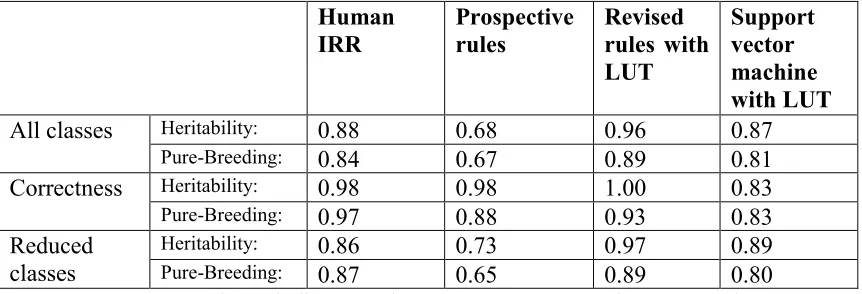
Table 2: Comparison of Categorizer Performance. Classification used categories from Table 1A and Table 1B.
Human IRR
Prospective rules
Revised rules with LUT
Support vector machine with LUT
All classes Heritability: 0.88 0.68 0.96 0.87
Pure-Breeding: 0.84 0.67 0.89 0.81
Correctness Heritability: 0.98 0.98 1.00 0.83
Pure-Breeding: 0.97 0.88 0.93 0.83
Reduced classes
Heritability: 0.86 0.73 0.97 0.89 Pure-Breeding: 0.87 0.65 0.89 0.80
Note: Human IRR column indicates Cohen’s Kappa measure of agreement between two human graders using the same rubric. Other columns indicate Cohen’s kappa between the specified classifier and the agreed class assigned by the two human graders.
The accuracy of the prospective rules is shown in Table 2. These researcher-generated rules were made prior to classifying the student answers. Kappa was calculated between the prospective rules classifier and the agreed category from the two researchers across all answers. Additional performance metrics are shown in Appendix Table A2. Performance of prospective rules for the full or reduced classes is substantially below that of the Human IRR for both WB. However, prospective rules performed well for assessing correctness, particularly for Heritability, with both WB having a kappa >0.8. Thus, researchers could make rules that could accurately identify correct answers before collecting and grading student answers, but the prospective rules were not as successful at categorizing answers into fine-grained categories.
The Human IRR and prospective rules kappa calculations differ slightly. In estimating the human IRR, we randomly drew from student answers to populate a list of ~50 unique answers for the first round of grading described previously. Answers that were more common had a higher probability of appearing in this list. The Human IRR removes these ~50 from the calculation (since this was the learning period for the researcher graders), so is depleted of the most common and slightly easier to grade answers. Removing these same answers from the calculation of the prospective rules results in a decrease in kappa by about 5% for full and reduced categories. Both sets of researchers reported that less common answers (those with fewer or no repeats between students) were more often difficult to interpret/classify. Thus, when comparing the performance of various grading strategies to the human IRR, the human IRR would be slightly better performing after accounting for the ease of grading the more common answers.
In addition, researchers were unable to anticipate all types of student answers for existing categories. For Pure-Breeding, most (>80%) misclassifications were due to unanticipated answers failing to match anticipated phrasings, resulting in assignment to the default category. For Heritability, most (>50%) misclassifications were due to unanticipated answers from the bottom two categories in Table 1B being misclassified due to other classes having overly general rules. Both resulted in student answers not being assigned to a category that would provide useful feedback to the student.
Development of the Heritability rubric and rules took about 5 hours, while Pure-Breeding took about 3 hours. We do not include implementation time, as we imagine that additional development of WB would result in the creation of an efficient notation for implementing rules. It is likely that if more time was spent carefully generating rules, the performance would improve. Since our goal was to examine whether an instructor could quickly specify grading without collecting hundreds of student answers, we deliberately kept this time short.
4.4. WOULD REDUCING THE NUMBER OF CATEGORIES IMPROVE CLASSIFICATION ACCURACY?
One goal of the WB format is to provide fine-grained feedback to students. Thus, the number of categories in our rubrics (16 for Pure-Breeding; 14 for Heritability) were more than typical open response question graders which focus on fewer general misconceptions or confusions. For instance, Nehm et al. (2012) have open response questions in the same domain of biology and use three categories representing understanding of variation, heredity and survival, and were able to train an SVM with high accuracy (kappa > 0.8). Perhaps performance would have improved had we had fewer, more general categories as in open response question graders, rather than the large number of categories listed in the second columns of Tables 1A and 1B. To investigate this, we merged existing categories by grouping them together by their shared common mistake or misconception as shown in Tables 1A and 1B (labeled as ‘reduced category’). This was performed after all student answers were graded by researchers, so this reduction was informed by looking at student answers. We then calculated kappa using the reduced classes. An increase in kappa for the reduced categories compared to the full set of categories would indicate that researchers tended to agree on the more general classification of the answer, but disagreed about the detailed classification. However, kappa changed little, indicating that disagreement was about the general concept, not in distinguishing between conceptually similar categories.
Taken together, our graders had almost complete agreement on the correctness of an answer, and lower agreement for more granular categories. It does not appear that having a highly granular classification hurt kappa, since our reduced categories did not improve agreement.
4.5. HOW WELL CAN RESEARCHER-DEVELOPED RULES CLASSIFY ANSWERS AFTER SEEING SOME STUDENT ANSWERS?
answers. The revised rules perform much better, with the LUT adding about 0.10 to kappa for the full- and reduced classes graders, and the remaining improvement from the rules themselves.
4.6. HOW WELL DOES A MACHINE-LEARNING CLASSIFIER WORK ON WB?
We used one semester of student answers for machine classifier training, then measured performance on the other semester. Due to the repetition of some student answers, many (but not all) answers appeared in both the training and testing semesters.
The performance of machine classifiers depends on parameters controlling mismatch penalty and strength of fitting. We performed a grid parameter search to optimize performance when categorizing the batch validated training semester answers as described in Methods. We tested J48 decision trees, and support vector machines with radial basis vector and polynomial (degree 2) kernels. Of these, an SVM with polynomial kernel consistently had the highest accuracy and kappa for categorizing the testing semester answers.
Table 2 shows the performance of an LUT and SVM with polynomial kernel trained and optimized on answers from the first semester that was used to classify answers from the second semester. Kappa was again calculated between the machine classifier and the agreed category from the two researchers across all answers. We used this partitioning of training and test sets for a better comparison to the performance of the revised rules where the first semester answers were used to ‘train’ the human grader for revising.
To explore the effect of training size on performance, we trained the SVM on a randomly chosen subset of training semester answers. We also include an LUT (using the same subset of answers as in each random training example) since our goal is to maximize performance and because an LUT is both trivial to implement and can only improve classification.
Figure 3: Support vector machines were trained on a subset of student answers from one semester and used to classify the other. The x-axis shows the number of training examples; y-axis is Cohen’s kappa showing agreement between SVM + LUT and the human-assigned class. Plots are an average of 100 random samplings for each sample size. Thick red line = all categories, dotted green = reduced categories, thin blue = correct/incorrect classification (correctness).
Figure 3 shows the performance of the LUT + SVM for different training sizes. Each data point is an average of 100 random samplings. The different traces indicate the different granularities of classification: red trained on the full set of categories, green was trained on answers labeled by the reduced set, and blue trained on answers labeled correct/incorrect. For both WB, having fewer categories (green line) improved kappa when the training set was small, but as training sets grow larger the performance with the full set of categories (red) quickly catches up.
Ideally, machine classifiers generalize from the training data so they can classify novel answers not seen before. The SVM performed very well on the answers that were present in the training set, with almost all (>90%) of the category mis-matches on answers not in the training set. The LUT only about 1% improvement for the SVM classifier kappa for >100 training examples, indicating possible overfitting. Perhaps our training conditions overfit the training data and we can alter training conditions to generate a classifier to generalize better. Such a grader could be combined with an LUT for possibly better performance. To test this, we removed repeated answers from the training semester to include only the unique answers in the training set. We then optimized parameters using 10-fold stratified crossvalidation, and measured the combined performance of the SVM and LUT. For both WB, this decreased kappa, so training on unique answers to reduce overfitting does not improve performance.
5.
D
ISCUSSION5.1. WB CONSTRAINTS STILL ALLOWS STUDENTS TO CONSTRUCT ANSWERS AND EXPRESS MANY IDEAS
Compared to OR, the WB question format reduces the number of distinct student answers, while still allowing thousands of potential answers. Students could frame correct ideas in different ways, as we observed more than 20 unique correct answers for both questions. Similarly, most categories and all reduced categories had many unique answers. However, there were a sufficient number of answers that an LUT alone would be impractical for categorizing student answers.
Both WB questions constrained students to answer with single-sentence answers. We cannot measure what effect this constraint had on student answers, though the questions were designed to be easily answerable with one sentence. We anticipated that one sign that this constraint was troublesome would be if students started submitting long answers with many tiles in run-on answers. Such answers were not observed in the Heritability WB, and very rarely seen in the Pure-Breeding WB. While this does not prove that one sentence was not onerous to the student, those that answered the question submitted answers without using an excessively long sentence.
5.2. PROSPECTIVE GRADERS CAN BE QUITE ACCURATE AT CATEGORIZING CORRECT / INCORRECT ANSWERS BUT LESS SO AT MORE FINE-GRAINED CLASSIFICATION
One hoped-for advantage of intermediate constraint question formats is that they reduce the time between developing a new question and being able to provide students with feedback. To automatically score an open response question, one must first collect hundreds of student answers for training a machine classifier (Nehm et al., 2012). Our data indicate that classifying WB answers as correct/incorrect can be done with reasonable accuracy without collecting student answers, as our prospective rules performed as well as human graders for the Pure-Breeding WB, and the kappa of 89% for the Heritability WB corresponds to an accuracy of over 98%. These kappa values are in the top quintile (80-100%) considered ‘almost perfect’ (Krippendorff, 1980; Landis and Koch, 1977), and are in a similar range reported by open response machine classifiers (Nehm et al., 2012). These kappa values compare favorably to other reports of human inter-rater reliability and automated classification (Nehm et al., 2012; Ha et al., 2012). These results indicate that students using WB could be provided with some feedback right from the start, meaning that the first group of students to use a new question would still receive some benefit.
Prospective rules for finer-grained classification produced much lower accuracy, but in some circumstances, they may be useful if a kappa of ~60-70% is acceptable (i.e., if students know that feedback is experimental and they will not be penalized for classification errors, or for an instructor trying to identify common problems/misconceptions in a large class). We did not test how the addition of each additional category to the rules would affect accuracy, but given the promising result with a binary correct/incorrect classification, we speculate that it might be possible to make accurate prospective rules to classify an answer amongst 3 (or maybe 4) categories, corresponding to correct, misconception 1, other incorrect.
Complicating the performance of the prospective grader is the effect of the number and makeup of the available tiles. If we reduce the number of tiles sufficiently, the number of possible answers will shrink to the point that a researcher could fairly easily make prospective rules with high (or perfect) accuracy for all likely misconceptions or errors. Conversely, if we greatly expanded the number of tiles, it would not be surprising to eventually reach a point where we were unable to make prospective rules that would distinguish between correct/incorrect with high accuracy. The number of tiles used in our two WB questions may be close to the maximum size of a tile set, as we observed during interviews that additional tiles rapidly resulted in a tile set that was cumbersome to use for answer construction.
Our estimates for the performance of prospective rules may overestimate the performance of a typical instructor for specifying rules. Both researchers were experienced computer programmers and teachers, and for the Pure-Breeding WB, the researcher did glance at some student answers before specifying rules, albeit several months prior to constructing the rules (thus, the prospective rules were not completely uninformed of student answers). Thus, for our WB questions, prospective rules may allow only correct/incorrect determination with reasonable accuracy.
5.3. WRITING WORDBYTES IS TIME-CONSUMING
additional time, but it is unclear how much improvement would be gained by, say, increasing the amount of time generating prospective rules to 8 hours. Since the revised rules (after seeing some student answers) performed better than the SVM in all cases and took less than 5 additional hours to revise and grade, perhaps the best use of researcher time would be to spend some time collecting a few dozen (or more) student answers (or soliciting TAs to generate student-like surrogate answers) after making the prospective rules and use these to revise the rules.
In addition to this, substantial time and effort were required to write the WB question and select the tiles. Each question took at least 1-3 days of researcher time to write the question, validate with students, and revise the tiles. Too few tiles may constrain the student to be unable to express certain misconceptions, while too many make the process of answer construction laborious. The time spent making the question and deciding on tiles was not included in our time budget for making the prospective rules, though this does represent additional researcher time invested in making WB questions. While researchers making OR questions certainly are anticipating and thinking about different possible student answers, WB requires additional time/effort in selecting tiles for the student’s answer as well as verifying the student can successfully use the tiles to construct a range of meaningful answers. We did not measure how much additional time WB question development would take compared to an identical/ similar question as OR, but a majority of the WB development time was spent on tile selection. It is possible that as we become more experienced writing WB questions, we may speed this process somewhat, but authoring WB will still likely require substantially more time than OR.
OR graders usually require the collection and human scoring of several hundred to thousands of answers for automated scoring by machine learning systems (Nehm et al., 2012; Romero et al., 2010). The collection and human-scoring of the answers is probably the most time-consuming part of this approach, as environments such as LightSide (Mayfield et. al., 2014) and Rapidminer (Hoffman and Klinkenberg, 2013) allow the rapid training of machine learners. Additionally, significant student time is required to generate these answers. We did not have data to compare whether human grading of WB questions was faster or slower than similar OR questions, but based on our experience grading similar OR questions, we do not consider WB questions to be hugely different in the time requirements to grade. Grading hundreds to thousands of answers to train a machine learner for OR questions takes at least 1-2 days of instructor time, comparable to the additional time required for selecting WB tiles. Thus, WB do not offer faster development of SVM classifiers because many hundreds of human-scored unique answers are still required for training.
WB offers the possibility of being able to rapidly create an instructor-generated prospective grader for correctness after the question is authored. Our prospective rules for correctness had high kappa (in the ‘nearly perfect’ range > 0.8 compared to human graders) for both WB, and did not require collection and scoring of answers. Our time estimates of 3-5 hours for generating prospective rules and rubrics was for the fine-grained categories. We did not separately track the time spent developing just the correctness rules, but since these are a small subset of the prospective grader, making prospective rules for correctness alone likely would require far less time.
the answers. Thus, WB may offer slight time savings for developing a correctness classifier compared to OR, but not for finer-grained classification that required scoring large numbers of student answers for accurate classification (LUT + revised rules or SVM).
Might a prospective rules approach work for classifying OR answers? Nehm and Haertig (2012) used SPSS text analysis (SPSSTA, SPSS Inc. 2006) to generate prospective rules (without seeing student answers) for questions on natural selection. The grader in SPSSTA required specifying term libraries for evolutionary biology and many iterations to implement rules, requiring hundreds of hours of researcher time, so this approach for scoring OR is slower than training a SVM (Nehm and Haertig, 2012). However, their grader also generalizes fairly well to similar questions using different systems, and assesses several key concepts. Had they focused on a single OR question with fewer key concepts, which is similar to WB questions, generation of the grader would likely have been faster, but we consider it unlikely that this approach would be as fast as the 3-5 hours we spent on our prospective WB graders.
5.4. SUPPORT VECTOR MACHINE PERFORMANCE ON WORDBYTES IS SIMILAR TO THAT ON OPEN RESPONSE QUESTIONS
For building a machine-learning automated classifier, the WB constraints do not produce an answer set that requires dramatically fewer training examples compared to OR. In all cases, hundreds of training examples are needed to approach a kappa of 80%, and sometimes hundreds more to approach the performance of the inter-human classification or the revised human classifiers. Our conclusions are unchanged if we reverse the training and testing semesters so this does not appear to be an artifact of differences in student population or usage environment between semesters (differences in classifier size, changes in student skill level between schools, etc). Thus, our hypothesis that WB would allow training of a machine classifier with dramatically fewer examples or less effort is not supported by our data.
While the WB succeeded in reducing the number of possible answers, it also had the effect of reducing the efficiency in collecting unique student answers for training. For machine classifiers to successfully generalize training answers to correctly classify novel answers usually requires several hundred examples (Nehm et al., 2012; Romero et al., 2010). Unfortunately, collecting answers from several hundred students yielded far fewer unique answers, so WB may effectively increase the number of students (or collected answers) that are required to train the classifier due to the duplication.
Comparing the performance of the SVM+LUT classifier with the revised rules indicates that researcher time would be better spent revising the prospective rules rather than grading additional answers for training the SVM. The time burden of grading an additional semester’s worth of answers and revising the rules is similar, but revised rules have a larger increase in accuracy. Thus, the WB constraints appear to allow a human, but not a machine learner (SVM or decision tree), to more efficiently specify rules for grading.
6.
C
ONCLUSIONWB questions offer a promising compromise between constraint and student freedom where students have the freedom to construct a wide variety of correct and incorrect answers, producing answers that the question authors did not anticipate. However, WB questions require much more time to author than similar MC or OR questions.
It is unlikely that every WB question would have similar success in grading with prospective rules. Both of our questions had fairly directed question stems with single sentence answers. More open-ended questions (i.e., “Suggest a perturbation to a system and its effects”, “Specify a hypothesis and how you might test it”) or those requiring many sentence answers may be more difficult to grade. Our use of fixed pre-placed tiles further constrained answers and likely simplified the prospective rules. For writing prospective graders, we realized some tiles were particularly problematic: tiles that were logical-NOT tiles (i.e. “never”, “not”) would likely increase the complexity of rules. Our questions were answerable without these tiles, and such logical-NOT tiles were not present in our questions analyzed here.
Often student answers contain a mixture of correct and incorrect ideas (Nehm et al., 2012) or multiple incorrect ideas, and while the WB questions allow for answers that do have this mix, building a classifier to give useful feedback would require the time-consuming step of collecting student answers. Additionally, WB questions require substantial effort and iteration to choose tiles to allow a variety of answers without becoming cumbersome. Questions that require a diverse vocabulary would not mix well with WB questions (i.e. “Name a species and explain how it does X”). Finally, we focused on questions that were modified from OR questions, developing novel WB questions may pose additional challenges.
WB additionally have the limitation that vocabulary is given to the student in the tiles. Struggling students who are unfamiliar with the tile words may have difficulty using these words to compose an answer, while other students might be prompted by the tile words to give a different answer than on a pure OR question. We have not attempted to measure or quantify these effects, but are investigating how students interact with WB questions in a future study.
How do WB compare with and possibly generalize to other similar intermediate constraint questions? While we did not do a direct comparison between WB and other intermediate constraint (or MC) questions, there are a wide variety of such questions (Scalise and Gifford, 2006), so here we focus on those that are similar to WB. Specifically, we focus on formats that require the student to attempt to construct a short plain-language answer, or involve the assembly of an answer by arranging fixed tiles.
A number of question types allow the student to construct a sentence in a format that is more constrained (smaller answer space) than WB. In assembling proof questions (Scalise and Gifford, 2006; Bennett, 1993), students choose from a list of (usually already ordered) phrases to construct a statement about a chain of reasoning. Similarly, intralinear questions (Scalise and Gifford, 2006) are composed of a sentence with multiple drop-downs for selecting words or phrases for completing a sentence. These question types allow for multiple correct answers. A LUT or prospective rules should be sufficient to accurately score these question types, as an intralinear with 3 drop downs or an assembling proof with 8 phrases would allow up to a few hundred answers. However, the constraints of these questions dramatically limit flexibility in answer construction compared to WB, and in a future paper, we will explore how well WB allow students to express reasoning and mixed idea responses (Wendel et al., in prep) compared to those more constrained formats.
This format is perhaps closest to WB in terms of answer space. Some applications allow students to generate concept maps (Luckie et al., 2008) with automated classifiers that grade by generalizing from a list of correct answers using synonyms and network structure. This approach allowed successful grading of only a fraction (< 1/3) of student answers, and we imagine that our success with prospective rules would have a much lower success rate, since instructors cannot anticipate all student-typed phrases or concepts.
A more complex approach is used in Betty’s Brain (Leelawong and Biswas, 2008) where students both construct concept maps and interact with a computer teacher that provides feedback to the student’s natural language responses in an ongoing dialogue. Feedback for this involves using the concept map as a model and the dialogue involves working through the predictions of this model. For some types of WB questions, it may be possible to similarly treat the student’s answer as a model for generating predictions that could be used for feedback to the student. This approach is one we did not explore, as it would require different question stems, but is distinct from machine learning or human-based rules and an intriguing different approach.
Our long-term goal with the WB questions is to allow students to iterate their answers with useful feedback in order to increase student learning. We did not explore this here, but will in an upcoming paper (Wendell et al., in prep). Useful feedback will require fine-grained classification of student answers beyond correct/incorrect, and this combined with the effort in developing WB questions does make them an expensive question type to develop. Overall, we find that the WB format offers some novel trade-offs between constraint and grading.
7.
A
CKNOWLEDGMENTSWe thank Jody Clarke-Midura, Susan Maruca, Jen Palacio, Joel K. Abraham, Ryan S. Baker, Eric Klopfer, Ross H. Nehm, and Kathryn E. Perez for discussions and advice. We thank Steve Allison-Bunell, Erik Harris, Rob Ryan, Jeremy Penning, Derek Stal, and Jennifer Wallner for technical assistance and programming support. We thank Jen Palacio for discussions and grading. We thank the instructors and students who participated in this study. This work was supported in part by the National Science Foundation under Grant #1227245.
8.
R
EFERENCESAMERICAN ASSOCIATION FOR THE ADVANCEMENT OF SCIENCE (AAAS). 2011. Vision and change
in undergraduate biology education. AAAS, Washington, DC.
BEGGROW E. P., HA M., NEHM R. H., PEARL D., AND BOONE W. J. 2014. Assessing scientific practices using machine-learning methods: How closely do they match clinical interview performance? Journal of Science Education and Technology, 23, 160-182.
BEJAR I. I. 1991. A methodology for scoring open-ended architectural design problems.
Journal of Applied Psychology, 76, 4, 522-532.
BENNETT R.E. 1993. On the meaning of constructed response. In Bennett R. E., Ward W. C. (Eds.), Construction versus choice in cognitive measurement: Issues in constructed response, performance testing, and portfolio assessment. Lawrence Erlbaum Associates. Hillsdale NJ. 1-27.
CHANG C. C. AND LIN C. J. 2011. LIBSVM: A library for support vector machines. ACM Transactions on Intelligent Systems and Technology, 2, 3, 27.
COHEN J. 1960. A coefficient of agreement for nominal scales. Educational and Psychological
Measurement, 20, 1, 37-46.
HA M., NEHM R. H., URBAN-LURAIN M., AND MERRILL J. E. 2011. Applying Computerized Scoring Models of Written Biological Explanations across Courses and Colleges: Prospects and Limitations. CBE Life Science Education, 10, 379.
HA M. AND NEHM R.H. 2016. The impact of misspelled words on automated computer scoring: a case study of scientific explanations. Journal of Science Education and Technology, 25, 3, 358.
HERRON J.,ABRAHAM J., AND MEIR E. 2014. Mendelian Pigs. Simbio.com.
HERRON J. AND MEIR E. 2014. Darwinian Snails. Simbio.com.
HOFMANN M. AND KLINKENBERG R. (eds) 2013. RapidMiner: Data mining use cases and business analytics applications (Chapman & Hall/CRC Data Mining and Knowledge Discovery Series), CRC Press.
HSU C.W.,CHANG C.C., AND LIN C.J. 2003. A practical guide to support vector classification. https://www.cs.sfu.ca/people/Faculty/teaching/726/spring11/svmguide.pdf
KLEIN S. P. 2008. Characteristics of hand and machine-assigned scores to college students’ answers to open-ended tasks. In Nolan D. Speed T. (Eds.) Probability and statistics: Essays in Honor of David A. Freedman. Beachwood, OH. 76-89.
KLOPFER E. 2008. Augmented learning: Research and design of mobile educational games. MIT Press, Cambridge, MA.
KRIPPENDORFF K. 1980. Content analysis: An introduction to its methodology. Sage Publications.
LANDIS J.R. AND KOCH G. G. 1977. The measurement of observer agreement for categorical data. Biometrics, 33, 159-174.
LEELAWONG K. AND BISWAS G. 2008. Designing learning by teaching agents: The Betty’s Brain system. International Journal of Artificial Intelligence in Education, 18, 3, 181-208.
LUKHOFF B. 2010. The design and validation of an automatically-scored constructed-response
item type for measuring graphical representation skill. Doctoral dissertation, Stanford University, Stanford, CA.
LUCKIE D.B., HARRISON S.H., WALLACE J.L., AND EBERT-MAY D. 2008. Studying C-TOOLS: Automated grading for online concept maps. Conference Proceedings from Conceptual Assessment in Biology II, 2, 1, 1-13.
MAYFIELD E., ADAMSON D., AND ROSE C. P. 2014. LightSide researcher’s workbench user
manual.
MOHARRERI K.,HA M., AND NEHM R.H. 2014. EvoGrader: an online formative assessment tool for automatically evaluating written evolutionary explanations. Evolution: Education and Outreach, 7, 15.
National Research Council. 2001. Knowing what students know: The science and design of educational assessment, Washington DC: National Academies Press.
NEHM R.H.,HA M., AND MAYFIELD E. 2012. Transforming Biology Assessment with Machine Learning: Automated Scoring of Written Evolutionary Explanations. Journal of Science Education Technology, 21, 183.
QUINLAN R. 1993. C4.5: Programs for Machine Learning. Morgan Kaufmann Publishers, San Mateo, CA.
RITTHOFF O.,KLINKENBERG R.,MIERSWA I., AND FELSKE S. 2001. YALE: Yet Another Learning Environment. LLWA’01-Tagungsband der GI-Workshop-Woche Lehren-Lehren-Wissen Adaptivitat. University of Dortmund, Dortmund, Germany. Technical Report, 763, 84-92.
ROMERO C., VENTURA S., PECHENIZKLY M., AND BAKER R. S. 2010. Handbook of Educational Data Mining. CRC Press.
SCALISE K. AND GIFFORD B. 2006. Computer based assessment in E-Learning: A framework for constructing “intermediate constraint” questions and tasks for technology platforms.
Journal of Technology, Learning, and Assessment, 4, 6, 4-44.
SHUTE V.J. 2008. Focus on Formative Feedback. Review of Education Research, 78, 1, 153-189.
SMITH M. K.,WOOD W.B., AND KNIGHT J.K. 2008. The genetics concept assessment: A new concept inventory for gauging student understanding of genetics. CBE Life Sciences Education, 7, 4, 422-430.
SPSSINC. 2006. SPSS text analysis for surveys™2.0 user’s guide. SPSS Inc, Chicago, IL. THE CARNEGIE CLASSIFICATION OF INSTITUTIONS OF HIGHER EDUCATION. n.d. About Carnegie
Classification. Retrieved (Dec 15, 2016) from http://carnegieclassifications.iu.edu/ .
VOSNIADOU S. 2008. Conceptual Change Research: An Introduction. In Stella Vosniadou, ed.
International Handbook of Research on Conceptual Change. (first ed). New York/Abingdon: Routeledge, xiii-xxviii.
9.
A
PPENDIX1
9.1. STUDENT POPULATION
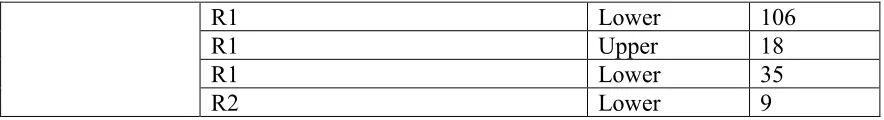
Table A1: Breakdown of students among courses in this study.
Semester/WB Carnegie Classification™ Course Level # students Fall 2014
Pure-Breeding
R1 Lower 91
R1 Lower 53
M1 Lower 21
Baccalaureate college: diverse fields Upper 12 Associate’s Colleges: High
Transfer-Mixed Traditional/nontraditional Lower 25
R1 Upper 35
Spring 2015
Pure-Breeding R1 M2 Lower Lower 13 17
M1 Lower 17
R2 Lower 8
R2 Upper 26
Associate’s Colleges: High Transfer-Mixed Traditional/nontraditional
Lower 26
R1 Upper 45
M1 Lower 15
Baccalaureate college: diverse fields Upper 11
R1 Upper 12
M1 Lower 34
R1 Lower 34
Spring 2014
Heritability M1 M1 Lower Lower 121 64
R1 Lower 58
R1 Lower 372
R1 Lower 22
Fall 2014 Heritability
R1 Lower 25
M2 Lower 24
R3 Lower 31
M1 Lower 26
M1 Lower 8
Associate’s Colleges: High Transfer-Mixed Traditional/nontraditional
Lower 10
R2 Lower 12
M1 Lower 42
R1 Lower 23
R1 Lower 106
R1 Upper 18
R1 Lower 35
R2 Lower 9
Note: Course level is lower for 100-200 level courses and upper for 300-400 level courses.
9.2. DETAILS OF PERFORMANCE OF DIFFERENT CLASSIFIERS
We primarily used kappa as a metric for grader performance, as it is has been used in several other studies, but here present additional metrics of the performance of the rule-based and SVM classifiers in Table A2. Mean precision and recall were averaged across all categories using equal weights. The classifiers and data sets were the same as Table 2 with the prospective rules averaged across both semesters. The revised rules with LUT and SVM with LUT were trained (training the SVM or used by human instructors to revise the prospective rules) on the first semester answers and tested against the second semester for a direct comparison between SVM and revised rules performance.
Table A2: Comparison of performance of classifiers from Table 2
Prospective rules
Revised rules with LUT
SVM with LUT
All classes
Heritability: Accuracy:Kappa: Mean recall: Mean precision 72% 0.68 57% 46% 96% 0.96 93% 95% 89% 0.87 83% 90%
Pure-Breeding: Accuracy: Kappa: Mean recall: Mean precision 71% 0.67 70% 68% 90% 0.89 81% 92% 83% 0.81 64% 66%
Correctness
Heritability: Accuracy:Kappa: Mean recall: Mean precision 99% 0.98 99% 100% 100% 1.0 100% 100% 98% 0.83 97% 87%
Pure-Breeding: Accuracy: Kappa: Mean recall: Mean precision 96% 0.88 92% 98% 98% 0.93 97% 97% 94% 0.83 92% 91%
Reduced
classes
Heritability: Accuracy: Kappa: Mean recall: Mean precision 80% 0.73 53% 45% 98% 0.97 96% 96% 92% 0.89 90% 89%
9.3. IMPLEMENTATION OF PROSPECTIVE AND REVISED RULES:
Here we give some examples of the researcher-generated rules used for revised rules (the prospective rules used the same approach). The two researchers worked independently to write the rules, though the researcher for the heritability WB had seen the rule sets for the pure-breeding WB. The two researchers used slightly different notations for the rules. For both WB rule sets, the vertical slash | character denotes the tile border/delimiter.
For both WB, the rule sets assigned each answer to only 1 class according to the first rule match. Since the order of rule application could influence classification, instructors had to also consider the order of rule application in addition to the rules themselves when constructing the grader. A single class could have one or more rules to allow for different phrasings and word order choices, as it was not always possible or practical to account for all answers in a single rule. In the examples below, we present a few illustrative rules as example, but we do not provide the entire rule set that consisted of several dozen rules or the order they are applied.
9.3.1. Pure-Breeding WB examples
For all answers, the comma tile was removed prior to rule application. Some rules simply tested for the presence of one or several tokens in the answer. For example, the rule corresponding to last category in Table 1A matched any answer containing the tiles “Yes it is possible because” and “back mutations can occur”.
More complicated rules had to account for tile synonyms and the presence of optional tiles. Here is an example rule for the 4th category in Table 1A:
ans.match('No it is not possible, because|[if you
breed]|(lightly spotted brown pigs|WS)|for many
generations|[all]|offspring will be|(lightly spotted brown pigs|WS)')
Many rules required accounting for alternate word orderings, treating “WS|and|SS” synonymously with “SS|and|WS”. An example rule used for correct answers (first category of Table 1A):
ans.match('No it is not possible, because|offspring will be|{(lightly spotted brown pigs|WS)|[and]|(brown
pigs|WW)|[and]|(heavy spotted red pigs|SS)}|[if you breed]|[lightly spotted brown pigs|WS]|[and]|[lightly spotted brown pigs|WS]|[for many generations]')
Curly bracketed items require all enclosed items to be present, but in any order. The curly brackets can contain optional (square bracketed) tiles and synonymous (parenthesis bracketed) tiles. Thus, the {(lightly spotted brown pigs|WS)|[and]|(brown
pigs|WW)|[and]|(heavy spotted red pigs|SS)} in the above rule would
match “WW|WS|and|SS” as well as “lightly spotted brown pigs|and|WW|and|SS”.
9.3.2. Heritability WB examples
For all answers, the comma, “usually” and “always” tiles were removed from the student answer.
Nonsense answers (corresponding to category in Table 1B) were answers that lacked subjects or verbs. Any answer that did not contain any of the tiles from the set of (all snails, some snails, the snail population, thin-shelled snails, thick-shelled snails) matched this rule, as did any answer that did not contain any tiles from the set of (grow thicker shells, increase(s) in average shell thickness, have thin-shelled offspring, have thick-shelled offspring, have offspring of random shell thickness). Thus, an answer such as “thin-shelled snails|and|thick-shelled snails|have thick-snails|and|thick-shelled offspring” would not be matched by this rule, while an answer such as “and|grow thicker shells” would be flagged as a nonsense answer.
Correct answers needed to contain both of the phrases “thin-shelled snails|have thin-shelled offspring” and “thick-shelled snails|have thick-shelled offspring”, separated by “and” or “but”. Thus, correct answers included “thin-shelled snails|have thin-shelled offspring|and|thick-shelled snails|have thick-offspring|and|thick-shelled offspring.” and “thick-offspring|and|thick-shelled snails|have thick-offspring|and|thick-shelled offspring|but|thin-shelled snails|have thin-shelled offspring”. Examples of answers not matched by this rule include: “thin-shelled snails|have thin-shelled offspring|and|thin-shelled snails|have thin-shelled offspring” (same phrase repeated twice) and “thin-shelled snails|have thin-shelled offspring|and|thin-shelled snails|have thick-shelled offspring” (replacing thin with thick in just 1 place in answer).
Answers in for the 8th category in Table 1B were matched by a complex rule that allowed
for many word-order pemutations and optionally included tiles, similar to the Heritability WB. In our notation, the rule was:
ans.contains(|in the presence of crabs|) AND