29
ORIGINAL RESEARCH PAPER .
Performance of Potassium Bicarbonate and Calcium Chloride Draw
Solutions for Desalination of Saline Water Using Forward Osmosis
M. Nematzadeh1, A. Samimi1,*, S. Shokrollahzadeh2, A. Behzadmehr3
1Chemical Engineering Department, University of Sistan and Baluchestan, Zahedan, I.R. Iran
2Chemical Technologies Department, Iranian Research Organization for Science and Technology, Tehran, I.R. Iran
3Nanotechnology Reasearch Institute, University of Sistan and Baluchestan, Zahedan, I.R. Iran
1. Introduction
….Fresh water scarcity is a growing problem in many regions in the world. Unchecked population growth and the impairment of existing freshwater sources cause many countries and communities in dry regions to turn to the saline waters as a source of fresh water. Current commercial desalination technologies such as multi-stage flash (MSF) and reverse osmosis (RO), however, consume large thermal energy (200–400 MJ/t in MSF process), or expensive electrical energy
*
Corresponding author
Email address: [email protected]
(4–6 kWh in RO process) [1]. Membrane processes, particularly reverse osmosis is currently one of the most cost effective and successful technologies for water reclamation and seawater desalination. However, RO is expensive and energy intensive. Limited recovery, typically 35–50% for seawater, is another drawback of RO [2,3].
Forward osmosis (FO) process has been proposed as a proper alternative to most membrane desalination processes in recent years [1-6]. Forward osmosis of solvent, generally water, is a well known physical phenomenon, in which osmotic pressure difference serves as the driving force for the transport where a [7].
ARTICLE INFO.
Article history
Received: 9 April 2014 Accepted: 19 September 2014
Keywords
Calcium Chloride Forward Osmosis Inorganic Draw Solution Potassium Bicarbonate
Abstract
30
semi-permeable membrane acts as separator media [7].The spontaneous process, low energy expenditure, low membrane fouling, simple configuration, high recovery and less-expensive equipment are of its inherent advantages. Therefore, forward osmosis has attracted increasing interest in various disciplines of science and engineering. Now, its potential applications in water and wastewater treatment, food and pharmaceuticals processing, artificial dialysis, controlled drug release, and electrical power generation are attempted one after the other [3,8]. The FO process requires a draw solution that has a higher osmotic pressure than the feed solution. The ideal draw solute must have a high osmotic efficiency, which may potentially lead to a much higher water flux and recoveries. The solute must also be easily and inexpensively separated to yield potable water, without being consumed in the process [1,7]. Many efforts have been carried out to employ forward osmosis as an appliance for water reclamation and desalting saline waters in the past five decades. By applying osmotic pressure difference across a semi-permeable membrane with a draw solution at the permeate side, against the feed brine, water is
permeated through the membrane. Batchelder [9]
added sulphur dioxide (SO2) (volatile solute) as draw
solute, to seawater or freshwater to create a solution and used it in a forward osmotic process to extract water from seawater. The volatile solute was removed by heating and/or air stripping. In the same year, Glew [10]described the application of sulphur dioxide and aliphatic alcohols as draw solution and their recovery by distillation. Frank [11] employed forward osmosis using a precipitable salt, in this case aluminum sulfate, as the draw solution solute. Kessler and Moody [12] or Kravath and Davis [13]proposed the use of glucose and fructose sugar as draw solutes for FO in order to produce a nutritious drink, in which separation of the draw solute is unnecessary.
McGinnis [14] suggested a two-stage FO process that relies on the use of draw solutes having high temperature dependence solubilities such as potassium nitrate (KNO3) and sulphur dioxide (SO2). Recently
Mc Cutcheon et al. [4,15] suggested a mixture of ammonia and carbon dioxide gases in an aqueous solution as draw solution due to their high solubility and low molecular weight, which lead to a high osmotic efficiency. Achilli et al. [16] described a protocol for the selection of inorganic salt as optimal draw solutions for forward osmosis applications.
Other key component for successful development of FO technologies from laboratory research to real practical applications, there is a strong need to achieve novel FO membranes [2]. Recently both flat sheet [17] and hollow fiber [18] novel membranes have been prepared to be used in FO applications. In FO, the primary factor controlling water flux and recovery is the trans-membrane osmotic pressure. However, concentration polarization, occurring on both sides of the membrane, also plays a prominent role in reducing the effective trans-membrane osmotic pressure [19]. In recent studies, inorganic salts were suggested because they are cheap, having appropriate osmotic pressure and economical recover processes. In those studies, mostly, the water flux was investigated against deionized water or brackish water as feed solution [16,19]. Achilli et al. [16] studied parameters such as water flux and reverse diffusion of calcium chloride and potassium bicarbonate as well as other inorganic draw solutions against deionized feed water. Based on their results, calcium chloride showed better performance in water flux and reverse salt diffusion, whereas potassium bicarbonate represented suitable performance and low replenishment cost.
Due to arid climate and shortage of water sources in central part of Iran, Caspian Sea (a large lake located in north of Iran) has been considered, recently, as a potential source for production of desalinated potable and/or agricultural water which can be piped to the central part of Iran. Therefore, new desalination technologies with higher recovery and lower saline wastewater should be considered.
In this research, the performance of calcium chloride and potassium bicarbonate draw solutions against saline water has been studied and compared with deionized feed water. Saline feed water with identical salinity of the Caspian Sea water was prepared as feed solution. The above-mentioned draw solutions at different osmotic pressure were investigated to show the effect of draw solutes on water flux and reverse salt diffusion.
2. Materials and Methods
2.1. Feed and draw solutions
….
Analytical−grade KHCO3 and CaCl2 were used to
make the draw solutions. The feed solution was either deionized water or 0.33 M NaCl. Salinity of Caspian Sea water; in northern part of Iran; varies between 13000 to 16000 mg L−1 (Table1).
31
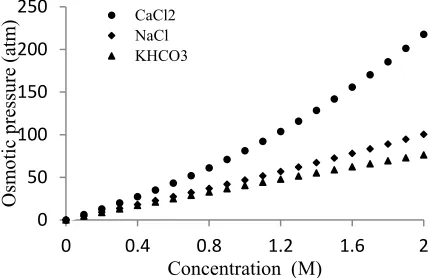
Fig. 1. Osmotic pressure of draw solutions as a function of concentration at 25 °CFig. 2. Osmotic pressure of draw solutions at 0.5 M as a function of temperature
Fig. 3. The solubility of draw solutes at various temperatures
It was simulated by 0.33 M sodium chloride solution in 15 bar osmotic pressure. The draw solution concentrations were tested at 0.41, 0.56 and 0.68 M for CaCl2 and 0.68, 0.99 and 1.26 M for KHCO3
which produced osmotic pressure of 28, 40 and 50 bar, respectively.
The osmotic pressures and solubility of draw solutions as a function of temperature and concentration were calculated by database OLI stream analyzer which is developed by OLI systems, Inc. [20] and compared with sodium chloride (NaCl) in figures (1−3).
Table 1
Water analysis (mg L−1) of Caspian Sea at two stations.
Nour station Gorgan station
Ion
5516 ± 76 6900 ± 100
Chloride
4470 ± 70 5533 ± 416
Sodium
1500 ± 100 2250 ± 50
Sulfate
500 ± 50 737 ± 2
Magnesium
100 ± 20 260 ± 5
Potassium
160 ± 31 249 ± 6
Calcium
13000± 180 16000± 220
TDS
2.2. FO Membrane and membrane orientation
Flat sheet RO membrane (42 ULP, Koch membrane systems CO.) was used in the FO experiments. RO membranes typically consist of a very thin active layer (less than 1µm) supported by a much thicker porous polymer supporting fabric layer. This type membrane has lower performance compared to the semi-permeable FO membranes (cellulose triacetate, CTA, membranes) that have been determined to be the best available membranes for current FO applications. The membrane was tested in the normal or PRO mode (i.e., the dense selective layer of the membrane faces the draw solution while the porous layer faces the feed solution).
For the FO process, the normal mode is expected to have a higher water flux since the effect of internal concentration polarization on the feed solution is smaller than that on the draw solution [2].
2.3. Forward osmosis set-up
The FO experiments were conducted in a designed bench-scale membrane system as shown in figure 4. The specially designed cross-flow membrane cell has symmetric channels on both sides of the membrane providing an effective membrane area of 168 cm2.
This allowed for both the feed and draw solutions to flow tangential to the membrane. Co-current flow is used to reduce strain on the suspended membrane. Plastic mesh spacers are inserted within the feed and draw solution channels to increase turbulence and mass transfer and reduce external concentration 0
50 100 150 200 250
0 0.4 0.8 1.2 1.6 2
Osm
otic p
ressu
re
(atm
)
Concentration (M) CaCl2
NaCl KHCO3
0 10 20 30 40 50
0 20 40 60 80 100
Osmotic
pressure
(atm)
Temperature (°C)
CaCl2 NaCl KHCO3
0 10 20 30 40 50 60 70
0 20 40 60 80 100
Solubity
(g/100
g
water)
Temperature (°C)
32
polarization on both sides of the membrane. Two magnetic centrifugal pumps (MP -045B, CSE Co, Korea) were used to recirculate the feed and draw solutions on the sides of the membrane and the volumetric flow-rates for the experiments were measured with rotameters (LZS15, Technical Group CO., China).The draw and feed solutions reservoirs (each 5 liters in volume) were maintained at 25 ºC with temperature controllers.
An electrical balance connected to a computer was used to monitor the mass of water permeating into the draw solution, from which the water flux was calculated.
Fig. 4. Schematic diagram of the bench-scale forward osmosis set up
2.4. Determination of water flux and reverse
diffusion
Water flux is determined by measuring the weight changes of the draw solution over a selected time period.
As water permeated through the membrane from the feed to the draw side, the weight of the draw solution increased with time.
The rate at which the weight increases divided by the membrane area yields the water flux (L m−2h−1).
water flux =
∆ weight
water density × membrane surface area × ∆ time (1)
An electrical conductivity meter (LF96, WTW Co., Germany) was used to measure the conductivity of solutions which is an indication of reverse diffusion of salts to the feed solution in the experimental conditions.
3. Results and discussion
3.1. FO operation using deionized water as feed
Solution
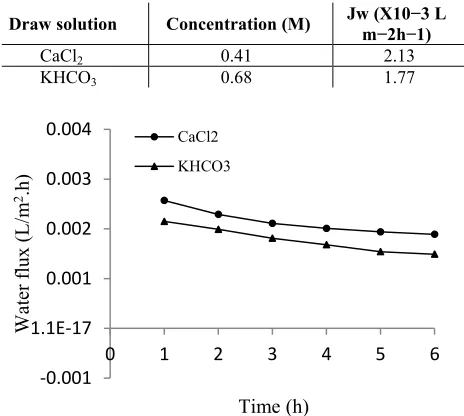
Results of average water flux for both draw solutions tested against deionized water are summarized in table 2 and figure 5.
Table 2
Water flux (JW) for each draw solution tested in osmotic pressure of 28 bar, temperature of 25 °C and flow rate of 3 L min−1.Feed solution was deionized water.
Jw (X10−3 L m−2h−1) Concentration (M)
Draw solution
2.13 0.41
CaCl2
1.77 0.68
KHCO3
Fig. 5. Plots of experimental water flux using CaCl2 and
KHCO3 as draw agents in volumetric cross-flow rate of 3
L/min at 25°C. Feed solution was deionized water and the osmotic pressures were 28 bar
Calcium chloride showed 20% higher permeation than potassium bicarbonate. This would be attributed to the lower internal concentration polarization (ICP), as both draw solutions were tested at the same osmotic pressure (28 bar). External concentration polarization was eliminated by increasing the turbulence using high flow rate (3 L min−1). The
similar trend was also reported by other researchers, where the flux differences of inorganic salts at the same osmotic pressure were reduced due to ICP to the values termed effective osmotic pressure difference across the active layer of the membrane [16]. Investigation has shown that ICP is affected by the membrane structure and the diffusion coefficient of the draw solution [22]. Although, the diffusion coefficient of KHCO3 is slightly higher than CaCl2 at
osmotic pressure of 28 bar and 25 °C (1.20X10⁻⁹ vs. ‐0.001
1.1E‐17 0.001 0.002 0.003 0.004
0 1 2 3 4 5 6
W
ater flux (L/m
2.h)
Time (h) CaCl2
33
1.13 X 10⁻⁹ m2s−1), the lower flux of KHCO3 would
be attributed to the lower solubility (Figure 3) and the higher concentration of this salt to establish identical osmotic pressures. Therefore, greater concentration polarization is expected.
Figure 6 shows the changes in the electrical conductivity of the feed solution for both draw solutions which represents the reverse salt diffusion to the feed. In terms of absolute value, the reverse diffusion of CaCl2 is about 1.6 times higher than
KHCO3 solution after 6 hours permeation. Reverse
salt diffusion depends on the salt, size of hydrated ions, membrane structure and operational parameters such as temperature and flow rate. Higher values for calcium chloride, in this study, might be related to the smaller ionic size of this salt and the higher permeation through the membrane. Lower reverse diffusion of KHCO3 compared to CaCl2 was also
reported by other researchers [16].
Reverse salt diffusion is an important parameter in economical evaluation of the FO process, so that lower reverse salt flux decreases the draw solute waste. Therefore, in terms of reverse diffusion, potassium bicarbonate would be better draw solution.
Fig. 6. Plots of feed solution conductivity against time using CaCl2 and KHCO3 as draw agents in cross-flow rate
of 3 L/min at 25°C. Feed solution was deionized water and the osmotic pressures were 28 bar
3.2. FO operation using solium chloride as feed
solution
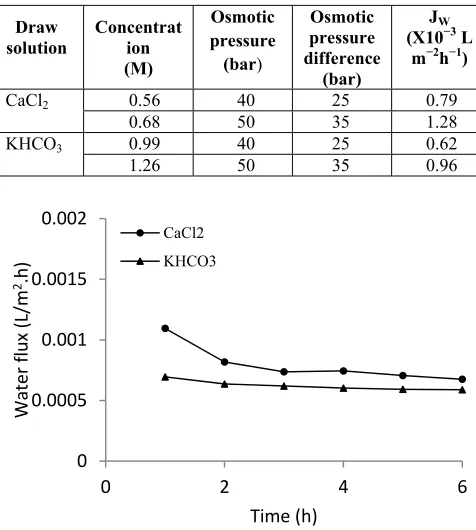
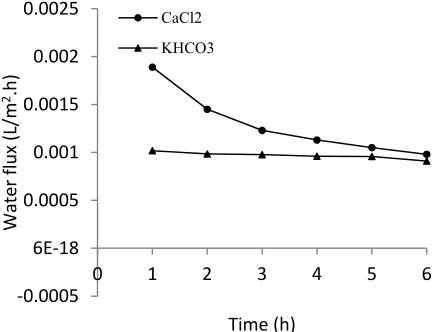
The FO system was operated using calcium chloride and potassium bicarbonate as draw agents and 0.33 M sodium chloride feed solution, which is representative of Caspian Sea water. Water flux as a
function of permeation time for both draw solutions, KHCO3 and CaCl2, at 3 L min−1 is illustrated in table
3 and figures 7 and 8. The concentrations of draw solutions were selected in such a way to produce 40 and 50 bar osmotic pressure for appropriate pemeation. These osmotic pressures provided 25 and 35 bar osmotic pressure difference between feed and draw solutions across the membrane.
In terms of absolute value, the water flux for both draw solutions against 0.33 M NaCl feed solution was about 2.8 times lower than deionized feed water (0.79x10⁻⁹ vs. 2.13 x10⁻⁹ L m−2h−1 for CaCl2; and 0.62
x10−9 vs. 1.77 x10⁻⁹ L m−2h−1 for KHCO3) when the
difference between osmotic pressure of feed and draw solutions were almost the same (25 and 28 bar).
Table 3
Water flux (JW) for each draw solution tested in osmotic pressures of 40 and 50 bar, temperature of 25 °C and flow rate of 3 L min−1. Feed solution was NaCl 0.33 M (osmotic
pressure of 15 bar).
Draw solution
Concentrat ion (M)
Osmotic pressure (bar)
Osmotic pressure difference
(bar)
JW
(X10−3 L
m−2h−1)
CaCl2 0.56 40 0.7925
0.68 50 1.2835
KHCO3 0.99 40 0.6225
1.26 50 0.9635
Fig. 7. Plots of experimental water flux using CaCl2 and
KHCO3 as draw agents in cross-flow rate of 3 L/min at
25°C. Feed solution was 0.33 M NaCl solution and the osmotic pressures of draw solutions were 40 bar
Obviously, this observed phenomenon is because of concentration polarization. When the deionized water feed solution is placed against porous support layer and draw solution is kept on the draw solution side 0
50 100 150 200 250 300
0 1 2 3 4 5 6 7
Conductivity
(µS/cm)
Time (h)
CaCl2
KHCO3
0 0.0005 0.001 0.0015 0.002
0 2 4 6
Water
flux
(L/m
2.h)
Time (h)
CaCl2
34
(normal mode of orientation or PRO), water is diffused into the porous support layer and traversed to the draw solution side through the active layer of membrane due to osmotic pressure gradient across the membrane.Fig. 8. Plots of experimental water flux using CaCl2 and
KHCO3 as draw agents in cross-flow rate of 3 L/min at
25°C. Feed solution was 0.33 M NaCl solution and the osmotic pressures of draw solutions were 50 bar
At the same time, salt diffuses from the draw solution to the feed side leading to internal concentration polarization coupled reverse draw salt flux (dilutive) [23].
On the draw solution side the external concentration polarization may take place in the boundary layer due to transfer of water from feed side to draw solution side.
When water flux is high, the external concentration polarization in draw side can become the limiting effect [24]. Use of sodium chloride solution as feed solution instead of pure water, results in buildup of salt within the porous support layer due to the diffusion of water to the draw solution side.
Therefore, it results in a significant internal concentration polarization (concentrative) and negligible external concentration polarization. In this condition the feed side internal concentration polarization becomes dominant and is responsible for the reduction in the effective osmotic driving force. The internal concentration polarization occurs within the porous support layer and it cannot be lessened by hydrodynamics such as turbulence leading to drastic reduction of effective osmotic driving force [25]. The external concentration polarization effects are negligible when permeate water fluxes are relatively
low and the turbulence flow is dominated, as it has been occurred in this study.
In this situation, ICP was lessened by increasing the trans-membrane osmotic pressure diference from 25 to 35 bar resulted in higher flux ratio of deionized and saline feed solution (i.e. 1.6 instead of 2.8).
Although, the increase in flux is non-linear with the osmotic presure difference in which higher ICP and lower fluxes obtain at higher osmotic pressure differences [4].
Therefore, higher concentrations of draw solutions (represent higher osmotic pressures) and/or higher surface area of membrane is required to get apropriate fluxes and higher recovery in desalination of saline water of Caspian Sea water.
It should also be noted that concentration polarization in the porous support and fabric layers of the thick RO membrane is more severe than FO membrane, therefore, higher fluxes is expected if FO membrane is used at the same experimental conditions. Improvements in membrane structure and design may also be able to decrease the ICP effects [26-28].
In this experiment, calcium chloride again showed 27 and 33% higher flux than potassium bicarbonate against saline feed water for 25 and 35 bar trans-membrane osmotic pressure difference, respectively. This would be related to the greater concentration polarization as a result of the lower solubility which led to higher concentration of KHCO3 necessary for
buildup of the osmotic pressure.
By increasing the osmotic driving force from 25 to 35 bar, the flux increased 62% and 55% for CaCl2 and
KHCO3, respectively. Similarly, Choi et al. [5]
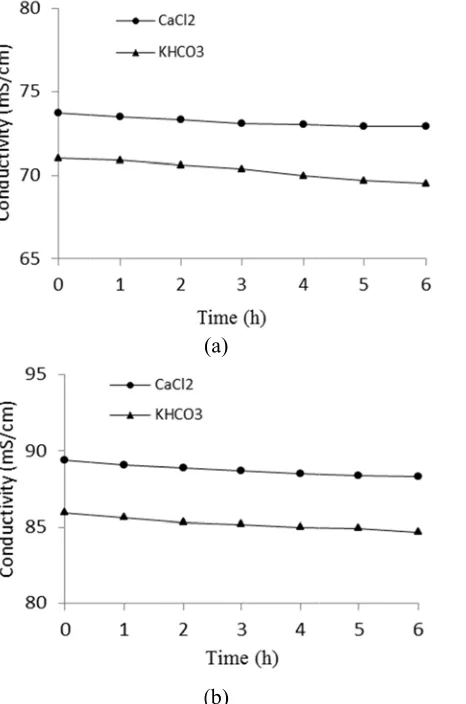
reported increasing the water flux using 1-3 M NaCl draw solution against 0.5 M NaCl feed solution and by increasing the concentration of draw solution. Conductivity changes of draw solutions for trans-membrane osmotic pressure of 25 and 35 bar against 0.33 M NaCl are illustrated in figure 9.
As it is seen, the conductivity of draw solution shows a decreasing trend due to the permeation of water from the feed side to the draw side, leading to increasing trend of salinity (conductivity) of the feed solution. Reduction of conductivity of draw solutions results in a loss in fluxes due to a decrease in osmotic pressure of draw solutions [22]. At this experiment the slope of conductivity reduction is not sharp, therefore, the drop in flux within the permeation time is negligible.
‐0.0005 6E‐18 0.0005 0.001 0.0015 0.002 0.0025
0 1 2 3 4 5 6
Water
flux
(L/m
2.h)
Time (h)
CaCl2
4
b w d C d h d K p p c4. Conclusio
The perfor bicarbonate d was investi desalination Caspian Sea. differences st higher flux diffusion of KHCO3 solutThe result for both dra solution wh polarization. pressure dif concentration saline feed so
Fig. 9. Cond experiment a solution was of draw solut
ons
rmance of calc draw solution
igated agai of 0.33 M N At all trans-tudied in this than KHC CaCl2 was a
tion.
s showed dra w solutions hich was a Increasing th ference by ns is required olution.
(
ductivty change at 25 °C and fl
0.33 M NaCl tions were 40 (
cium chloride s as appropri inst deioniz NaCl solution
-membrane os s experiment, CO3, although
about 1.6 tim
astic decrease against 0.33 ttributed to he trans-mem
increase of d to get high
(a)
(b)
es of draw solu ow rate of 3 L
solution. The A) and 50 (B)
e and potassiu ate draw agen zed and f n as a model smotic pressu , CaCl2 show
h the rever mes higher th
e in water fl M NaCl fe concentrati mbrane osmo f draw solu her recovery
utions during F L min−1. The fe
osmotic pressu bar
35
um nts for of ure wed rse han lux eed ion otic ute of FO eed ureRefer
[1] T a s f
[2] C f c c ( [3] B V o p 3 [4] J E f D [5] Y Y f s 2 [6] S m in 3 [7] L P R [8] T F r 7 [9] G
( [10] D [11] F [12] J
s ( [13] R
s ( [14] R
( [15] J b
ences
T.W. Kim, Y and S. Park solute selecti forward osm 11026 (2011) C. H. Tan, H. flux behav consideration concentration (2008) 209–2 B. Van d Vandecasteele of the concen processes, En 3733–3738. J. R. McCu Elimelech, A forward (dire Desalination 1 Y.J. Choi, J.S Yang, J. H. K forward osm seawater desa 239–246. Sh. Zhao, L membrane or n forward os 382 (2011) 30 L. Liu, M. W Patents of For Recent Patent T.Y. Cath, A Forward osm recent develop 70–87. G.W. Batche (1965). D.N. Glew, , U Frank, B.S., U J.O. Kessler, sea water by (1976) 297–30 R.E. Kravath seawater by (1975) 151–15 R.L. McGinn (2002). J.R. McCutch by
ammonia-Y. Kim, C. Y k, Systematic
ion and optim mosis desali
) 1–8. Y. Ng, Modi vior in fo n of exte n polarization 219.
der Bruggen e, Reuse, trea ntrate of press nviron. Sci.
utcheon, R. A novel amm
ect) osmosis 174 (2005) 1– S. Choi, H. Kim, Toward mosis and r
alination, Des
L. Zou, D. rientation on smosis Applic 08–315. Wang, D. Wa
rward Osmos ts on Chem. E
A. E. Child mosis, Princip pments, J. M
elder, US P
US Patent No US Patent No. C.D. Moody, forward osm 06.
h, J.A. Dav direct osmo 55.
nis, US Paten
heon, R.L. M -carbon diox
Yun, H. Jang, c approach f mal system d
ination, Des
ified models t orward osm ernal and ns, J. Membr
n, L. Lej atment, and d sure-driven m Technol 37 L. McGin monia-carbon desalination –11.
J. Oh, S. Le a combined s reverse osm salination 24
Mulcahy, Ef process perf cations, J Me
ang, C. Gao is Membrane Eng 2 (2009) dress, M. E ples, applicati Membr. Sci 28
Patent No. 3
o. 3,216,930 ( . 3,670,897 (1 , Drinking wa mosis, Desalin
vis, Desalin osis, Desalin
nt No. 6,391
McGinnis, Des ide forward W. Kim for draw design for salination to predict mosis in internal . Sci 324
jon, C. discharge membrane 7 (2003) nnis, M. n dioxide process,
36
Influence of draw and feed solution concentrations on process performance, J. Membr. Sci 278 (2006) 114–123.[16] A. Achilli, Y. Cath, E. Childress, Selection of inorganic-based draw solutions for forward osmosis applications, J. Membr. Sci 364 (2010) 233–241.
[17] A. Tiraferri, N.Y. Yip, W.A. Phillip, J.D. Schiffman, M. Elimelech, Relating performance of thin-film composite forward osmosis membranes to support layer formation and structure, J. Membr. Sci 367 (2011) 340–352. [18] S. Chou, L. Shi, R. Wang, C.Y. Tang, C. Qiu
A.G. Fane, Characteristics and potential applications of a novel forward osmosis hollow fiber membrane, Desalination 261 (2010) 365– 372.
[19] Sh. Zhao, L. Zou, D. Mulcahy, Brackish water desalination by a hybrid forward osmosis– nanofiltration system using divalent draw solute, Desalination 284 (2012) 175–181.
[20] OLI Stream Analyzer, OLI Systems Inc., Morris Plains, NJ, http://www.olisystems.com/2010. [21] A. Bairami, B. Abtahi, Determination of salinity
and main water ions in south-east of Caspian Sea, Ir. J. of Marine Sci 2 (2003) 2–3.
[22] Q. Ge, M. Ling, T.S. Chung, Draw solutions for forward osmosis processes, Developments, challenges, and prospects for the future, J.Membr. Sci 442 (2013) 225–237.
[23] N.Y. Yip, A. Tiraferri, W.A. Phillip, J.D. Schiffman, L.A. Hoover, Y.C. Kim, M. Elimelech: Thin-film composite pressure retarded osmosis membranes for sustainable power generation from salinity gradients, Environ. Sci. Technol 45 (2011) 4360–4369. [24] B.S. Chanukya, S. Patil, N. K. Rastogi,
Influence of concentration polarization on flux behavior in forward osmosis during desalination using ammonium bicarbonate, Desalination 312 (2013) 39–44.
[25] J.R. McCutcheon, M. Elimelech, Modeling water flux in forward osmosis, implications for improved membrane design, AICHE J 53 (2007) 1736–1744.
[26] M. Amini, M. Jahanshahi, A. Rahimpour, Synthesis of novel thin film nanocomposite (TFN) forward osmosis membranes using functionalized multi-walled carbon nanotubes, J. Membr. Sci 435 (2013) 233–241.
[27] D. Emadzadeh, W.J. Lau, T.Matsuura, A.F. Ismail, M.Rahbari-Sisakht, Synthesis and characterization of thin film nanocomposite forward osmosis membrane with hydrophilic nanocomposite support to reduce internal concentration polarization, J. Membr. Sci 449 (2014) 74–85.