www.astesj.com
Proceedings of International Conference on Applied Mathematics (ICAM2017), Taza, Morocco
A new color image encryption algorithm based on iterative
mixing of color channels and chaos
Mohamed Essaid*,1, Ismail Akharraz1, Abderrahim Saaidi1,2and Ali Mouhib1
1Sidi Mohamed Ben Abdellah University, Mathematics Physics and Computer Science, LSI, FP, Taza, Morocco 2LIIAN, Sidi Mohamed Ben Abdellah University, Department of Mathematics and Computer Science, Faculty of
Science, Dhar El Mahraz Fez, Morocco.
A R T I C L E I N F O A B S T R A C T
Article history:
Received: 12 April, 2017 Accepted: 04 May, 2017 Online: 28 December, 2017 Keywords:
Image encryption Logistic Map 1D Sin map Skew tent map
Confusion and Diffusion
In this paper, we present a novel secure cryptosystem for direct encryp-tion of color images, based on an iterative mixing spread over three rounds of the R, G and B color channels and three enhanced chaotic maps. Each round includes an affine transformation that uses three in-vertible matrices of order2×2,whose parameters are chosen randomly
from a chaotic map. The proposed algorithm has a large secret key space and strong secret key sensitivity, which protects our approach from a brutal attack. The simulation results show that our algorithm is bet-ter for color images in bet-terms of Peak Signal to Noise Ratio (PSNR), entropy, Unified Average Changing Intensity (UACI) and Number of Pixels Change Rate (NPCR).
1
Introduction
The proliferation of access to information terminals, as well as the implementation of digital personal data transfers, requires the availability of means that en-sure a reliable, fast and genuine exchange. In fact, the use of a communications network exposes the trans-fer of data to certain risks, which require adequate and appropriate security measures. For example, Pi-rated images can subsequently be the subject of data exchange and illegal digital storage. Data encryption is often the only effective way to meet these require-ments. According to Shannon, the basic techniques [1] for an encryption system can be classified into two main categories: permutation of positions (diffusion) and transformation of values (confusion). And the combination between the two classes is also possible. In the literature, several algorithms based on confu-sion and diffusion have been developed [2-3]. Cur-rently, the use of chaos in cryptosystems, has caught the attention of researchers. This is due to the char-acteristics of the chaotic signals. To quote, unpre-dictability, ergodicity, and sensitivity to parameters and initial values. Recently, several chaos-based ar-ticles have been proffered [4-5]. Unfortunately, the one-dimensional logistic map has been widely used in several cryptosystems based on chaos [6-7].
Nev-ertheless, this map has some disadvantages when it is used in cryptography such as not uniform distribu-tion, small space key, chaotic discontinuous ranges, and periodicity in chaotic ranges [8]. Its very im-portant to produce a new chaotic system with better chaotic performance. In this work, we proposed a method based on an improvement of the three chaotic maps, namely the Pseudorandomly Enhanced Logis-tics Map (PELM) [9], the Pseudorandomly Enhanced Sine Map (PESM) and the Pseudorandomly Enhanced Skew Tent Map (PESTM). Thus, the red channel of the original image is mixed with the ELM, the green channel with the ESM, and the blue channel with the ESTM. Then, a strong avalanche effect will be applied on the three mixed channels, so that a small perturba-tion on a pixel of the original image will be reflected on the entire image.
The paper is organized as follows. Section 2 makes a new chaotic maps by using the above mentioned three 1D chaotic maps. Section 3 gives a detailed ex-planation of the proposed image encryption scheme. Section 4 present experimental results demonstrating performance of the proposed method against statisti-cal and sensitivity cryptanalysis. section 5 shows con-clusion.
*Corresponding Author: Mohamed Essaid , FP , Taza, Morocco, m.essaid [email protected], [email protected]
2
The pseudorandom number
gen-erator
The proposed image encryption scheme relies on three improved chaotic maps PELM, PESME and the PESTM, for the generation of pseudo-random number sequences. In this section we show the improvement of the three chaotic maps in terms of chaotic behavior, Lyapunov exponent, bifurcation and distribution.
2.1
Pseudorandomly Enhanced Logistics
Map
The logistic map is a simple dynamic nonlinear equa-tion with a complex chaotic behavior, is one of the fa-mous chaotic maps, expressed by the following equa-tion:
Xn+1=µ×Xn×(1−Xn) (1)
Where µ∈ [0,4] is a control parameter of the lo-gistic map, the variableXn ∈[0,1] withnis the
iter-ations number used to generate the iterative values. The one-dimensional logistics map is characterized by its simple structure and its ease of implementation. Its usually used to encrypt large data in real time [11]. On the other hand, it has several weaknesses [10], in-cluding discontinuity, non-uniformity, short periodic-ity, numerical degradation and weak key space.
We have thus improved the pseudo-randomness of the sequences generated by the logistic map, by a simple multiplication by 106 and an application of the modular arithmetic (mod 1). This new pseudo-random generator is indicated in equation (2) [9]:
Xn+1=mod(((µ×Xn×(1−Xn))(106)) (2)
where mod is the operation of module 1. the pro-posed generator has a Lyapunov exponent higher than that of the logistic map (Fig. 1), and a good distribu-tion (Fig. 2).
2.2
Pseudorandomly Enhanced Sine Map
The sine map is also one of the one-dimensional chaotic maps whose chaotic behavior is similar to that of the logistic map described by the following equa-tion:
Yn+1=r×sin(π×Yn) (3)
Where r∈]0,1] is a control parameter of the sine map, the variableYn ∈ [0,1] with nis the iterations
number used to generate the iterative values.
We have also improved the pseudo-randomness of the sequences generated by the Sine map, by a simple multiplication by 106and an application of the modu-lar arithmetic (mod 1). This new pseudo-random gen-erator is indicated in equation (4):
Yn+1=mod(((r×sin(π×Yn))(106)) (4)
To test the property of the PESM in terms of the Lyapunov exponent and distribution, several simula-tions and analysis were performed (see Fig. 1 and Fig. 2).
2.3
Pseudorandomly Enhanced Skew Tent
Map
The skew tent map is a one-dimensional simple chaotic system which can be described by [12]:
Zn+1=
Zn
b if Zn< b
Zn∈[0,1]
1−Zn
1−b if Zn> b
(5)
WhereZn∈[0,1] is the state of the chaotic system,
andb∈[0,0.5]∪[0.5,1] is the control parameter. We have also improved the pseudo-randomness of the se-quences generated by the skew tent map. This new pseudo-random generator is indicated in equation (6):
Zn+1=
mod(((Zn
b )(106)),1) if Zn< b
Zn∈[0,1]
mod(((1−Zn
1−b )(106)),1) if Zn> b
(6) The figure below shows the Lyapunov exponents of the logistic map, the sin map, the skew tent map, and of the pseudo-random generators proposed.
Fig. 1 : Lyapunov exponent of: (a) Logistic Map and PELM; (b) Sine Map and PESM; (c) Skew Tent Map and PESTM.
We can see in the fig. 1 that the Lyapunov expo-nent is large for the proposed pseudo-random gen-erator. Therefore, this generator presents a higher and faster divergence between two chaotic trajectories having very similar initial conditions. From a cryp-tographic point of view, a good pseudo-random gen-erator must produce chaotic sequences with uniform distribution. The figure below shows the distribution densities of the logistic map, the sin map, the skew tent map, and of the pseudo-random generators pro-posed.
It is clear from the fig. 2 that the pseudo-random generators proposed has a uniform distribution den-sity. Therefore, has excellent statistical properties, and is more recommended to use for a robust encryp-tion system.
3
Description of the proposed
scheme
Our algorithm is based on three stages of confu-sion and a diffusion step. Let us consider an H×
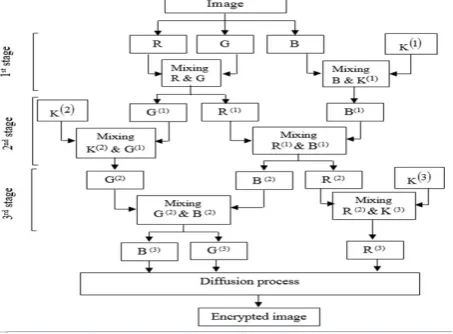
W color image P to be encrypted. With H is the height and W the width. The process of our pro-posed algorithm will be summarized in Fig. 3 :
Fig. 3: Flowchart of the proposed algorithm
3.1
Confusion process
The confusion step is described as follows :
Step 1: Load the plain imageP of size W×H, and divide it into 3 images with R, Gand Bchannels re-spectively.
Step 2: Choose six valuesX0, Y0, Z0, µ, r andb which
represent the initial conditions and the control pa-rameters of the pseudo-random generators proposed.
Step 3 : Iterate the PELM, PESM and PESTM re-spectively for W ×H times to get the state X = {X0, X1, ..., XW×H−1}, Y = {X0, Y1, ..., YW×H−1} and Z =
{Z0, Z1, ..., ZW×H−1}.
Step 4 : Generate three keys K(1), K(2) and
K(3). With K(1) = mod(f loor(X(i) × 1014),256),
K(2) = mod(f loor(Y(i) × 1014),256), and K(3) =
mod(f loor(Z(i)×1014),256), Withi= 0,1... W×H−1. Then convert each key into a matrix of dimensions
with the size ofW×H.
Step 5: Create three invertible matrices M(1), M(2)
andM(3)used for iterative mixing. With
M(1)= 1 p1
q1 1 +p1q1
!
, M(2)= 1 p2
q2 1 +p2q2
!
,
and M(3)= 1 p3
q3 1 +p3q3
!
Wherep1 andq1 are from K(1) , p2 and q2 are from
K(2),p3andq3are fromK(3).
Step 6 : Mix each color channel with to another or with a key according to the following formulas :
R(1) G(1)
!
=M(1)× R
G
!
(mod256) (7)
B(1) T mp(1)
!
=M(1)× B
K(1)
!
(mod256) (8)
R(2) G(2)
!
=M(2)× R
G
!
(mod256) (9)
G(2) T mp(2)
!
=M(2)× G
(1)
K(2)
!
(mod256) (10)
B(3) G(3)
!
=M(3)× B
(2)
G(2)
!
(mod256) (11)
R(3) T mp(3)
!
=M(3)× R
(2)
K(3)
!
(mod256) (12)
T mp(1), T mp(2)andT mp(3)are variables not taken
into consideration in the encryption process.
3.2
Di
ff
usion process
The diffusion step is described as follows :
Step 1: Convert R(3), G(3) and B(3) to
a vectors of size W × H , and
concate-nate them into a single vector V(RGB) = {r0, r1, ..., rW×H−1, g0, g1, ..., gW×H−1, b0, b1, ..., bW×H−1}. Where {r0, r1, ..., rW×H−1}, {g0, g1, ..., gW×H−1} and {b0, b1, ..., bW×H−1}are respectively the components of
R(3), G(3)andB(3).
Step 2 : Concatenate the three sequences
X, Y and Z into a single vector V(K) = {X0, X1, ..., XW×H−1, Y0, Y1, ..., YW×H−1, Z0, Z1, ..., ZW×H−1}.
Then by sorting the order of the vector V(K), the
chaotic sequence is changed into a sorted order. This sequence is calledV(p).
Step 3 : Obtain the permuted image pixel vector
P0={p0, p1, ..., pW×H−1}, by using the permutation
po-sition vectorV(p)according to the following formula :
P(i) =V(RGB)(V(p)(i)) (13)
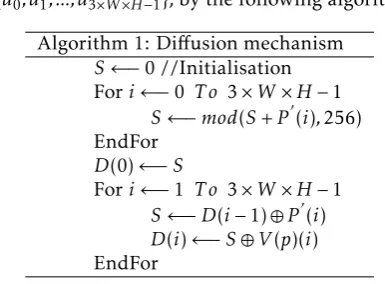
{d0, d1, ..., d3×W×H−1}, by the following algorithm :
Algorithm 1: Diffusion mechanism
S←−0 //Initialisation Fori←−0 T o 3×W×H−1
S←−mod(S+P0(i),256) EndFor
D(0)←−S
Fori←−1 T o 3×W×H−1
S←−D(i−1)⊕P0(i)
D(i)←−S⊕V(p)(i) EndFor
Step 5 : Convert the diffusion vectorD into theR, G
andBcolor image with the size ofW⊗H.
3.3
Decryption algorithm
The decryption process is similar to that of encryption procedure in the reversed order.
4
Experimental results and
analy-sis
In this section, we will validate our encryption system in terms of key space, histogram, entropy, correlation coefficient, NPCR, and UACI. All simulations are per-formed on a personal computer. Table 1 shows the hardware, the software environment and the image source.
Table. 1:Specification table
Processor Intel CoreT Mi5-2430M CPU 2.4GHZ
RAM 4GB
Operating system Windows 8 professional Programming language JAVA
Image source USC-SIPI image data base [13]
4.1
Space of key
The exhaustive attack is to try all possible combina-tions of keys until obtaining a clear text. Therefore, in a good image cryptosystem, the space of key should be large enough to make brute-force attack infeasible. The secret key of the proposed cryptosystem contains six real numbers (µ, r, b , X0, Y0, Z0).If the precision
is 10−14,the key space size can reach to 2252.From a cryptographic point of view, the size of the key space should not be less than 2100to ensure a high level of
Security [14]. This means that our algorithm can with-stand the brute force attack.
4.2
Statistical Analysis
4.2.1 Histogram analysis
An image histogram is a graphical representation of the number of pixels with the same gray level. Thus, the abscissa axis represents the color level, which starts from zero (color channel off) to 255 (maximum color channel). Fig. 4(a)-(b) show the plain and cipher image. Fig. 4(c)-(d) show the histogram of plain and
cipher components’ R, G, and B.
Fig. 4: (a)Lena512×512; (b)encrypted image; (c) Histogram of plain-image; (d) Histogram of encrypted image
Comparing the two histograms of plain and cipher image, we can see that histogram of encrypted im-age is fairly uniform and is significantly different from that of the original image, and that the encrypted im-ages obtained do not provide any information to the attacker, which can strongly resist statistical attacks.
4.2.2 Information Entropy
Information entropy is designed to evaluate the uncer-tainty in a random variable as shown in the following equation [1]:
H(m) =−
M
X
i=0
P(mi)log(P(mi)) (14)
Where,Mis the total number of symbols and rep-resents the probability of occurrence of the symbol, for a grayscale image with a data range of, its maxi-mum Information entropy is 8.The results are shown in Table 2.
Table. 2:Entropy of the original image and the encrypted
im-age
mages Original Encrypted
House 256×256 7.068625 7.999159 Lena 512×512 7.750197 7.999779 Peppers 512×512 7.669825 7.999776
It is clear from Table 2 that the values of the en-tropy of the encrypted images are very close to the theoretical value (which is equal to 8).
4.2.3 Correlation analysis
adjacent pixels, and it can be used by attackers. In order to test the correlation, we randomly select 1000 pairs of adjacent pixels in three dimension (vertical, horizontal and diagonal). The results are shown in Table 3 and Fig 5.
The correlation coefficient for a sequence of adjacent pixels is given by the following formula:
ruv=
cov(u, v) p
D(u)pD(v), (15) Where u and v represent two vectors formed re-spectively by the values of the pixels of the chosen se-quence of the image and the values of their adjacent pixels. The termscov(u, v), D(u) andD(v) are calcu-lated by the following formulas:
E(u) = 1
N N
X
i=1
ui, (16)
D(u) = 1
N N
X
i=1
[ui−E(u)]2, (17)
Cov(u, v) = 1
N N
X
i=1
[ui−E(u)]∗[vi−E(v)] (18)
WhereN is a large number of adjacent pixel pairs randomly selected in the image (In our case N = 1000),uiandvi are respectively the color levels of the
collected pixels.
Table. 3: Correlation coefficient of the two adjacent pixels for the original and encrypted image
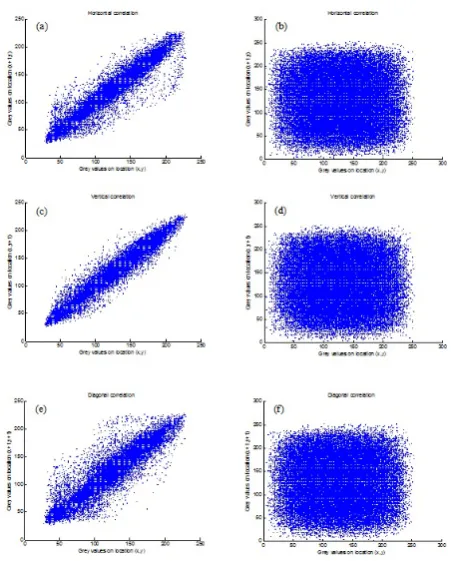
We can see in the Table 3, the correlation coefficient values are nearing to zero and negative values which prove that there is no correlation between the plain and cipher image.
4.3
Di
ff
erential analysis
The Number of Pixels Change Rate (NPCR) [15] and Unified Average Changing Intensity (UACI) [16] are used to analyze the effect of slight change (one bit of single pixel) in the plain image on the cipher image [21]. The formulas used to calculate NPCR and UACI are defined by the following two equations:
N P CR= P
i,jg(i, j) W×H ×100
U ACI= 100
W×H X
i,j
|C1(i, j)−C2(i, j)|
255 ×100
Where,C1(i, j) is the encrypted image andC2(i, j)
is the encrypted image after changing a pixel of the
clear image. For the pixels at the position (i, j) , if
C1(i, j),C2(i, j) , theng(i, j) = 1 , otherwise it’s equal
to zero.
A value ofU ACI >33.4635% andN P CR >99.6094% ensures that an image encryption scheme is immune to a differential attack. Table 4 below shows the re-sults of the UACI and NPCR simulations.
Table. 4: NPCR and UACI values after changing the value of a pixel.
It is clear from Table 4 that the value of NPCR is greater than 99.6094% and that of UACI is greater than 33.4635%.That is to say a modification of a sin-gle pixel of the original image results in a radical change of all the pixels of the encrypted image.
Fig. 5: Correlation distribution of adjacent pixels of the Lena 512×512 in directions, (a) Horizontal, (c) Vertical, (e) diagonal.
Correlation distribution of adjacent pixels of the Lena 512×512
encrypted in the directions, (b) Horizontal, (d) Vertical, (f) diago-nal.
5
Conclusion
distribution density showed that the proposed gen-erator is able to generate a one-dimension chaotic system with excellent statistical properties and good chaotic behavior. Secondly, we proposed a novel algo-rithm based on an iterative mixing of the three com-ponents R, G and B with the three chaotic sequences generated from the proposed pseudo-random genera-tor, followed by a strong diffusion. The values of the performance metrics in terms of key space, histogram, entropy, correlation coefficient, NPCR, and UACI, sat-isfy that the proposed algorithm is extremely difficult to break and withstands on various kinds of security attacks.
References
1. Shannon, C. E. (1949). Communication theory of secrecy systems. Bell Labs Technical Journal, 28(4), 656-715.
2. Chen, G., Mao, Y., and Chui, C. K. (2004). A symmetric image encryption scheme based on 3D chaotic cat maps. Chaos, Solitons and Fractals, 21(3), 749-761.
3. Kanso, A., and Ghebleh, M. (2012). A novel image encryp-tion algorithm based on a 3D chaotic map. Communica-tions in Nonlinear Science and Numerical Simulation, 17(7), 2943-2959.
4. Liu, L., Zhang, Q., and Wei, X. (2012). A RGB image en-cryption algorithm based on DNA encoding and chaos map. Computers and Electrical Engineering, 38(5), 1240-1248.
5. Hua, Z., and Zhou, Y. (2016). Image encryption using 2D Logistic-Adjusted-Sine map. Information Sciences, 339, 237-253.
6. Wong, K. W., Kwok, B. S. H., and Law, W. S. (2008). A fast image encryption scheme based on chaotic standard map. Physics Letters A, 372(15), 2645-2652.
7. Hanchinamani, G., and Kulakarni, L. (2014). A New Ap-proach for Image Encryption Based on Cyclic Rotations and Multiple Blockwise Diffusions Using Pomeau-Manneville and Sin Maps. JCSE, 8(4), 187-198.
8. Arroyo, D., Alvarez, G., and Fernandez, V. (2008). On the in-adequacy of the logistic map for cryptographic applications. arXiv preprint arXiv:0805.4355.
9. Murillo-Escobar, M. A., Cruz-Hernndez, C., Cardoza-Avendao, L., and Mndez-Ramrez, R. (2017). A novel pseu-dorandom number generator based on pseupseu-dorandomly en-hanced logistic map. Nonlinear Dynamics, 87(1), 407-425.
10. Arroyo, D., Alvarez, G., and Fernandez, V. (2008). On the in-adequacy of the logistic map for cryptographic applications. arXiv preprint arXiv:0805.4355.
11. Mazloom, S., and Eftekhari-Moghadam, A. M. (2009). Color image encryption based on coupled nonlinear chaotic map. Chaos, Solitons and Fractals, 42(3), 1745-1754.
12. Lai, D., Chen, G., and Hasler, M. (1999). Distribution of the Lyapunov exponent of the chaotic skew tent map. Interna-tional Journal of Bifurcation and Chaos, 9(10), 2059-2067.
13. http://sipi.usc.edu/database/database.php?
14. Alvarez, G., and Li, S. (2006). Some basic cryptographic requirements for chaos-based cryptosystems. International Journal of Bifurcation and Chaos, 16(08), 2129-2151.
15. Akhshani, A., Behnia, S., Akhavan, A., Hassan, H. A., and Hassan, Z. (2010). A novel scheme for image encryption based on 2D piecewise chaotic maps. Optics Communica-tions, 283(17), 3259-3266.