Gap between Expectations and Experiences
of Equity in Public Schools: A Pupils’ Perspective
Muhammad Uzair-ul-Hassan
*Abstract
The study investigated into the lens of pupils from public sector that what constitutes fair and equitable schools in Pakistan. Also the study explored pupils’ expectations from school, how the schools can be transformed into equitable schools in which all students are treated equally and fairly. The study used quantitative approach with multistage sampling in two districts of Punjab, Pakistan. Questionnaire had been conducted on 434 pupils aged between 14-15 years of 9th and 10th class. The return rate of the questionnaire was 85%. Results of descriptive statistical analysis show that pupils receive equitable as well as inequitable treatment with respect to punishment, rewards and marks awarded by teachers in public schools. Results further show that wider the inequitable experiences of pupils in schools, greater are the equity expectations from schools. Also the pupils with various backgrounds differ significantly from each other in terms of inequitable experiences in schools. It is concluded that equitable public school would be the one in which all students are treated in an equitable manner irrespective of differences.
Keywords: Pupils, equity, schools
Introduction
Pupils’ voices based on their own experiences in schools have weight and worth in identifying inequitable schools. Inequitable schools reflect students’ failure and social deprivation. The concept of equitable schools lies within the concept of equity. Equity, ensemble tackles school failure and helps to control the effects of deprivation in the society which sometimes causes school failure.
Skelton and Kigamwa (2013) explained that education would be equitable when educational practices, policies, curricula, resources and institutional cultures are representative of all students in terms of access and participation in high quality learning experiences regardless of their race, socio-economic status, gender, ability, religion, national origin, linguistic diversity or other characteristics. We have drawn a sketch map based on Skelton and Kigamwa’s concept of equitable education below:
Figure 1. Equitable education
Equity has become increasingly prominent in national and international policy agendas (e.g. Ball and Youdell, 2009; UNESCO, 2007; OECD, 2005).Smith and Gorard (2006) explain that in a fair and equitable national education system all students must be treated in the similar fashion.
justice. The study also gets guidelines from Smith and Gorard’s (2006) work related to criteria of justice, judgments on the equity of the educational system and a feeling of being treated with justice. Schools must provide equitable experiences based on justice. It seems that whatever students reflect outside school is actually rooted in their experiences inside the school. What happens in school can impact on life outside and beyond school (Gorard 2011).Smith and Gorard’s (2012) discussed the criteria of justice in terms of pupils’ opinions about fair schooling system, judgments on the equity of the educational system in terms of students’ expectation of equity, and a feeling of being treated with justice in terms of students’ comportment about their equity experiences in their own school. Punishments, rewards, and marks awarded to pupils are also been discussed within equity in school. Teachers’ expectations about students sway students’ belief about themselves. The study investigates into how students perceive education system equitable in terms of teachers’ treatment in schools. Students’ expectation related to equity makes the criteria of equity and justice. What makes school system unfair and inequitable and to what extent students’ experiences suggest students’ own system is fair one? The study includes criteria of equity and justice, students’ expectations and experiences of equity in schools. The study takes into account the inequitable experiences in terms of punishments, rewards, marks, and treatment of different groups of students in schools.
treated fairly or unfairly. Smith & Gorard (2012) concluded that pupils’ feelings of injustice are important for moral, academic, educational and civic reasons. They further elaborated that every pupil’s development and achievement is equally important for the school system and unfairly treated pupils react that consequently can impair their learning process. In schools where much injustice exists, pupils can learn less. Smith and Gorard (2012) found that unfairness with pupils may harm the personal development and can lower self-esteem. Equity can be considered to represent sense of fairness. “Where equity is denied, negative consequences follow” (Smith & Gorard, 2012).“If we view schools as micro-societies we might surmise that the learning of justice and fairness in school will help shape young people’s notions of justice and equity outside school” (Smith & Gorard, 2012). The study creates awareness among stakeholders i.e. students, parents and teachers that how students perceive unfairness, injustice and inequalities in schools. Students not only take into account inequalities that persist within their environment and among them but also feel and dislike disproportionate, prejudiced and discriminated dealing of teachers. The study contributes significantly in teachers’ understanding on how students become sensitive during interactions and treatment of teachers in classroom and schools. Teachers can also get benefit from the study that what inequalities among students are justifiable and what are not. This study further assert the importance of equity in school because speaking at broader level the work force of the country would be made effective if every student within his or her capacity utilize maximum potential that s/he possesses and can become a responsible citizen. Productive citizen can earn better. “The wages of a literate person are 23% higher than those of an illiterate person in Pakistan” (Education for All, Global Monitoring Report, EFAGMR (2014: p. 146).
The objectives of the study were to;
1. Explore pupils’ perceptions and experiences of equity in their school 2. Identify equity in teachers’ behaviors’ with students.
3. Examine pupil’s expectations about fair schooling system
4. Find relationship between students’ experienced equity and the equity they expect from schools
5. Examine significant differences in pupils’ demographics in terms of students’ expected and students’ experienced equity in schools.
2. How do pupils face injustices from teachers in terms of punishments?
3. How do pupils face injustices from teachers in terms of marks and rewards?
4. Are teachers biased in their behaviors with students?
5. Do pupils face unfair experiences with peers in public schools? 6. What do pupils expect from schools in bringing equity in public
school education?
7. Does relationship exist between students’ experienced equity and the equity they expect from schools?
8. Do significant differences exist in pupils’ demographics exist in terms of pupils’ expected and experienced equity in public schools?
Methodology
Students of 9th and 10th
Multi-stage sampling had been used for the study. To select sample from the population, schools located in both urban and rural areas were randomly selected from the official list of schools available for these districts. In Pakistan, there exists segregated system of education in relation to gender so separate schools for both female and male were also randomly selected from the official list available for the districts. Researcher personally visited the selected schools and students of 9
class between the age 14-16 years in public schools of district Sargodha and Chiniot (Punjab, Pakistan) were selected as population of the study. Students comprise the population of the study as students are the key stakeholders that are directly affected by the unjust educational practices occurring in schools.
th
distributed among the students and 434 were collected back. So the return rate of the questionnaire was 85%. The sample of students who returned the questionnaires is given below:
Table 1
Sample of students from rural and urban schools
Location of School
Rural Urban
Sample of Students 173 261
Total 434
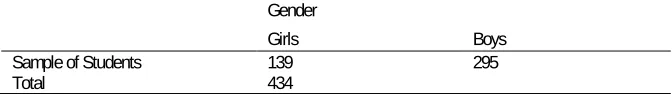
Table 2
Sample of students from girls and boys schools
Gender
Girls Boys
Sample of Students 139 295
Total 434
Instrument
of equity. This portion meant to find out the expectations of students from school on equity. These two parts of the questionnaire also facilitated in seeking relationship between students experienced and expected equity. On the other hand the demographic variables included in the questionnaire particularly mother tongue, father income, school locality and type of school further developed understanding on students’ expected and experienced equity in public schools. The questionnaire was adapted and translated in Urdu and expert opinion was taken for validation of content, construct and the translation. The questionnaire was piloted with 34 students who had similar characteristics with main sample of the study. Pilot testing of the instrument was conducted and internal consistency of the items was calculated. To enhance the internal consistency, two item were deleted from the main questionnaire. Finally the value of the Cronbach Alpha was found 0.795 which indicated that there was a good consistency in responses against the items and that the data received on the instrument was reliable. Once the questionnaire had been finalized after pilot testing, data were collected from different schools across Sargodha and Chiniot districts from Punjab, Pakistan.
Data Analysis
“statistical programme/package for social sciences” IBM SPSS 19 (version), data were decomposed and analyzed to find the results for research questions. The results were tabulated and interpreted.
Results
Results are being explored through percentage analyses that provide us understanding of students’ unfair and inequitable experiences, practices, behaviors and fair and equitable expectation from public schools. As far as criteria of equity are concerned, 41% students reply in favor of same respect to all, irrespective of differences. While 88% respondents think, that it is unfair for the students who work hard but are awarded with less marks. Also there were 67% of students who believed that students’ personal effort more meaningful in coming out of the difficulties in reading and to keep on moving along with fellows while 48% of students were justified to impart more time to student who badly behaves in the class. The tables below shows percentage of respondents against each item related to equity experienced and expected.
Table 3
Percentage of responses against each item related to equitable experiences
Sr. No. Experienced Equity Percentage
1 Pupil receive marks as they deserved 85
2 Teachers even disagreed respected my opinions 65
3 Teacher spends more time with a pupil with difficulties than others 55
4 Teachers provide more help to those who needed 90
5 Pupils were always treated fairly by teachers 94
6 Teachers treated all pupils equal 88
7 Pupils think their teachers are fair 94
8 Pupils’ marks reflect assignment quality 87
9 Teachers punish some pupils more than others 58
10 Teachers punish bad behavior fairly 74
11 I felt as an invisible to teachers 29
12 Teachers had favorite pupils 59
students think that teacher spends more time helping a pupil with difficulties than other pupils. Ninety percent90% students responded that teachers gave extra help to those pupils who needed it. Ninety four percent 94% students experienced that they were always treated fairly by their teachers. Similar majority of teachers i.e. 88% experienced that teachers treated them no better or worse than other pupils. Ninety five percent 95%students also experienced that they trusted their teachers to be fair and 94% think that their schools were a fair place. Eighty seven percent 87% respondents agreed that students’ marks usually reflected the quality of work. Fifty eight percent 58% students agreed that some pupils were punished more than others for the same offence. Seventy four percent 74% students also perceived that teachers punished bad behavior fairly. Twenty nine percent 29% students responded that they are invisible to teachers in the class on the statement, ‘I felt as though I was invisible to most teachers’. Fifty nine percent 59% students perceived that teachers had favorite pupils.
Table 4
Percentage of responses against each item related to students’ expected equity
Sr. No. Expected equity Percentage
1 Teachers should give more time in improving students with
difficulties 28
2 Teachers should praise pupils who deserve it. 87
3 Teachers must not humiliate pupils 74
4 Pupils’ marks should show assignment quality 87
5 Teachers should explain until all pupils understand 89
6 Teachers must not humiliate pupils 74
The table below reflects relationship exist between students’ experienced equity and the equity they expect from schools:
Table 5
Pearson product Moment Correlation showing relationship between students’ expected equity and students’ experienced equity in schools
Students Expected Equity Students Experienced Equity r2
.420** .420** .000
Where n= 426
**p<0.01
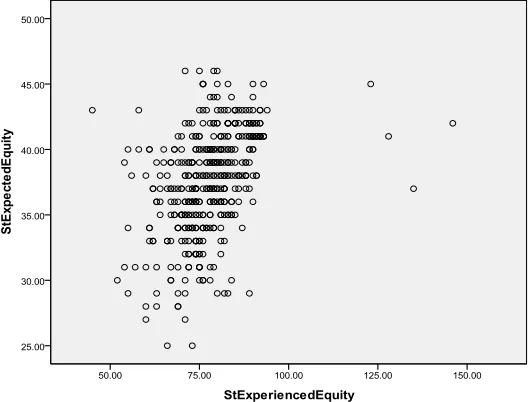
Pearson product Moment Correlation shows that there is positive relationship between students’ expected equity and students’ experiencing equity (r = 0.420). Scatter plot to this correlation is shown below:
Figure 1.Scatter plot
The scatter plot shows that there exists a positive relationship between students’ expected equity and students’ experienced equity in schools (r = 0.420).
tongue and father’s income. It also shows us the significance differences in the mean score of students’ experienced and expected equity with respect to various demographic variables e.g., mother tongue, locality and type of schools and students’ father income.
The tables below show some of the demographic variables related to students’ mother tongue and father’s income included in the study.
Table 6
Students’ mother tongue
Sr. No. Students’ mother
tongue Response Frequency Response in Percentage
1 Urdu 226 52.1
2 Punjabi 205 47.2
3 Pashto 3 0.7
Total 434
The table shows that 52 % students’ mother tongue is Urdu while 47% students speak Punjab as a mother language.
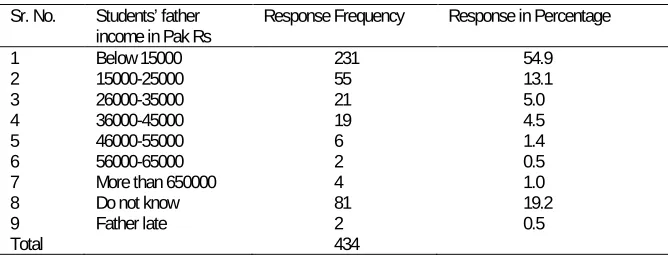
Table 7
Students’ father income
Sr. No. Students’ father
income in Pak Rs Response Frequency Response in Percentage
1 Below 15000 231 54.9
2 15000-25000 55 13.1
3 26000-35000 21 5.0
4 36000-45000 19 4.5
5 46000-55000 6 1.4
6 56000-65000 2 0.5
7 More than 650000 4 1.0
8 Do not know 81 19.2
9 Father late 2 0.5
Total 434
Table 8
Independent sample t- test comparing expected schools’ equity based on students’ mother tongue
Sr.
No. Dependent variable Mother tongue N Mean Std. Deviation t Sig. (2-tailed) 1 Students’
expected equity Punjabi 202 38.7598 3.24017 6.036 .000
2 Urdu 225 36.5156 4.32197
The independent sample t-test Table shows that there is significant difference between students whose mother tongue is Punjabi and whose mother tongue is Urdu and who expect schools’ equity. (t = 6.036, Sig. = .000, Mean Punjabi = 38.7598, Mean Urdu = 36.5156.
Table 9
Independent sample t- test comparing students who are experiencing schools’ equity based on students’ mother tongue
Sr.
No. Dependent variable Mother tongue N Mean Std. Deviation t Sig. (2-tailed) 1 Students’
experiencing equity
Punjabi 199 80.3719 10.99414 5.198 .000
2 Urdu 225 75.3839 8.71188
The independent sample t-test Table shows that there is significant difference between students whose mother tongue is Punjabi and whose mother tongue is Urdu and who are experiencing equity at schools (t = 5.198, Sig. = .000, Mean Punjabi = 80.3719 , Mean Urdu = 75.3839.
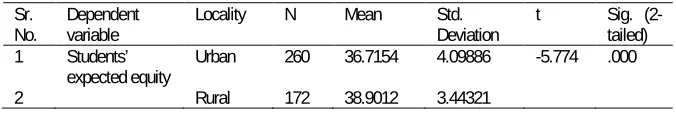
Table 10
Independent sample t- test comparing rural and urban students who expect equity from schools
Sr.
No. Dependent variable Locality N Mean Std. Deviation t Sig. (2-tailed) 1 Students’
expected equity Urban 260 36.7154 4.09886 -5.774 .000
2 Rural 172 38.9012 3.44321
from their schools (t = -5.774, Sig. = .000, Mean Urban = 36.7154, Mean Rural = 38.9012.
Table 11
Independent sample t- test comparing rural and urban students who are experiencing schools’ equity
Sr.
No. Dependent variable Locality N Mean Std. Deviation t Sig. (2-tailed) 1 Students’
expected equity Urban 259 74.5405 8.65495 -8.894 .000
2 Rural 167 82.7725 10.28197
The independent sample t-test Table shows that there is significant difference between urban and rural schools students who are experiencing equity in schools t = -8.894, Sig. = .000, Mean Urban = 74.5405, Mean Rural = 82.7725.
The independent sample t-test shows that there is no significant difference between male and female students who expect schools’ equity. t = -1.871, Sig. = .062, Mean Male = 37.3401, Mean Female = 38.1087. The independent sample t-test shows that there is no significant difference between male and female students who experienced schools’ equity (annex.). t = 1.167, Sig. = .244, Mean Male = 78.1581, Mean Female = 76.9259.
Table 12
ANOVA comparison of students expected equity from schools and their fathers’ income
Table 12 shows that there is significant difference in students’ expected equity from schools and their fathers’ income (F= 2.353, Sig. = .018).
Post hoc multiple comparisons show that significant difference is found in students who did not provide information about their fathers’ income and whose fathers are late. But no significant difference is found in students’ expectation of schools’ equity on the basis of other categories of fathers’ income. One-way ANOVA was also used to compare students experienced equity in schools and their fathers’
Sr. No. Dependent variable Variance df F Sig.
1 Students expected equity Between
groups 8 2.353 .018
Within groups 411
income. The result shows that there is no significant difference in students’ experienced equity in schools and their fathers’ income (F = .566, Sig. = .806).
This portion provides the overall reflection about teachers’ treatment with students. A well proportion of students experienced that their schools are a fair place and their teachers are able, good and hardworking but in parallel they also pointed out grids where teachers are inequitable and so the public schooling system as well. It appears from overall reflection that although gaps exist between students’ desired or expected equity to public schooling and to those students who are actually experiencing equity or inequity in the system. The gaps exist although little and for that the possible explanation might be Pakistani culture where submissiveness and compliance for teachers prevails. It is worth-noting that Pearson Product Moment Correlation shows positive relationship between students’ judgment on equity and perception of being treated with justice. Rural schools students expect more equity in schools as compared to urban schools students in Pakistan. As for as experiencing equity is concerned rural schools students are better experiencing as compared to urban schools students. Punjabi speaking students expect more equity from schools as compared to Urdu speaking students. On the other hand, Punjabi speaking students are experiencing more equity as compared to Urdu speaking students which seems contradictory.
Discussion
speaking. On the other hand, Punjabi speaking students are experiencing more equity as compared to Urdu speaking that is quite contradictory. Father’s income became vital component in students’ expectation on equity in schools. Poor students expect more equity in schools. Similarly students who did not provide information of father’s income also expect more equity in schools. In a nutshell, the study introduces equity in schools as significant research field and justifies that screening of just few children as compared to the rest is harmful for the country’s educational set up in all aspects where schools themselves become barrier to produce more productive citizens for the country and society. Equitable public school would be the one in which all students are treated in an equitable manner irrespective of differences.
Acknowledgement
References
Ball, S. J. and You dell, D. (2009). Hidden privatisation of public education. Education Review. 21(2), 73–83.
Boland, P. & Potter, J. (2001). Gender equity for educators, parents and community. Equity in education series. WEEA Equity Resource Center. Education Development Center, Inc. Retrieved from www2.edc.org/gdi. EFAGMR. (2014). Education for All Global Monitoring Report 2013/14. Paris: UNESCO.
Equity (2000). Equity 2000-A systematic education reform model: A summary report 1990-2000. Retrieved from www.collegeboard.com. Gorard, S. (2011). The potential determinants of young people’s sense of justice: An International study. British Journal of Sociology of Education. 32(1), 35–52.
Gorard, S., and Smith, E.(2010). Equity in education: An international perspective London: Palgrave MacMillan. Govt. of Pakistan.(1998). National Education Policy (1998-2010). Ministry of Education, Islamabad. Pp. 47, 72.
Hutmacher, W. (2002). Introduction in, In pursuit of equity in education: Using International Indicators to Compare Equity Policies. Kluwer Academic Publishers: New York.
McMurtry, R. & Curling, A. (2008). The review of the roots of youth violence. Vol. 2: Executive Summary. Toronto: Queen’s Printer for Ontario.
Meuret, D. (2001) School Equity as a Matter of Justice, in In Pursuit of Equity in Education, Hutmacher, W., Cochrane D., Bottani N. (eds.), Dordrecht: Kluwer Academic Publishers.
Meuret, D. (2002). A System of Equity Indicators for Educational Systems. In Inpursuit of equity in education: Using International Indicators to Compare Equity Policies. Hutmacher, W., Cochrane D., Bottani N. (eds.), Kluwer Academic Publishers: New York.
Organization for Economic Co-operation and Development, OECD. (2005). Teachers Matter: Attracting, developing and retaining effective teacher. Paris, France: Organisation for Economic Co-operation and Development Publishing.
Organization for Economic Co-operation and Development, OECD (2008). Ten steps to equity in education. Policy brief, Organization for Economic Cooperation and Development, OECD.
Retrieved from
Riley, K. (2004). Voices of disaffected pupils: Implications for policy and practice. British Journal of Educational Studies.52 (2),166–79.
Skelton, S. & Kigamwa, J. (2013). Educational equity: What’s it all about? Great lakes equity centre. Retrieved from http://glec.education.iupui.edu/assets/files/JulyPDF.pdf
Smith, E., & Gorard, S. (2006). Pupils’ view on equity in schools.
Compare, 36(1),41-56.
Smith, E., & Gorard, S. (2012) ‘Teachers are kind to thosewho have good marks’: a study of Japanese young people’s views of fairness and equity in school, Compare: A Journal of Comparative and International Education. 42(1), 27-46. DOI:10.1080/03057925.2011.629073.
UNESCO. (2007). Educational equity and public policy: Comparing results from 16 countries. Montreal: UNESCO.