Submitted 4 July 2017, accepted for publication 9 Nov.2017
Corresponding Author E-mail: k.nourollahi@ilam.ac.ir
© 2017, Published by the Iranian Mycological Society http://mi.iranjournals.ir
Genetic structure of Fusarium oxysporum f. sp. ciceri populations
from chickpea in Ilam province, Iran
Kh. Nourollahi
✉
A. AliaranDepartment of Plant Protection, Ilam University, Ilam, Iran
Abstract
: Chickpea (
Cicerarietinum L.) is one of the most important legume crops in Iran. Wilt disease caused by Fusarium oxysporum f. sp. ciceri, is the most important soil-borne disease of chickpea in the world. This disease caused high losses in different regions during recent years. Simple sequence repeat (SSR) were used to estimate genetic diversity in 114 of F. oxysporum isolates from six counties in the western of Iran (Asemanabad, Sarableh, Eivan, Badreh, Chardavol and Dareh Shahr). A set of five microsatellite primer pairs revealed 17 alleles in each locus across the populations. A low level of genetic variability was observed among isolates in these regions. Genetic diversity was low (H = 0.269) within populations with corresponding high average gene flow and low genetic distances between populations. The smallest genetic distance was observed between isolates from Chardavol and Darahshahr regions. Effective number of alleles was higher in Asemanabad in comparison to the other populations. The number of (H) and Shannon's Information index (I) were also higher in Badreh (H = 0.430, I = 0.281). The total gene diversity and gene diversities between subpopulation were estimated 0.2004 and 0.188, respectively. Gene diversity attributable to differenti- ation among populations was 0.0618, while gene flow was 7.589. Cluster analysis based on UPGMA showed the lowest genetic distance between Chardavol and Dareh Shahr, then between Chardavol and Badreh. The dendrogram indicated a clear break between Asemanabad and the remaining populations. These results will be useful in breeding for chickpea root rot resistant cultivars and developing necessary control measures.Key words: Genetic diversity, gene flow, population differentiation, microsatellite
INTRODUCTION
Chickpea (Cicerarietinum L.) is one of the most important pulse crops in the world (Barve et al. 2001). This crop is an important component of the cropping systems as it derives more than 70% of its nitrogen from symbiotic nitrogen fixation (Saxena 1990). It is reported to be infected by more than 52 pathogen (Nene et al. 1984). Fusarium wilt caused by
Fusarium oxysporum f. sp. ciceri (Padwick) Matuo & K. Sauto (FOC) is one of the major limiting factors of chickpea production worldwide. The disease is widespread in all chickpea growing areas of the world (Haware & Nene 1982), causing 10 - 90% annual losses (Singh & Dahiya 1973, Jalali & Chand 1992).
General symptoms at the seedling stage include seed rot and sudden drooping more like wilting and damping off (Khare 1980). The disease may cause complete crop loss under favorable conditions, and can be the major limiting factor for cultivation in certain areas (Chaudhary & Amarjit 2002). The disease is difficult to control due to the survival of pathogen in infected soil for years even in the absence of the host plant (Haware et al. 1996). The most effective and practical strategies to control Fusarium wilt of chickpea was reported to be the development of resistant cultivars (Nene & Haware 1980, Haware 1990).
Knowledge of genetic diversity is needed for resistance deployment to be effective and to identify shifts in race or population structure that might occur (McDonald 1997). Identification of diversity by morphological characters is highly variable in
Fusarium isolates, these characters are influenced by cultural conditions. In recent years, numerous DNA based methods have been increasingly used to study variability in pathogenic Fusarium population (Kiprop et al. 2002, Sivaramakrishnan et al. 2002b, Belabid et al. 2004).
accurate and rapid identification of genetic variability is necessary for developing resistant cultivars and effective disease control systems. In the recent years, the genetic variability of the pathogen was charact- erized by several types of DNA markers such as RAPD (random amplified polymorphic DNA), RFLP (restriction fragment length polymorphism), SSR (simple sequence repeat) and amplified fragment length polymorphism (AFLP) have been increasingly used to study the variability in pathogenic populations of FOC (Sivaramakrishnan et al. 2002, Jimenez-Gasco et al. 2004, Dubey & Singh 2008, Sharma et al. 2009, Jimnez Gasco et al. 2001, Jimnez Gasco & Jimnez-Diaz 2003, Kelley et al. 1994, Nourollahi & Jalali 2017). SSR markers distinguished the four races of F. oxysporum ciceri causing varied levels of wilting with differential host cultivars (Barve et al.
2001). Bogale et al. (2005) showed that polymorphism revealed with eight SSR markers should be sufficient for study of genetic diversity in
F. oxysporum complex.
Knowledge of the amount and distribution of genetic diversity between and within pathogen populations is a prerequisite for the development of resistant cultivars (Nourollahi et al. 2011). Chickpea breeders need to know the genetic structure and population biology of FOC isolates. However, the characterization of resistance is variable regionally, and therefore, knowledge of genetic variability in different chickpea growing areas is required for resistance deployment (Jimenez-Gasco et al. 2001). The objectives of this work were to determine genetic diversity of Iranian FOC isolates in chickpea farms using SSR marker.
MATERIALS AND METHODS
Fungal isolates and pathogenicity test
Chickpea plants wilt symptoms and black lesions on root were randomly collected in 2012-13 from six different regions including Asemanabad, Eivan, Badreh, Chardavol, Darehshahr and Sarableh in the western of Iran. The regions are different in altitude and climate, and separated by substantial mountain ranges from 50-300 kilometer. Isolates of each region was considered as a population (Table 1, Fig 1). Diseased samples were cut into 2- to 5-mm-long pieces, surface sterilized by dipping into domestic bleach solution (5% NaOCl) for 2–3 min, washed three times with sterile distilled water, dried with sterile filter paper and plated on potato dextrose agar (PDA). Samples were incubated for three days in an incubator at 25°C with a 12-h photoperiod to induce production of conidia. The fungus was isolated and purified using the hyphal tip and single spore method (Hawker 1950). Identified isolates were stored for short time on SNA at 4ºC, however for perennial time stored in tube containing sand at 4°C. Detail of the FOC isolates are presented in Table 1.
The pathogenicity of FOC isolates from the different population was tested in the greenhouse
condition on wilt susceptible local cultivar artificially inoculated. The FOC isolates mass were multiplied separately on sand maize meal medium. Soil of pots for experiment was autoclaved. The mass multiplied inoculum was mixed with the soil in 1:10 proportion and filled in the pre sterilized pots (Miller 1946). Five seeds of susceptible chickpea cultivar seeds were surface sterilized using 2% sodium hypochlorite for 2 min, rinsed in sterile water three times and were sown in pots for each isolate in three replications. Chickpea seedlings were grown in pots containing sand-maize meal and 10% w/w fungus inoculums. The disease symptoms were recorded in 20-22 days at 25 ± 1C with a relative humidity of 40–50%. The seedlings maintained in sterilized soil without inoculums were served as control. The pathogenicity test was confirmed by proving Koch’s Postulate and pathogens were confirmed.
Table 1. Geographical origin of FOC populations from Ilam province, Iran
Isolates Sampling region
No. of isolates
Population number FOC1- FOC18 Asemanabad 18 1
FOC19- FOC37 Eivan 19 2
FOC38- FOC54 Badreh 17 3
FOC55- FOC73 Chardavol 19 4 FOC74- FOC92 Darehshahr 19 5 FOC93- FOC114 Sarableh 22 6
Fig 1. Geographical origins of the six FOC populations from Ilam province, were used in this study.
DNA extraction and SSRs analyses
hexadecyl trimethyl-ammonium bromide (CTAB) procedure (Doyle & Doyle 1987). Genomic DNA was isolated from single spore culture of each isolates (Murray & Thompson 1980). Mycelia were ground in liquid nitrogen and suspended in 2% CTAB extraction buffer (1.4 M NaCl, 0.1 M Tris-HCl, pH 8.0, 20 mM EDTA, 0.2% β-mercaptoethanol). Samples were treated with 5 units RNase at 37°C for 30 min. and then extracted with Chloroform Isoamyl alcohol 24:1 (v/v). DNA in the supernatant was precipitated with isopropanol, rinsed with ethanol, and adjusted to a final concentration of 20 ng.μl-1 in TE (pH 7.4). The quality of the extracted DNA was visually checked on 0.8% agarose gels.
A set of five locus-specific primers pairs for SSRs (Table 2) described by Bogale et al. (2005), were selected. Primer aliquots for each marker were prepared by mixing equimolar amounts of appropriate forward and reverse primer in 1× TE (1mM EDTA, 10 mM Tris–HCl, pH 8.0) and used for the amplifi
cation of individual microsatellite loci. PCR amplification was performed in a 25 μl reaction volume containing 1.5 mM MgCl2, 0.2 mM of dNTPs mix (100 mM of each dNTPs), 1 μl of each forward and reversed primer, 0.6 U of Taq polymerase with 25 ng of template DNA. Amplification was performed using Biometra thermal cycler (USA), PCR conditions for SSR were as Follows, the PCR programmed had one initial denaturation step at 94°C for 3 min Followed by 30 cycles of 94°C for 60 s, annealing for 60 s (appropriate annealing temperature were used for each primers set, Table 2) and 72°C for 2 min. The thermal cycles were terminated by a final extension of 7 min at 72°C. Amplified products were resolved in 2 % agarose gel at 60 V cm-1 using in 1X TBE buffer and stained with DNA Safe Stain at
0.5mg.ml-1 and photographed under UV
Transillaminator with Gel Doc. Intas. A 1 kbp ladder (Gene Ruler TM, Fermantas,) was used as a molecular size standard.
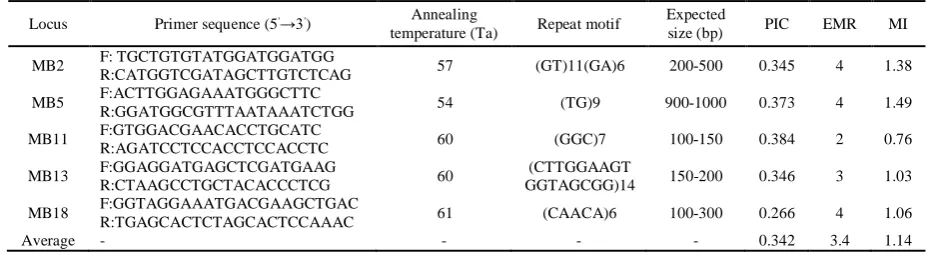
Table 2. SSR primer sequences used in this study (Bogale et al. 2005).
Locus Primer sequence (5'→3') Annealing
temperature (Ta) Repeat motif
Expected
size (bp) PIC EMR MI
MB2 F: TGCTGTGTATGGATGGATGG
R:CATGGTCGATAGCTTGTCTCAG 57 (GT)11(GA)6 200-500 0.345 4 1.38
MB5 F:ACTTGGAGAAATGGGCTTC
R:GGATGGCGTTTAATAAATCTGG 54 (TG)9 900-1000 0.373 4 1.49
MB11 F:GTGGACGAACACCTGCATC R:AGATCCTCCACCTCCACCTC 60 (GGC)7 100-150 0.384 2 0.76
MB13 F:GGAGGATGAGCTCGATGAAG
R:CTAAGCCTGCTACACCCTCG 60
(CTTGGAAGT
GGTAGCGG)14 150-200 0.346 3 1.03
MB18 F:GGTAGGAAATGACGAAGCTGAC
R:TGAGCACTCTAGCACTCCAAAC 61 (CAACA)6 100-300 0.266 4 1.06
Average - - - - 0.342 3.4 1.14
Molecular analysis of the data
Data analyses of populations were defined according to the geographic locations. The bands generated by SSR primers that were repeatable and clearly visible with a high intensity were scored manually for the presence (1) or absence (0) of bands in each isolate. The pair-wise distance among the isolates was calculated from the binary matrix using the simple mismatch coefficient (Sneath & Sokal 1973) that is recommended for haploid fungi (Kosman & Leonard 2005). Genetic similarity between pairs was estimated using Jaccard`s similarity coefficient. Similarity coefficients were used for the construction of UPGMA (Unweighted Pair Group Method with Arithmetic Average) dendrogram (Rolhf 1990). For each primer pair, the polymorphic information content (PIC), marker index (MI) was calculated. The polymorphic information content (PIC) was calculated using PICi =2fi (1-fi), where i is the information of marker I, fi is the frequency of the amplified allele (presence of fragments) and (1 – fi) is the frequency of the null alleles (Roldan-Ruiz et al. 2000). The genetic variation was measured in terms of genetic diversity and was computed by averaging PIC estimates over all loci (Nei and Li 1979). The marker index (MI) was calculated by MI = PIC x EMR, where EMRis
the “effective multiplex relationship” given by the product of the total number of fragments per primer (n) and the fraction of polymorphic fragments (β) (Varshney et al. 2007).
unbiased genetic distance, Based on SSR data, Analysis of molecular variance (AMOVA) tests were performed to assess population variance among and within populations and Principal coordinate analysis (PCA) was performed to evaluate the genetic differences among isolates within populations too, all above calculations were performed using POPGENE ver. 1.31 (Yeh et al. 1999) and Gen Alex ver. 6.5 (Peakall & Smouse, 2006).
RESULTS
Isolates collection and pathogenicity test
A total of 114 isolates of FOC were isolated and purified from infected chickpea plants (Table 1). Based on morphological characteristics, the isolates
were identified as FOC. FOC isolates were identified
according to their morphological and microscopic characters as described by (Jens et al. 1991, Nelson et al. 1983, Barnett and Hunter 1972, Leslie et al. 2006).
Isolates showed significant variations in cultural characteristics, production of microconidia, macro- conidia and chlamydospores. Our morphological identifications were further confirmed by molecular method (PCR) using specific SSR primers used in this study for FOC isolates.
The result of pathogenicity test indicates that FOC isolates were virulent and caused wilting and death of the seedlings in 20-22 days. Characteristic wilt symptoms such as drooping of leaflets and yellowing of the leaves starting from apical part, progressing downward and final wilting of the whole plant were observed. Internal discoloration of the root vascular system was visible in wilted plants.
Allele’s frequency and primers information
Five pair SSR primers were used for amplification of SSR loci of 114 FOC isolates. A total of seventeen alleles were produced by SSR primers with average
of 3.4 alleles in all loci. All isolates amplified a single band ranging from 100 to 1000 bp. Five microsatellite loci were polymorphic when considered over all isolates. The average of allelic variability per locus (H) was the highest (0.281) in Badreh population and the lowest in Dareh Shahr with 0.242 alleles. The allele’s frequency (No. allele) is the highest in Eivan, Badreh and Chardavol with 15 and lowest in Sarableh with 12 alleles (Table 3).
A summary of the genetic diversity data of five microsatellite loci in populations is given in Table 3. Observed allele number (Na = 1.765) was higher in Eivan, Badreh and Chardavol, effective numbers (Ne = 1.533) of alleles was higher in Asemanabad compared to other populations. The amount of genetic diversity (H) and Shannon's Information Index (I) were also higher in Badreh (H= 0.481, I= 0.430) but lower values were estimated for Dareh Shahr (H = 0.242, I= 0.376).
On basis of microsatellite data, the polymorphic information content (PIC) varied from 0.266 (Primer MB18) to 0.384 (Primers MB11), with average of 0.342, which reflects the informative content of the used primers. EMR (effective multiplex relationship ratio) varied from 2 to 4. The marker index (MI), which incorporates the informative content of the marker (PIC), the number of fragments per primer pair and the fraction of polymorphic fragments (EMR), varied from 0.76 (MB11) to 1.49 (MB5) (Table 2).
Genetic variability of populations
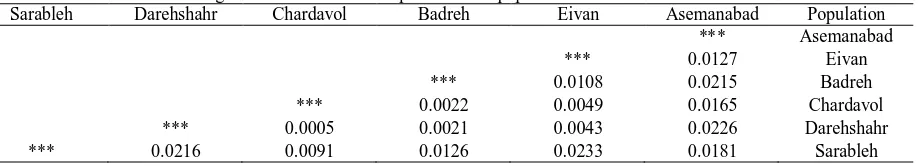
The average genetic distance was calculated among the six populations. Nei’s pairwise genetic distances between the populations varied from 0.0005 to 0.0233. The lowest genetic distance was found between Chardavol and Dareh Shahr, while the highest genetic distance was revealed between Eivan and Sarableh (Table 4).
Table 3. Genetic diversity estimates in FOC populations based on SSR loci.
P % H
I Ne
Na No. of alleles
Population
82.35 0.275
0.413 1.471
1.647 14
Asemanabad
88.24 0.259
0.405 1.405
1.765 15
Eivan
88.24 0.281
0.430 1.457
1.765 15
Badreh
88.24 0.279
0.428 1.451
1.765 15
Chardavol
82.35 0.242
0.376 1.396
1.647 14
Dareh Shahr
88.24 0.277
0.423 1.459
1.765 12
Sarableh
86.27 0.269
0.412 1.44
1.725 14
Average
I = Shannon's Information Index H = Nei's (1973) gene diversity, Ne = Effective number of alleles, Na = Observed number of alleles, P = Polymorphism %
Table 4. Information about genetic distance between pairs of FOC populations.
Sarableh Darehshahr Chardavol Badreh Eivan Asemanabad Population
*** Asemanabad
*** 0.0127 Eivan
*** 0.0108 0.0215 Badreh
*** 0.0022 0.0049 0.0165 Chardavol
*** 0.0005 0.0021 0.0043 0.0226 Darehshahr
Cluster analysis (UPGMA) was used to produce a dendrogram showing the genetic relationships between the populations based on the SSR data, the dendrogram showed a distinction between Asemanabad population and the five remaining populations (Fig. 2).
Fig 2. Dendrogram of genetic relationships between each FOC population constructed by UPGMA.
The total gene diversity (Ht) and gene diversities between subpopulations (Hs) were estimated to be 0.2004 and 0.1880, respectively. Gene diversity attributable to differentiation among populations (Gst) was 0.0618, while gene flow (Nm) was 7.589 (data not shown). The genetic similarity varied from 97% to 99%, in isolates with different geographical origins. A dendrogram based on UPGMA analysis showed three major groups containing isolates with different origins.
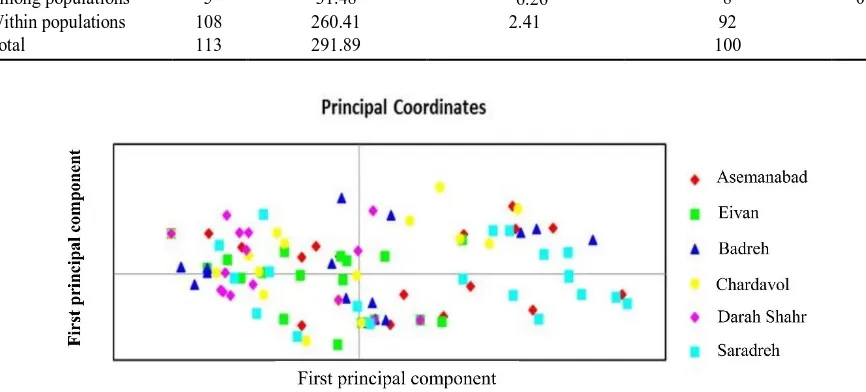
The AMOVA of genetic variation in FOC populationsrevealed that 8% of the variance occurred among populations and 92% within populations (Table 5). PCA (Principal Component Analysis) using SSR
data showed the genetic differences among isolates within populations and gene flow between different populations (Fig. 3), the first and second principal coordinates account for 25.07% and 19.52% of the variation, respectively. There was no clear separation among individuals from different populations, however isolates in the same populations tended to gather together. This suggests the geographical regions of sampling play important role for the formation of populations. PCA allows for visualizing the patterns of genetic relationship without altering the data itself and finds patterns within a multidimensional data set.
DISCUSSION
The present work was carried out to discover the possible utilization of SSR marker for identifying genetic variation in Iranian FOC isolates. In conclusion, the present study generated significant
information about genetic diversity among FOC
isolates, collected from different regions. The study
also highlighted the fact that genetic analysis using
SSR marker is useful tool and have high discriminatory power for studying the diversity in F. oxysporum f. sp. ciceri.
The advantage of microsatellite markers are their high specificity, high polymorphism, good reprodu- cibility and unambiguous scorability (Tenzer et al. 1999, Sahran & Naef 2008). Alleles vary according to the number of repeat units present but other mutations have also been shown to be responsible for allele length variation in SSR analysis (Burgess et al. 2001, Slippers et al. 2004b).
Table 5. Hierarchical molecular analysis of variation (AMOVA) within and between FOC populations based on SSR markers.
P value
percentage of variation Mean of squares (MS)
Sum of squares (SS) df.
Source of variation
0.01 8
**6.26
31.48 5
Among populations
92 2.41
260.41 108
Within populations
100 291.89
113 Total
SSRs provides a powerful tool for taxonomic and population genetic studies (Britz et al. 2002). In this research, SSR markers divided all the FOC population in two major groups. Earlier, 64 FOC
Indian isolates placedinto two major categories with
ISSR and RAPD markers (Dubey & Singh 2008),
similar studies on other plant pathogenic fungi have emphasized the importance of molecular approaches to characterize genetic diversity within and between isolates (Bentley et al. 1995, Nourollahi et al. 2011, Sivaramakrishnan et al. 2002, Belabid et al. 2004). By SSR markers, different allele sizes were recorded in FOC genome, the smallest allele size was detected as 120 bp and the largest one was 1000 bp as reported by Mohammadi et al. (2004). In this study the mean number of PIC value of SSR markers was 0.342, This
PIC value indicates that the isolates had a low degree
of biodiversity. The variable numbers of alleles per loci is an indication of high level of polymorphism, and Polymorphism has been observed in other fungi as a direct record of genetic evolution (Sanders, 2002,
Mwang`Ombe et al. 2007). The polymorphic character
of SSRs produces highly discriminating fingerprints that often allow characterization of fungi at a strain level (Migheli et al. 1998). The analysis performed by AMOVA, indicated that most of variation in the populations is accounted for among individual FOC isolates (98%) and low proportion (2%) of the total genetic variations were accounted for differences among populations.
The results showed that there was a low level of genetic variation among the isolates of FOC populations in sampling regions. The Nm (7.589) indices demonstrated high gene flow and low genetic differentiation among populations. This study suggests that frequent gene flow and recombination between populations of FOC are significantly influenced on the evolution and development of this fungus. This subject is in accordance with previous results of Jimenez-Gasco et al. (2002) who stated that
F. oxysporum f. sp. ciceri is a monophyletic group that derived from a small population or a single individual. Molnar et al. (1990) demonstrated that somatic recombination occurred through parasexuality in F. oxysporum. High degrees of pathogenic and genetic variation in asexual fungi such as F. oxysporum f. sp. ciceri are also observed with accumulation of genetic mutations over time (Gordon & Martyn 1997). In this study, FOC isolates showed a different level of diversity within and between populations in comparison with the worldwide isolates in different researches. Similar results were also reported in F. oxysporum f. sp. phaseoli (Woo et al.1996), F. oxysporum f. sp. ciceri (Jimenez-Gasco et al. 2001), and F. oxysporum f. sp. lentis (Nourollahi & Jalali 2017). Similar findings have also been reported in the Ethiopian F. oxysporum isolates by AFLP, SSR and ITS sequence analysis (Bogale et al. 2006). In Iranian populations, over 92% of the gene diversity was distributed on a local level within
populations. However, there was a high degree of genetic similarity among populations separated by low geographical distances. The low level of gene diversity (Gst = 0.0618) was detected among all populations. The low Gst value indicated little genetic differentiation among the populations and showed little evidence for geographical subdivision among populations (Bayraktar et al. 2010).
The genetic distances were very small, indicates that populations linked by movement of conidia through contaminated seeds, infected plant debris as gene flew because the geographic distances between sampling regions are short with range of 50 to 300 km. Gene flow is one of the evolutionary forces that can have a significant force on the genetic diversity of a population. In the absence of gene flow, genetic drift cause developing different allele frequencies at neutral loci, leading to differentiation in isolate populations (Keller et al. 1997). The high genetic similarity among FOC populations suggests that gene flow occurred across long distances. Infected seed can lead to persistence of genotypes; we consider that infected seed can explain the distribution and diversity of genotypes found at the end of the growing season in natural populations. Genetic drift and selection would limit the number of genotypes present in field populations (Shah et al. 1995). In this study genetic characterization of FOC isolatescould be essential for the efficient management of Fusarium
wilt through use of resistant cultivars in chickpea growing areas. Low FOC genetic diversity in the west of Iran is a warning for breeder to apply the successful use of resistance genes in local disease management; however, understanding of occurrence, distribution, and genetic relatedness of such pathogenic variants is a necessary for developing effective and efficient integrated disease manage- ment. Quarantine regulations will need to prevent the introduction of more diverse isolates into these populations and prevent transmission any isolates from this area to other regions of the country. The present investigation will helps to understand the genetic variability among the isolates of FOC in Iran, which will be useful for its manipulation in regional breeding program for developing wilt resistance variety. Understanding the genetic structure of pathogen populations in the present study may provide insights into the epidemiology and evoluti- onary potential of pathogens and could lead to developing integrated strategies for disease management and breeding programs.
ACKNOWLEDGEMENTS
The financial assistance provided by Ilam
University, is gratefully acknowledged. The authors
are highly thankful to editorial board of Mycologia
Iranica Journal. We also appreciate the reviewers for
REFERENCES
Barnett HL, Hunter BB. 1972. Illustrated genera of imperfect fungi. 3rd, Burgess Publication Company. Burgess Publishing Co, Minneapolis, USA.
Barve MP, Haware MP, Sainani MN, Ranjekar PK, Gupta VS. 2001. Potential of microsatellites to distinguish four races of Fusarium oxysporum f. sp. ciceri prevalent in India. Theoretical and Applied Genetics 102: 138–147.
Bayraktar H, Türkkan M, Dolar FS. 2010. Characterization of Fusarium oxysporum f. sp. cepae from onion in Turkey based on vegetative compatibility and rDNA RFLP analysis. Journal of Phytopathology 158: 691–697.
Belabid L, Baum M, Fortas Z, Bouzand Z, Eujal I. 2004. Pathogenic and genetic characterization of Algerian isolates if Fusarium oxysporum f. sp. ciceri by RAPD and AFLP analysis. African Journal of Biotechnology 3: 25–31.
Bentley S, Pegg KG, Dale JL. 1995. Genetic variation among a worldwide collection of isolates of Fusarium oxysporum f. sp. cubense analyzed by RAPD–PCR fingerprinting. Mycological Research 99: 1378–1384.
Bogale M, Wingfield BD, Wingfield MJ, Steenkamp ET. 2005. Simple sequence repeats markers for species in the Fusarium oxysporum complex. Molecular Ecological Notes 5: 622–624.
Bogale M, Wingfield BD, Wingfield M, Steenkamp ET. 2006. Characterization of Fusarium oxysporum isolates from Ethiopia using AFLP SSR and DNA sequence analyses. Fungal Diversity 23: 51–66.
Britz H, Coutinho T A, Wingfield BD, Wingfield MJ. 2002. Sequence characterized amplified polymorphic markers for the pitch canker pathogen Fusarium circinatum. Molecular Ecological Notes 3: 577–580.
Burgess T, Wing M, Wing B. 2001. Simple sequence repeat markers distinguish among morphotypes of Sphaeropsis sapinea. Applied and Environmental Microbiology 67: 354–362.
Chaudhary RG, Amarjit K. 2002. Wilt disease as a cause of shift from lentis cultivation in Sangod Tehsil of Kota Rajasthan. Indian Journal of Pulses Research 15: 193–194.
Doyle JJ, Doyle JL.1987. A rapid DNA isolation procedure for small quantities of fresh leaf tissue. Phytochemical Bulletin 19: 11–15.
Dubey SC, Singh SR. 2008. Virulence analysis and oligonucleotide fingerprinting to detect diversity among Indian isolates of Fusarium oxysporum f. sp. ciceri causing chickpea wilt. Mycopathology 165: 389–406.
Gordon TR, Martyn RD. 1997. The evolutionary biology of Fusarium oxysporum. Annual Review of Phytopathology 35: 111–128.
Haware MP, Nene YL .1982. Races of Fusarium oxysporum f. sp. ciceri. Plant Disease 66: 809– 810.
Haware MP, Nene YL, Natarajan M. 1996. Survival of Fusarium oxysporum f sp ciceri in soil absence of chickpea. Phytopathologia Mediterranea 35: 9– 12.
Haware MP. 1990. Fusarium wilt and other important diseases of chickpea in the Mediterranean area. Options Mediter Serie Semin 9: 61–64.
Hawker LE. 1950. Physiology of fungi. University of London Press Ltd London.
Jalali BL, Chand H. 1992. In: Diseases of International Importance Diseases of Cereals and Pulses, Vol 1. (US Singh HS Chaube J Kumar and AN Mukhopadhyay, Eds). Prentice Hall Englewood Cliff, New Jersey, USA.
Singh K, Frisvad JC, Thrane U, Mathur SB .1991. An illustrated manual on identification of some seed– borne Aspergilli, Fusaria, Penicillia and their mycotoxins.1st ed. Hellerup, Danish Government Institute of Seed Pathology for Developing Countries, Denmark.
Jimenez–Gasco M, Milgroom MG, Jimenez–Diaz RM. 2002. Gene genealogies support Fusarium oxysporum f. sp. ciceris as a monophyletic group. Plant Pathology 51: 72–77.
Jimenez–Gasco MM, Milgroom MG, Jimenez–Diaz RM. 2004. Stepwise evolution of races in Fusarium oxysporum f. sp. ciceris inferred from fingerprinting with repetitive DNA sequences Phytopathology 94: 228–235.
Jimenez–Gasco MM, Perez–Artes E, Jimenez–Diaz RM. 2001. Identification of pathogenic races 0 1B/C 5 and 6 of Fusarium oxysporum f sp ciceri with Random Amplified Polymorphic DNA (RAPD). European Journal of Plant Pathology 107: 237–248.
Keller SM, McDermott JM, Pettway RE, Wolfe MS, McDonald BA. 1997. Gene flow and sexual reproduction in the wheat glume blotch pathogen Phaeosphaeria nodorum (anamorph Stagonospora nodorum). Phytopathology 87: 353–358.
Khare MN. 1980. Wilt of lentis. Jawaharlal Nehru Krishi Vishwa Vidyalaya Jabalpur MP India 155 pp
Kiprop EK, Baudoin JP, Mwang'ombe AW, Kimani
PM, Mergeai G, Maquet A. 2002.
Characterization of Kenyan isolates of Fusarium udum from Pigeon pea [Cajanus cajan (L). Millsp] by cultural characteristics aggressiveness and AFLP analysis. Journal of Phytopathology 150: 517–525.
Kosman E, Leonard J .2005. Similarity coefficients for molecular markers in studies of genetic relationships between individuals for haploid diploid and polyploid species. Molecular Ecology 14: 415–424.
Fusarium Laboratory Manual, 1st ed. Wiley– Blackwell Publishing, Iowa, USA.
McDermott JM, McDonald BA.1993. Gene flow in plant pathosystems. Annual Review of Phytopathology 31: 353–373.
McDonald BA. 1997. The population genetic of fungi: tools and techniques. Phytopathology 87: 448–453.
Migheli Q, González–Candelas L, Dealessi L, Camponogara A, Ramón–Vidal D. 1998. Transformants of Trichoderma longibrachiatum overexpressing the β–1 4–endoglucanase gene egl1 show enhanced biocontrol of Pythium ultimum on cucumber. Phytopathology 88: 673– 677.
Miller JJ. 1946. Cultural and taxonomic studies on certain Fusaria: ii. The taxonomic problem in Fusarium with particular reference to section elegans. Canidian Journal of Research 24: 213– 223.
Mohammadi M, Aminipour M, Banhashemi Z. 2004. Isozyme analysis and soluble mycelial protein pattern in Iranian isolates of several formae speciales of Fusarium oxysporum. Journal of Phytopathology 152: 267–276.
Molnar A, Sulyok L, Hornok L. 1990. Parasexual recombination between vegetatively incompatible strains in Fusarium oxysporum. Mycolgical Research 94: 393–398.
Murray MG, Thompson WF. 1980. Rapid isolation of high molecular weight plant DNA. Nucleic Acid Research 8: 4321–4325.
Mwang`Ombe AW, Thiong G, Olubayo FM, Kiprop EK. 2007. DNA microsatellite analysis of Kenyan isolates of Rhizoctonia solani from common bean (Phaseolus vulgaris L.). Plant Pathology Journal 6: 66–71.
Nei M. 1973. Analysis of the genetic diversity in subdivided populations. Proceedings of the National Academy of Science USA 70: 3321– 3323.
Nei M. 1978. Estimation of average heterozygosity and genetic distance from a small number of individuals. Genetics 89: 583–590.
Nei M, Li WH. 1979. Mathematical model for studying genetic variation in terms of restriction endonuclease. Proceeding of National Academy Science USA 76: 5269–5273.
Nelson PE, Toussoun TA, Marasas WFO. 1983. Fusarium species: An illustrated manual for identification. The Pennsylvania State University Press University Park 193 pp.
Nene YL, Haware MP. 1980. Screening chickpea for resistance to wilt. Plant Dis 64: 379 –380.
Nene YL, Sheila VK, Sharma SB. 1984. Pulse Pathology Progress Report (ICRISAT). 32: 2–9. Nourollahi K, Jalali M.2017. Analysis of population
genetic structure of Iranian Fusarium oxysporum f. sp. lentis isolates using microsatellite markers. Australasian Plant Pathology 46: 35–42.
Nourollahi K, Javan–nikkhah M, Naghavi MR, Lichtenzveig J, Okhovat SM, Oliver RP, Ellwood SR. 2011. Genetic diversity and population structure of Ascochyta rabiei from the western Iranian Ilam and Kermanshah provinces using MAT and SSR markers. Mycological Progress 10: 1–7.
Peakall R, Smouse PE .2006. GenAlEx 6: genetic analysis in Excel Population genetic software for teaching and research. Molecular Ecology Note 6: 288–295.
Roldan–Ruiz I, Dendauw JE, Van bockstaele E, Depicker A, Loose M. 2000. AFLP markers reveals high polymorphic rates in rye grasses (Lolium spp.). Molecular Breeding 6: 125–126. Rolhf FJ. 1990. NTSYSPc Numerical taxonomy and
multivariant analysis system Version 202 Applied Biostatics New York.
Saharan MS, Naef A. 2008. Detection of genetic variation among Indian wheat head scab pathogens (Fusarium spp./isolates). with microsatellite markers. Crop Protection 27: 1148– 1154.
Sanders IR. 2002. Ecology and evolution of multigenomic arbuscular mycorrhizal fungi. American Naturalist 160: 8 – 41.
Saxena MC. 1990. Problems and potentials of chickpea production in the nineties chickpea in the Nineties India: ICRISAT.
Shah D, Bergstrom GC, Ueng PP. 1995. Initiation of Septoria nodorum blotch epidemics in winter wheat by seedborne Stagonospora nodorum. Phytopathology 85: 452–457
Singh KB, Dahiya BS. 1973. Breeding for wilt resistance in chickpea. In Symposium on Problem and Breeding for Wilt Resistance in Bengal gram IARI New Delhi September 1973 pp 13–14. Sirjusingh C, Kohn LM. 2001. Characterization of
microsatellite in the fungal plant pathogen Sclerotinia sclerotiorum. Molecular Ecology Note 1: 267–269.
Sivaramakrishnan S, Kannan S, Singh SD. 2002b. Detection of genetic variability in Fusarium udum using DNA markers. Indian Journal of Phytopathology 55: 258–263.
Sivaramakrishnan S, Kannan S, Singh SD. 2002. Genetic variability of Fusarium wilt pathogen isolates of chickpea (Cicer arietinum L). Assessed by molecular markers. Mycopathology 155: 171– 178.
Slippers B, Burgess T, Wingfield BD, Crous PW, Coutinho TA, Wingfield MJ. 2004. Development of simple sequence repeat markers for Botryosphaeria spp. with Fusicoccum anamorphs. Molecular Ecology Note 4: 675–677.
Sneath PHA, Sokal RR. 1973. Numerical taxonomy: The principles and practice of numerical classification. WH Freeman and Company San Francisco 573 pp.
C. 1999. Identification of microsatellite markers and their application to population genetics of Venturia inaequalis. Phytopathology 89: 748–753. Varshney RK, Chabane K, Hendre PS, Aggarwal RK,
Graner A. 2007. Comparative assessment of EST– SSR, EST–SNP and AFLP markers for evaluation of genetic diversity and conservation of genetic resources using wild cultivated and elite barleys. Plant Science 173: 638–649.
Woo SL, Zoina A, Sorbo G, Lorito MD, Scala NBF, Noviello C. 1996. Characterization of Fusarium oxysporum f sp phaseoli by pathogenic races VCGs RFLPs and RAPD. Phytopathology 86: 966–973.
یکیتنژ راتخاس
یاه تیعمج
Fusarium oxysporum f. sp. ciceri
ادج
زا هدش
رد دوخن
ملایا ناتسا
یهلارون دونشخ
✉
نارآ یلع هناسفا و
،يکشزپهايگ هورگ ،یزرواشک هدکشناد
ملايا هاگشناد ناريا ،ملايا ،
هديکچ
:
دوخن
(Cicer arietinum L.)يکي
زا
نيرتمهم
تابوبح
رد
ناريا
تسا
.
یراميب
يگدرمژپ
يشان
زا
Fusarium oxysporum f.
sp. ciceri
،
يکي
زا
مهم
نيرت
یراميب
یاه
دوخن دازکاخ
رد
ناهج
تسا
.
نيا
یراميب
رد
لاس
یاه
ريخا
ثعاب
تراسخ
یدايز
رد
قطانم
فلتخم
هدش
تسا
.
یارب
يسررب
عونت
يکيتنژ
رد
114
هيادج
F. oxysporumشش زا هدش ادج
هقطنم
رد
برغ
ناريا
(
آ
نامس
،دابآ
،ناويا ،هلبارس
،هردب
لوادرچ
و
هرد
رهش
)،
هدافتسا هراوهامزير رگناشن زا
دش
.
عومجم زا
جنپ
تفج
رميارپ
هراوهامزير
هدفه
للآ
رد
ره
رد هاگياج
همه
اه تيعمج
ديدرگ صخشم
.
عونت رادقم
نيب رد يمک يکيتنژ
هيادج
یاه
نيا
قطانم
هدهاشم
دش
.
عونت
يکيتنژ
اهتيعمج نورد رد
(H = 0.269)رد
لااب ينژ نايرج نيگنايم رثا
و
هلصاف
یاه
يکيتنژ
نورد رد مک
تيعمج
اه
نيرتمک .دوب نيياپ
هلصاف
يکيتنژ
نيب
هيادج
قطانم یاه
ديدرگ هدهاشم رهش هرد و لوادرچ
.
دادعت
رثؤم یاهللآ
رد
نامسآ
دابآ
رد
هسياقم
اب
رياس
تيعمج
اه
رتشيب
دوب
.
رادقم
يکيتنژ عونت
(H)و
صخاش
تاعلاطا
نوناش
(I)رد
هردب
(H= 0.430, I= 0.281)زين
رتشيب
عونت .دوب
ينژ
لک
و
عونت
ينژ
نيب
ريز
تيعمج
هب اه
بيترت
2004
/
0
و
188
/
0
دوب
.
عونت
ينژ
يشان
زا
توافت
رد
نايم
تيعمج
اه
0618
/
0
دوب
هکيلاح رد
نايرج
ينژ
598
/
7
دوب
.
هيزجت
و
ليلحت
هشوخ
یا
رب
ساسا
UPGMA،
نيرتمک
هلصاف
يکيتنژ
نيب
لوادرچ
و
هرد
رهش
و
سپس
نيب
لوادرچ
و
هردب
ار
ناشن
داد
.
مارگوردند
فلاتخا
یراکشآ
نيب رد ار
نامسآ
دابآ
و
یاهتيعمج
هدناميقاب
ناشن
داد
.
نيا
جياتن
رد
ماقرا حلاصا همانرب
مواقم
ديفم لرتنک یاهشور شرتسگ و دوخن هشير يگديسوپ
دهاوخ
دوب
.یديلک تاملک