Quantifying the Use of Brush Mats in Reducing Forwarder Peak Loads and Surface Contact Pressures
26
0
0
Full text
(2) E. R. Labelle and D. Jaeger. Quantifying the Use of Brush Mats in Reducing Forwarder Peak Loads ... (249–274). 2004). By increasing a soil’s mechanical resistance to penetration, the densification process can have a direct impact on plant growth through a reduction of air exchange and infiltration rate (Forristall and Gessel 1955; Froehlich and McNabb 1984; Corns 1988). The mechanized CTL harvesting method, which dominates in Atlantic Canada, usually requires a harvester to fell and process trees and a forwarder to transport the logs from the machine operating trails to roadside. When applying the CTL method, harvesting equipment travels on trails typically covered by a layer of forest biomass in form of harvest residues (limbs, tops, and foliage of trees) resulting from the processing of felled trees (Fig. 1). This layer of debris acts as a so-called brush mat, which helps to improve traction and prolong trafficability. The brush mat distributes machine loads over a greater area, thereby lowering peak loads exerted on forest soils and, as such, mitigates soil disturbances and related negative impacts on plant growth (Wronski et al. 1990; Bettinger and Kellogg 1993; Richardson and Makkonen 1994). However, the desire to reduce carbon emissions from fossil fuels (oil and natural gas) in combination with their high and volatile price has increased the focus of forest stakeholders in using harvest residues as a source of bioenergy. A pre-requisite for any viable bioenergy operation is that biomass remains free of contaminating mineral soil, thus maintaining its full calorific value (Eliasson 2005). To avoid such contamination, operators have changed the common practice of delimbing trees in front of the harvester thereby creating a brush mat on the trail to delimbing trees on the side of the trail, which leaves the trails bare and unprotected (Eliasson. 2005). With the absence of brush, a machine’s surface contact pressure is directly and fully exerted to the ground, often resulting in increases of soil density and other disturbances. Conversely, brush used on machine operating trails for soil protection cannot be reused for bioenergy generation due to contaminants. In order to optimize the two competing uses of brush, knowledge of minimum quantities and qualities of brush for effective soil protection on machine operating trails is needed. With this knowledge, brush amounts necessary for soil protection could be allocated and the remaining brush, if any, utilized as biofuel without compromising forest soil integrity along machine operating trails. The study attempts to provide necessary information in this respect.. 1.1 Research objectives – Ciljevi istraživanja Prevention of high surface contact pressures exerted by forest machinery is discussed with the following objectives: 1) Quantify (dynamic) forwarder loads transmitted below brush mats of 5, 10, 15, 20, 25, and 30 kg m –2 (green mass) compared to loads without applying any brush mat (0 kg m–2 scenario). 2) Determine minimum amount of brush required to limit the dynamic surface contact pressure acting on the soil to a certain threshold. 3) Quantify the impact of repetitive loadings of brush mats on their ability to distribute machine loads affecting the soil below the mats. In this article, all brush amounts presented, including those used as reference from previous studies, are expressed in green mass. We also defined a loading as the impact associated with a tire passing over the load test area.. 1.2 Impacts of forest machinery on soil physical properties – Utjecaj šumskih vozila na fizikalne značajke tla. Fig. 1 Forwarder operated over a brush covered machine operating trail Slika 1. Forvarder na traktorskoj vlaci pokrivenoj zastorom granjevine. 250. Most machinery used during forest operations are operated in off-road conditions directly on the forest floor. In CTL operations, both harvester and forwarder regularly share the same off-road machine operating trails (normally 3.5 m wide and spaced by 15–20 m from adjacent trail centrelines), which cover approximately 17–23% of the total area to be logged (McNeel and Ballard 1992). This area, directly exposed to machine traffic, is often subject to severe soil property alterations (density increase and/or soil displacement resulting in reduced pore space and lowered hydraulic conductivity) due primarily to the normal load exerted by forest machinery (150 to 400 kN; Kozlowski Croat. j. for. eng. 33(2012)2.
(3) Quantifying the Use of Brush Mats in Reducing Forwarder Peak Loads ... (249–274). 1999). As a soil is being compacted, soil particles are moved closer together, which reduces air voids, in particular macro pores essential for plant growth (Adams and Froehlich 1984; Taiz and Zeiger 1998; Brady and Weil 1999). This reorganization of soil particles usually leads to increased density, which directly increases the soil’s resistance to penetration and lowers infiltration rates (Vepraskas 1988). Soil compaction by a forwarder or skidder in the range of 15–25% compared to pre-impact levels, following a single traffic cycle is not uncommon and has been reported by Voorhees et al. (1978); Bock and Van Rees (2002); and Labelle and Jaeger (2011). The highest increase of soil density usually occurs within the first few traffic cycles (Froehlich 1979; Bradford and Peterson 2000; Han et al. 2006; Syunev et al. 2009). Continuation of traffic further increases soil density but at lower rates (Lockaby and Vidrine 1984; Froehlich et al. 1986; Brais and Camiré 1998; Jamshidi et al. 2008; Han et al. 2009; Labelle and Jaeger 2011). The effect of machine induced soil disturbance may also persist for many years. Residual forest soil compaction has been identified for periods ranging from 15 (Froehlich et al. 1986) to 55 years (Power 1974) on sites in temperate climate zones without winter frost. Five years after mechanized CTL operations on soils exposed to frequent freeze/thaw cycles in New Brunswick, Canada, Labelle and Jaeger (2011) reported no sign of soil bulk density natural rehabilitation. A technique commonly used in CTL operations to avoid rutting on machine operating trails and to keep them operational during high traffic frequencies is to follow the corduroy road construction principle and reinforce the bearing capacity of the trails by having the harvester create a brush layer of limbs, branches, and tree tops (McDonald and Seixas 1997).. 1.3 Effects of brush on reducing soil compaction Djelovanje zastora granjevine na smanjenje zbijanja tla The CTL method was developed in the Nordic countries in the early 1970s (Vidrine et al. 1999). The innovation of this method was the immediate processing of felled trees on-site, directly in the stand. Since its beginning, trees have been delimbed, bucked to appropriate length, and topped on the machine operating trail. This on-trail delimbing process started due to convenience for the operator to process trees in front of the harvester rather than on the side of the trail where boom operating space might be restricted by residual trees. Operating forest machinery on a brush mat proved to be beneficial in lowering rut depth by increasing floatability, which also helped to extend the Croat. j. for. eng. 33(2012)2. E. R. Labelle and D. Jaeger. window of operations into seasons with increased soil moisture content (Tufts and Brinker 1993; McMahon and Evanson 1994; Eliasson and Wästerlund 2007). Since the early 1980s brush has been studied for its potential to reduce soil disturbances. First, Jakobsen and Moore (1981) investigated the impact of brush on soil resistance to penetration (soil impedance) and have been followed by McMahon and Evanson (1994); McDonald and Seixas (1997); Han et al. (2006); and Han et al. (2009). These studies found that brush mats used on machine operating trails had a beneficial impact on mitigating the increase of soil resistance to penetration, in particular when the mats consisted of a thick brush layer of approximately 20 kg m–2. Additionally, brush mats placed on top of soils with high moisture content helped to reduce the increase of penetration resistance by forwarder traffic to a larger extent compared to brush mats applied on dryer soils (McDonald and Seixas 1997; Han et al. 2006). The aforementioned studies are important contributions in understanding the significance of brush mats on maintaining soil integrity but specific effects depend both on site and machine characteristics. Due to the high variability of soil conditions at harvesting sites (soil texture, soil depth, soil moisture content, and organic matter content), combined with varying characteristics of brush, it appears difficult to predict the general reinforcing effect that brush might have on soil bearing capacity. Ideally, it would be preferable to test the effects of various brush amounts on an array of soil types, soil moisture contents, and machine configurations, but current budget, equipment, and logistic restrictions did not allow for these kinds of tests. However, determining the effect of brush mats of varying quantity and quality on alteration of machine load distribution below brush mats uncoupled of soil property variation is one approach to enhance knowledge about brush mat capabilities independent of site characteristics. Shifting the use of brush away from soil protection, in particular with its new competing use as a source of biofuel, could prove costly considering the associated risks of reduced plant growth and the slow natural recovery rate of compacted soils.. 1.4 Functions of a brush mat – Svrha zastora granjevine During the processing phase of CTL forest operations, branches placed directly on the ground in front of forest machines can provide several key functions to protect forest soils. Having branches intertwined within a brush mat increases friction and creates a reinforced surface, which can expand the contact area between machine running gear and the forest soil. At. 251.
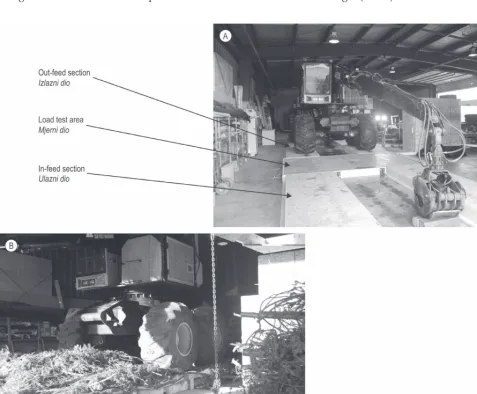
(4) E. R. Labelle and D. Jaeger. Quantifying the Use of Brush Mats in Reducing Forwarder Peak Loads ... (249–274). the broadest level, this increased contact area should reduce average loads per unit area below the entire brush mat. This reduction of average loads is attributed to reduced peak loads directly located underneath tires of the equipment and load transfers in extended areas adjacent to the loading impact in both lateral and longitudinal directions.. 2. Methodology – Metode rada 2.1 Testing device – Naprava za istraživanje To measure and record dynamic loads exerted by forest machines, a prototype load test platform was designed and constructed. This platform allowed for. full-scale tests of loaded forwarders driving over various brush mats to analyze load distribution below the mats. The entire load test platform was composed of three separate sections: ramps, in- and out-feed, and the load test area itself (Fig. 2A). The principal part of the structure was the load test area measuring 4.1 m by 2.5 m for a total area of 10.3 m2 and equipped with 24 high capacity (450 kN) compression load cells, each able to measure independent loads on a 30.5 cm by 30.5 cm resolution. This resolution corresponds to the size of loading plates, a matrix of 104 steel plates forming an engineered surface below which load cells were positioned. This section was constructed and mounted to a concrete base. In- and out-feed sections were built at the same height (19 cm) as the load test area to per-. Fig. 2A Three main sections of load test platform including in- and out-feed sections and load test area and 2B Forwarder traffic over the brush covered load test area Slika 2A. Tri glavna dijela ispitne platforme (ulazni dio, mjerni dio, izlazni dio). 2B. Kretanje forvardera po mjernom dijelu platforme pokrivenom zastorom granjevine. 252. Croat. j. for. eng. 33(2012)2.
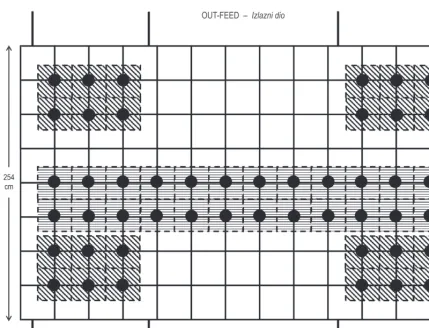
(5) Quantifying the Use of Brush Mats in Reducing Forwarder Peak Loads ... (249–274). E. R. Labelle and D. Jaeger. Fig. 3 Top view schematic of test layouts used during testing. Black circles represent active load cells. Virtual active zones of the clustered test layout (four groups of six load cells) are identified by diagonal lines, while virtual active zones of the transect test layout (two full-width adjacent rows) are shown by horizontal lines Slika 3. Tlocrt skice korištenoga ispitnoga rasporeda. Crni krugovi prikazuju dinamometre. Mjerna područja grupimičnoga ispitnoga rasporeda (četiri grupe po šest dinamometara) prikazana su kosim crtama, a poprečni je mjerni raspored (cijelom širinom, jedan do drugoga dva reda dinamometara) prikazan ravnim crtama. mit testing of the forwarder in a level position(zero percent gradient), thus avoiding potential wheel slip and a change in machine centre of gravity, while also minimizing variations in brush mat compressibility. Furthermore, each in- and out-feed section was of sufficient length to allow the full wheel-base of the forwarder to completely pass the load test area, a key design feature enabling the distinction between discrete loading events.. test layout offered the highest resolution to capture machine footprints with a total active area (91.5 cm by 61.0 cm) per cluster. In addition to obtaining a high load resolution underneath machine tires, it was also of interest to understand how the brush could distribute applied loadings laterally. Therefore, load cells were also installed in a transect layout on two adjacent rows throughout the full width of the load test area (12 load cells wide; Fig. 3).. Depending on the required load resolution, load cells could be placed in different arrangements, in socalled test layouts, within the platform. Two different test layouts (clustered and transect) were used during testing. To specifically quantify the impact of the forwarder, the 24 load cells were first positioned in a clustered test layout (four clusters of six load cells each arranged in two adjacent rows of three load cells wide), directly located in forwarder tracks (Fig. 3). This. 2.2 Sampling procedure – Način uzorkovanja. Croat. j. for. eng. 33(2012)2. 2.2.1 Control parameters – Nadzor parametara To establish control parameters, the Timbco forwarder (specifics in section 2.3) was first driven unloaded over the bare load test platform (without brush cover using clustered test layout). The resulting dynamic loads from each tire were measured by the load cells, enabled by a 25 input channel System 5000 scan-. 253.
(6) E. R. Labelle and D. Jaeger. Quantifying the Use of Brush Mats in Reducing Forwarder Peak Loads ... (249–274). ner, and stored in a StrainSmart data acquisition system (Vishay Micro-Measurements 2011). For data analysis, loads (kN) recorded by each load cell were also converted to surface contact pressure (kPa) by relating the measured load to the surface area of a socalled virtual active zone (930.3 cm2, consisting of four quarters of four adjoining loading plates; (Fig. 3). The control test was replicated once with the forwarder driven over the platform in the same position to verify the accuracy and precision of the load recording system. The same procedure was then repeated with the forwarder loaded with 6,680 kg of dry logs. In order to avoid weight fluctuations of the loaded logs during the four week long testing period, dry logs with relatively stable moisture content were chosen. As a result, we only had a partial load compared to the log bunk’s full capacity of 20 metric tons. 2.2.2 Brush mat construction and forwarder traffic Izrada zastora granjevine i kretanje forvardera After control parameters were assessed, actual testing with brush of varying quantity and quality was performed. Fresh softwood brush (balsam fir Abies balsamea (L.) Mill. and black spruce Picea mariana (Mill.) B.S.P.) collected from on-going mechanized CTL clear felling operations in Fredericton, New Brunswick, Canada was stored inside the unheated storage hall to reduce air drying, while protecting it from precipitation. Prior to any brush amount test, branches used to create the brush mats were characterized individually by specie, diameter, and length. Aside from species identification, branches were assigned to one of four diameter classes (x ≤ 10 mm, 10 mm < x < 30 mm, 30 mm ≤ x ≤ 60 mm, and x > 60 mm) and to one of five length classes (y ≤ 1 m, 1 m < y < 2 m, 2 m ≤ y ≤ 3 m, 3 m < y < 4 m, and y ≥ 4 m). Following classification, branches were weighed with a digital scale and placed perpendicular to the direction of travel on the platform to simulate branch positioning of in-wood delimbing by a harvester until the target brush amount was reached (McMahon and Evanson 1994; Wood et al. 2003; Han et al. 2006; Akay et al. 2007). In each test, brush samples (approx. 150 g) were collected randomly from the brush (branches and needles) to determine branch moisture content by oven drying the material at 105°C until constant mass was reached. Prior to any forwarder traffic, the thickness of each brush mat was assessed. Since the top boundary of the mat was difficult to determine because of its irregular shaped surface, a standard measuring method was developed by placing a known and constant load on a measuring board on top of the mat. The thickness of the mat was then determined by measuring the vertical distance between the bottom of. 254. the measuring board and the surface of the steel load test area. Brush thickness was recorded at six locations, four positioned in track areas and two in outside-track areas before traffic as well as after two, six, and 12 forwarding cycles (a cycle is comprised of two forwarder passes over the load test platform) to quantify brush mat compressibility after repetitive loadings. Once a brush mat was completed and its pre-impact thickness recorded, all load cells were zeroed and forwarder traffic commenced. Due to space limitations at the testing site, the unloaded forwarder was driven backwards (at a speed of 1.5 km h –1) into the hall over ramps and in-feed section onto the load test area and further on to the out-feed section until the front bogie axle passed the load test area (Fig. 2B). After a short interval, the forwarder was driven from the out-feed section at the same speed in a forward movement, again, onto the load test area and over the in-feed section with ramps outside the hall. During these machine passes, all 24 load cells were activated to record dynamic loads. Afterwards, the forwarder was loaded using the same load as in control tests (6,680 kg) and driven over the platform in the same pattern as explained previously. These two unloaded and two loaded passes over the brush mat constituted two forwarding cycles. Similar to in-stand forest operations, where the combination of one unloaded forwarder pass going into the cut block to gather wood and one loaded pass as the forwarder returns to the landing constitutes one forwarding cycle, we also considered one unloaded and one loaded pass over the platform as one complete cycle. However, for easiness of operation we always paired the inward and outward movements of the unloaded and loaded forwarder. A total of 12 forwarding cycles were tested to determine the capacity of the brush mat to attenuate surface contact pressure over repetitive loadings. When all traffic frequencies were completed on a specific brush mat (combination of 12 unloaded and 12 loaded passes), the forwarder was driven outside the hall, the platform was cleared of the compressed brush, and a new brush mat was created from fresh brush for the next test. Replacing brush between tests was essential since the properties of branches (compressibility, yield point, tensile strength, etc.) were likely altered by the effect of machine loadings. Each testing scenario with one of the six brush amounts (5, 10, 15, 20, 25, and 30 kg m–2) over the clustered test layout was replicated twice (three tests in total) to increase statistical power of analyses. Following these tests, load cells were re-positioned into the transect test layout covering the full width of the load test area to Croat. j. for. eng. 33(2012)2.
(7) Quantifying the Use of Brush Mats in Reducing Forwarder Peak Loads ... (249–274). assess the ability of brush mats to distribute loads laterally. With this transect layout, three brush amounts (10, 20, and 30 kg m–2) were tested directly over the steel load test area. Replicates were omitted for this analysis since these tests were mainly conducted to verify the operation and accuracy of the load cells in their new positions prior to testing brush mats on the sand covered load test area. After testing the three brush mats with the transect layout, brush mats of 10, 20, and 30 kg m–2 (each brush amount replicated twice) were tested on top of a 20 cm thick layer of sand placed on the load test area to test the load distributing capabilities of brush mats when applied on a flexible surface. Prior to any tests, the sand layer located on the load test area was compacted using a plate compactor for three minutes. Following the compaction phase, we placed a brush mat on top of the sand layer. Before any trafficking commenced, all load cells were zeroed to account for the added mass of either the brush mat (in clustered layout over steel load test area) or mass of sand and brush mat for all tests performed over the sand covered load test area. Once load cells were zeroed, the forwarder was driven over the mat in the same sequence as for tests without sand layer described before. Once all forwarder traffic cycles had been completed for a respective scenario, brush was removed from the load test area and discarded. Sand was then loosened with a shovel and re-compacted with the plate compactor before testing the next brush mat amount. Lastly, during testing of brush mat scenarios over sand, we collected sand samples to obtain gravimetric moisture content by oven drying the material at 105°C until constant mass was reached. The approach of dividing a peak load from a single load cell by the surface area of a loading plate to derive surface contact pressure (kPa or kN m–2) mentioned previously was straight forward. However, the presence of brush and the sand layer over the load test area made it more difficult to maintain constant positioning of the forwarder in relation to the platform during traffic. To differentiate recorded loads affected by the load distributing capability of varying brush amounts from those loads simply affected by machine positioning, where the load was distributed between adjacent load cells, we summed the peak load and the second highest load (obtained from an adjacent load cell).. 2.3 Forwarder specifications – Značajke forvardera A 2000 Timbco TF820-D forwarder with a tare mass of 23,500 kg and a load capacity of 20,000 kg was used for all tests. This eight-wheel (28L-26 tire size) forwarder had two independent bogie axles. Two OlofsCroat. j. for. eng. 33(2012)2. E. R. Labelle and D. Jaeger. fors steel flexible tracks with widening plates, weighing 1,100 kg each, were installed on the rear bogie axle during all test scenarios. Cross members (10 cm wide) of these steel flexible tracks were spaced by 25 cm. The front bogie axle remained without steel flexible tracks during testing for better manoeuvrability over the load test area of the platform and associated in-/out-feed sections. According to the PASCAL software (FPInnovations’ ground pressure calculator), nominal surface contact pressure underneath the front rubber tired bogie axle was 65 kPa loaded and 35 kPa below the rear loaded bogie axle equipped with tracks (Makkonen 2007). These nominal surface contact pressures are based on a 6,680 kg load. Tire inflation pressure in all eight tires remained constant at 157 kPa throughout the experiment. Unlike the machine movements during regular in-stand forest operations. where the boom of the Timbco is articulated in an upright position in front of the machine, the boom was straight and fully extended in front of the forwarder during all tests to accommodate the limited height clearance inside the testing facility.. 2.4 Statistical analyses – Statistička analiza Statistical analyses were performed with SPSS® (SPSS 2007) and Minitab® (Minitab Inc. 2010) statistical software. Dependant variables were any type of load readings (peak loads, sum of peak and second highest loads, third highest loads) obtained directly from the load cells or peak surface contact pressures once loads were related to the surface area of a loading plate. To determine the impact of an independent variable (brush amount, log bunk load status, forwarder traffic frequency, etc.) on the chosen dependant variable, a series of one-way analysis of variance (ANOVA) tests were performed and a probability level of 0.05 was chosen during all statistical tests.. 3. Results – Rezultati This section is structured according to testing scenarios and will first focus on results obtained when the forwarder was driven directly over the steel load test area, without brush mats. These initial analyses will address: 1) peak loads, 2) the relationship between peak and second highest loads, 3) sum of peak and second highest loads, and 4) the effect of sand on stress propagation. Afterwards, general brush mat characteristics will be presented, followed by analyses of peak loads, sum of peak and second highest loads, and dynamic surface contact pressures recorded below varying brush amounts when exposed to different forwarder traffic frequencies.. 255.
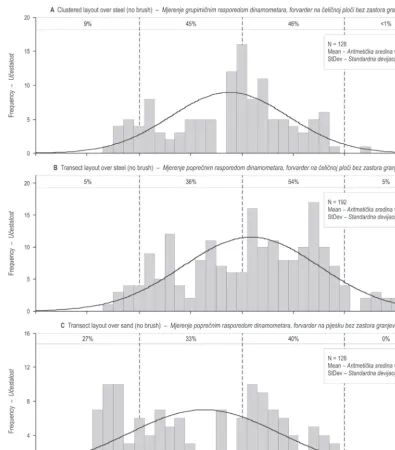
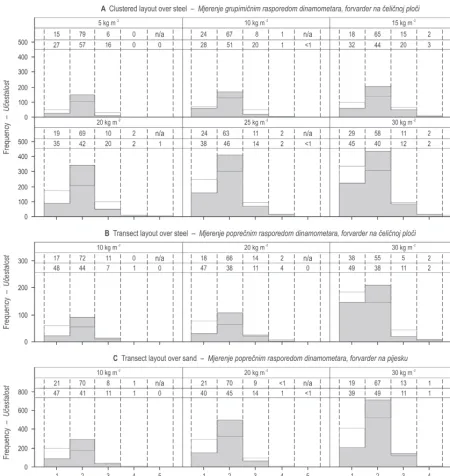
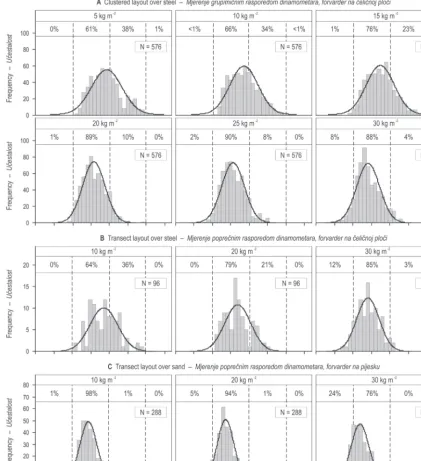
(8) E. R. Labelle and D. Jaeger. Quantifying the Use of Brush Mats in Reducing Forwarder Peak Loads ... (249–274). Fig. 4 Peak load frequency distributions for all three test scenarios (no brush). Numbers shown inside dotted lines indicate the percentage of loads within the respective 10 kN load class and the curves represents a normal distribution Slika 4. Raspodjele učestalosti vršnih opterećenja za sve tri inačice istraživanja, bez zastora granjevine. Brojevi unutar isprekidanih crta označuju udjele opterećenja unutar pojedinih razreda (raspona 10 kN), a krivulje predstavljaju normalne distribucije. 3.1 Effects of machine related variables on load distribution (no brush) – Djelovanje varijabli vozila na raspodjelu opterećenja (bez zastora granjevine) 3.1.1 Peak loads – Vršna opterećenja In the following section, all peak loads presented were recorded when the forwarder was driven directly over the load test area, without any brush mat. To assess. 256. recorded loads, we first analyzed peak load frequency distribution per scenario (clustered layout over steel, transect layout over steel, and transect layout over sand) and presented these results in Fig. 4. In addition to the frequency distribution, we also determined the percentage of peak loads within four 10 kN load classes (numbers between dashed lines) and included normal distribution curves as reference. Croat. j. for. eng. 33(2012)2.
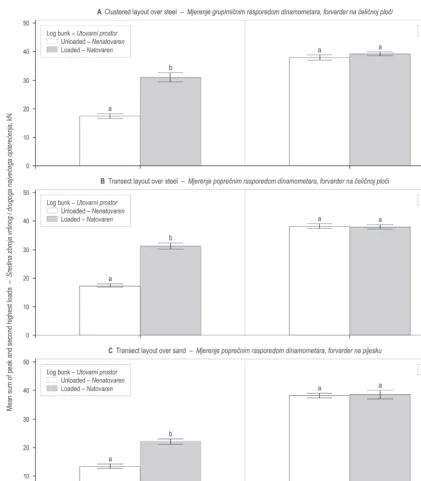
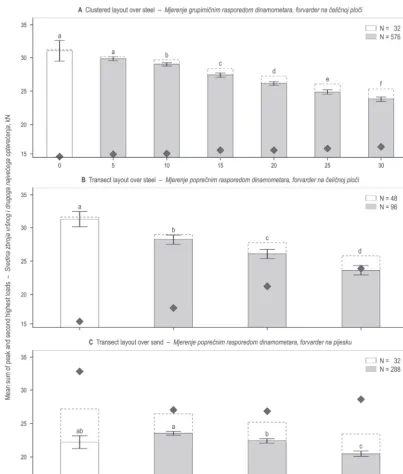
(9) Quantifying the Use of Brush Mats in Reducing Forwarder Peak Loads ... (249–274). Peak loads varied between 7 kN (1 observation) and 32 kN (1 observation) for the clustered test layout (Fig. 4A). Most of the peak loads (91%) were located between 10 and 30 kN and only 9% were below 10 kN. Peak loads recorded from the transect test layout on steel varied from 7 kN (1 observation) to 35 kN (2 observations). With this test layout, 5% of peak loads (10 observations) exceeded 30 kN whereas < 1% were exceeding this load during the clustered test layout. The percentage of peak loads located between 10 and 20 kN (90%) was almost identical to the one obtained from the clustered test layout. Results were different with the transect layout over sand scenario. With the addition of the sand layer, peak loads varied from 5 kN (2 observations) to 28 kN (3 observations) and 27% (35 observations) of peak loads were below 10 kN. The higher percentage of peak loads located below 10 kN in combination with no loads exceeding 30 kN clearly demonstrate the effect of the added sand layer in distributing applied loads. 3.1.2 Relationship between peak and second highest loads – Odnos između vršnoga i drugoga najvećega opterećenja As the area of contact underneath single tires or tracks of the forwarder was always exceeding the surface area of a single loading plate and since machine location in relation to the load test area had the potential to vary between loading events, it was necessary to consider the loads of adjacent loading plates and of the related load cells during the analyses. Simply due to machine positioning, the wheel load exerted by the forwarder could either be recorded by a single load cell with a relatively low load on an adjacent load cell in the case where most of the load was located directly above a single load cell or it could be shared more equally between two or more adjacent load cells. This variation made it difficult when analyzing peak loads of single cells to differentiate between the effect of machine positioning and the effect of brush mats on the recorded loads. Therefore, we first analyzed the relative load distribution between adjacent load cells to identify potential similar pattern between testing scenarios without brush. This was done by first identifying the highest recorded load during a pass of a tire or tracked tire and then identifying the second highest load of an adjacent load cell. In a second step, the second highest peak load was divided by the peak load to derive the relative magnitude of the second highest load in percent of the peak load. Fig. 5 shows the frequency distribution of the relative second highest recorded loads for all three test Croat. j. for. eng. 33(2012)2. E. R. Labelle and D. Jaeger. layouts. If high frequencies of the relative second highest loads had been located in the lower or upper limits of the abscissa, it would indicate relatively low or equally high second highest loads compared to peak loads, respectively. This could also indicate low variation of machine positioning between different tests. It would have then been appropriate to concentrate the analyses mainly on peak loads since either the load exerted to the second load cell is relatively low or similar to the peak load. Results from the clustered layout showed a lower percentage of second highest loads to peak loads in the < 20% class and a higher percentage in the upper > 80% class compared to the transect layout over steel scenario (Figs. 5A and B). This indicates that loads were shared more equally during scenario 1 than they were in scenario 2. When the forwarder was operated directly over the sand covered load test area, only 15% of loads were located below 40% and the number of observations located between 80–100% increased up to 31% (Fig. 5 C) again showing that the sand layer was able to distribute loads more effectively between two adjacent loading plates. However, since the majority of the second highest loads (approx. > 70%) was within the 20 to 80% range of the peak loads, using only peak loads or conversely second highest loads for analyzing the effects of varying brush mats would not have been sufficient. For this reason, the following analyses will mostly focus on the sum of peak and second highest loads since single peaks may be biased by machine positioning, which could hide the effect different brush mats have on load distribution. 3.1.3 Sum of peak and second highest loads – Zbroj vršnoga i drugoga najvećega opterećenja Loads exerted by a forwarder are directly related to the mass acting on the running gear. Consequently, quantifying loads from unloaded and loaded front and rear single tires and separating them per axle was essential in determining accurate loads. Combining loads from front and rear tires could potentially overshadow trends that might be present. When individualizing loads by log bunk load status (unloaded and loaded), we noticed a statistical difference (p = 0.001) of the mean sum of peak and second highest loads between unloaded and loaded rear tires (Fig. 6). Mean sum of peak and second highest loads obtained from single tires of the rear unloaded axle were 16.2, 16.1, and 12.5 kN and increased to 28.9, 29.1, and 20.6 kN when loaded for Figs. 6A, B, and C, respectively. These sum of peak and second highest loads were therefore 78.4, 80.2, and 64.6% higher for loaded than unloaded scenarios for Figs. 6A, B, and C, respectively. However, as the majority of the load on the log bunk is distrib-. 257.
(10) E. R. Labelle and D. Jaeger. Quantifying the Use of Brush Mats in Reducing Forwarder Peak Loads ... (249–274). Fig.5 Percent of second highest load to peak load frequency distributions. Numbers shown inside dotted lines indicate the percentage of loads within the respective percentage class Slika 5. Raspodjela učestalosti udjela drugoga najvećega opterećenja u odnosu na vršno opterećenje. Brojevi unutar isprekidanih crta označuju udjele opterećenja unutar pojedinih postotnih razreda uted to the rear bogie axle, tires from the front axle showed no statistical difference (p = 0.305) between the mean sum of peak and second highest loads recorded from unloaded and loaded test scenarios. Mean sum of peak and second highest loads from front tires showed only a difference of 0.3 to 1.2 kN, (0.5 to 3.3%) between the unloaded and loaded test scenarios.. 258. A priori, we were expecting highest loads to be recorded underneath the rear loaded tires. However, the modest load of 6,680 kg on the log bunk was not enough to exert loads equal to those recorded underneath the front tires, which are located in proximity to the heavy boom, hydraulic rotary system, and the operator cabin. Nevertheless, our analyses mainly foCroat. j. for. eng. 33(2012)2.
(11) Quantifying the Use of Brush Mats in Reducing Forwarder Peak Loads ... (249–274). cused on the loads exerted by the rear tires because most forwarders with rear bogie axles are equipped with steel flexible tracks. The difference in loads of the rear tires between loading regimes (unloaded vs. loaded) was less pronounced for the tests performed over the sand covered load test area and reasons for this will be explained in the discussion. After further analysis, we also determined that loads exerted by single rear axle tires were similar between the two machine sides, thus not requiring machine sides to be separated in upcoming analyses.. 3.2 Effect of the sand layer on stress propagation Djelovanje sloja pijeska na rasprostiranje naprezanja Thus far, mean loads recorded amongst different test layouts have been rather difficult to compare due to the added sand layer, which in itself reduced loads by placing further distance between the actual load and the load cells. Since load cells were zeroed prior to any test, the vertical stress or dead load caused by the sand did not impact the load readings recorded by the load cells. However, because of shearing resistance within the sand layer, applied loads to the sand mass were spread laterally with increasing depth from the area of application. In short, as depth increases, the area over which new stresses occur will increase but the magnitude of the stresses will decrease (McCarthy 2002). Based on Boussinesq’s (1885) equation for stress propagation, Steinbrenner (1936) developed influence coefficients (Id) for calculating the vertical stress distribution in soils caused by a rectangular loaded area using the load per unit area (q) and the vertical stress increase (Δσz) resulting at a certain depth (z) from a loaded area of length (L) and width (B) as obtained by equation 1. Δσz = q · Id. (1). where: ,. ,. Based on equation 1, we calculated that on a loaded area of 0.195 m2 (L = 0.273 m, B = 0.714 m), the 20 cm layer of sand (z = 0.20 m) added on top of the steel load test area lowered applied pressures by 34% compared to pressures recorded directly below the tire (Fang and Daniels 2006). The loaded area described above relates to the contact area below a 28L-26 Firestone tire as Croat. j. for. eng. 33(2012)2. E. R. Labelle and D. Jaeger. equipped on the Timbco forwarder and assumes a 7.6 cm vertical penetration within the sand layer (Firestone 2010). For example, a wheel load of 30 kN applied to a 28L-26 tire (same contact area as stated above), would equal a nominal ground pressure of 153.9 kPa or kN m–2 directly below the tire. At a depth of 20 cm (vertical distance from the tire’s contact area to the location where the stress is calculated) the pressure located underneath the tire would be reduced by 34% to equal 101.6 kPa or kN m–2. It is noteworthy to mention that Boussinesq’s (1885) stress propagation theorem, based on elastic theory, is only an approximation since it was derived for homogeneous, isotropic materials of semi-infinite extent. Steinbrenner’s (1936) influence coefficient also assumes uniform load distribution below the loaded area (Liu and Evett 1992). The mineral sand used as a covering layer on top of the load test area was relatively homogeneous (80% of particles were within 0.3 mm ≤ x ≤ 2.0 mm and average moisture content was 6.7%) but was located on top of a rigid surface, thus not having the same properties in all directions. Unlike the basic assumption of equation 1, load distribution below a forwarder tire is not uniform and is highly influenced by the operating surface. These conditions likely affected the percent reduction described above.. 3.3 General brush mat characteristics – Glavne značajke zastora granjevine A total of 5,511 branches for a combined green mass of 5,550 kg were characterized by species that created the brush mats required for all tests scenarios. Besides differing between species, we also categorized branches in diameter and length classes. We attempted to compose brush mats using similar degrees of branch size and tree tops. The highest frequency of branch diameter, regardless of brush amount, was within class two (1 to 3 cm diameter; Fig. 7). Over 80% of branches used for all brush mats were within diameter class one and two and a maximum of 4% were in the diameter class four (> 6 cm). When averaging all brush mat replicates of the same amount, seven out of 12 mats showed a higher frequency distribution in branch length class two (1 to 2 m), while the other five brush mats had a higher distribution in length class one. The percentage of branches greater than 3 m in length used during testing was quite low and only varied between 0 and 4% of total branches used. Branch and needle moisture content was also monitored for each brush mat and varied between 45.3 and 55.2% of the green mass. In general, brush mats used directly over the steel load test area had an average moisture content of 52.1% compared to 48.8% for. 259.
(12) E. R. Labelle and D. Jaeger. Quantifying the Use of Brush Mats in Reducing Forwarder Peak Loads ... (249–274). Fig. 6 Mean sum of peak and second highest loads presented by single tire and log bunk status directly over load test area (no brush). A different letter indicates a significant difference based on a one-way ANOVA test at the 0.05 probability level Slika 6. Sredina zbroja vršnoga i drugoga najvećega opterećenja prikazanoga za pojedine kotače i (ne)utovarenost vozila neposredno na ispitnom dijelu platforme bez zastora granjevine. Različita slova označuju značajnost razlike na osnovi jednostruke analize varijance za razinu vjerojatnosti od 5 % brush mats used over the sand covered load test area. Explanations for this slight variation will be presented in the discussion. Once the target amount of brush mat was reached (e.g. 20 kg m–2) and branches were placed on the load. 260. test area, brush thickness measurements were recorded pre impact and also following two, six, and 12 forwarding cycles in both track- and outside-track locations. The thickness of all brush mats pre impact was similar for both track and outside-track areas and Croat. j. for. eng. 33(2012)2.
(13) Quantifying the Use of Brush Mats in Reducing Forwarder Peak Loads ... (249–274). E. R. Labelle and D. Jaeger. Fig. 7 Branch diameter and length class frequency distributions. Each figure represents the total frequency for all replicates. Numbers shown inside dotted lines indicate the percentage of branches within the respective branch diameter or length class (rear loaded axle only). Branches were assigned to one out of four diameter classes 1 (x ≤ 10 mm), 2 (10 mm < x < 30 mm), 3 (30 mm ≤ x ≤ 60 mm), and 4 (x > 60 mm) and to one out of five length classes 1 (y ≤ 1 m), 2 (1 m < y < 2 m), 3 (2 m ≤ y ≤ 3 m), 4 (3 m < y < 4 m), and 5 (y ≥ 4 m) Slika 7. Raspodjele učestalosti razreda promjera i duljina grana. Svaki grafikon prikazuje ukupnu učestalost svih ponavljanja. Brojevi unutar isprekidanih crta označuju udjele unutar pojedinoga razreda promjera i duljina grana (samo opterećena stražnja osovina). Grane su pridružene u jedan od četiriju razreda promjera 1 (x ≤ 10 mm), 2 (10 mm < x < 30 mm), 3 (30 mm ≤ x ≤ 60 mm) i 4 (x > 60 mm) te jedan od pet duljinskih razreda 1 (y ≤ 1 m), 2 (1 m < y < 2 m), 3 (2 m ≤ y ≤ 3 m), 4 (3 m < y < 4 m) i 5 (y ≥ 4 m) ranged from 9 cm for the 5 kg m–2 brush mat to 70 cm for the 30 kg m–2 brush mat in the track areas and from 9 cm for the 5 kg m–2 brush mat to 74 cm for the 30 kg Croat. j. for. eng. 33(2012)2. m–2 brush mat for outside-track areas (Fig. 8). Logically, brush mat thickness increased with increasing brush amount. The largest decrease in thickness was. 261.
(14) E. R. Labelle and D. Jaeger. Quantifying the Use of Brush Mats in Reducing Forwarder Peak Loads ... (249–274). Fig. 8 Mean brush mat thickness measured over repetitive loadings at two locations (track and outside track) on the load test area for each brush amount Slika 8. Srednja debljina zastora granjevine mjerena nakon višekratnih opterećenja na dva mjesta (u tragu i izvan traga) ispitne platforme za svaku gustoću zastora granjevine measured between pre impact and following the first two forwarding cycles. Beyond this point, a further increase in loading frequency per test seemed to only slightly reduce brush mat thickness. Regardless of initial brush mat amount, the mean brush mat thickness in track locations was reduced to < 10 cm following 12 forwarding cycles.. 262. 3.4 Effects of brush on machine load distribution Djelovanje zastora granjevine na raspodjelu opterećenja vozila 3.4.1 Peak loads – Vršna opterećenja Following an assessment of machine related variables on loads exerted by the forwarder, we focused Croat. j. for. eng. 33(2012)2.
(15) Quantifying the Use of Brush Mats in Reducing Forwarder Peak Loads ... (249–274). E. R. Labelle and D. Jaeger. Fig. 9 Peak load frequency distributions for varying brush amounts. Numbers shown inside dotted lines indicate the percentage of loads within the respective 10 kN load class and the curves represent a normal distribution Slika 9. Raspodjele učestalosti vršnih opterećenja za različite gustoće zastora granjevine. Brojevi unutar isprekidanih crta označuju udjele opterećenja unutar pojedinih razreda (raspona 10 kN), a krivulje predstavljaju normalne distribucije on analyzing the effect of brush quantity on machine load distribution. As a first analysis, peak load frequency distributions were assessed per brush amount and scenario (Fig. 9). Similar to Fig. 4, percentages of peak loads within 10 kN load classes are shown between dashed lines and normal distribution curves are identified for reference. In the clustered test layout, Croat. j. for. eng. 33(2012)2. frequency distributions increased in the lower peak load classes as brush increased from 5 to 30 kg m–2, and 45 peak loads were below 10 kN. Conversely, frequency distributions of loads greater than 30 kN decreased with increasing brush amount. Specifically, five peak loads exceeded 30 kN with the 5 kg m–2 brush mat and no peak load was beyond 30 kN for the 20, 25, and. 263.
(16) E. R. Labelle and D. Jaeger. Quantifying the Use of Brush Mats in Reducing Forwarder Peak Loads ... (249–274). 30 kg m–2 brush mats (Fig 9 A). During the transect layout over steel, the percentages of peak loads exceeding 20 kN were 36, 21, and 3% for 10, 20, and 30 kg m–2, respectively (Fig. 9B). Generally, peak load distribution for respective brush amounts was similar between scenarios 1 and 2. Once the forwarder was driven over brush mats placed on the sand covered load test area, a considerable reduction in peak loads was observed. In fact, only 1% of all peak loads exceeded 20 kN with the 10 and 20 kg m–2 brush mats and none were beyond 19 kN with the 30 kg m–2 mat. At the maximum brush amount tested, close to a quarter of the peak loads were below 10 kN. 3.4.2 Mean peak loads and mean sum of peak and second highest loads – Srednja vršna opterećenja i sredina zbroja vršnoga i drugoga najvećega opterećenja As mentioned previously, due to the size of single loading plates, machine positioning could influence peak loads by either having the majority of the wheel load recorded by a single load cell or shared more equally between two or three adjacent load cells. However, for a more comprehensive analysis, this study also observed mean peak loads because of their direct impact on soil physical properties. Mean peak loads decreased with the presence of brush compared to tests done directly over the steel load test area (Table 1). On average, the use of a 30 kg m–2 brush mat lowered mean peak loads by 32% compared to when the equipment was driven directly over the steel load test area (averaging both test layouts over steel surface). A similar trend of reduced load with an increase in brush amount was revealed when analyzing both the absolute maximum peak loads and the mean of all loads exceeding the mean load and two standard deviations (Table 1). We also found that mean sum of peak and second highest loads decreased with an increase in brush amount from 5 to 30 kg m–2 (clustered and transect test layouts over steel surface). The percent reduction of mean peak and second highest loads recorded for the steel load test area varied from 2.5 to 5.7% under a 5 kg m–2 brush mat and from 22.1 to 24.9% underneath a 30 kg m–2 brush mat in relation to the no brush scenario (Table 1). Absolute maximum sum of peak and second highest loads recorded underneath the steel load test area covered with a 5 kg m–2 brush mat ranged from 35.0 to 37.6 kN and from 28.8 to 34.3 kN when it was covered with the 30 kg m–2 brush amount. Even when the forwarder was driven over a 10 kg m–2 brush mat placed on the sand covered load test area, absolute maximum sum of peak and second highest loads ranged between 26.2 and 28.5 kN and varied. 264. between 25.6 and 28.1 kN with the 30 kg m–2 brush mat. When combining all replicates, loads from single tires (mean sum of peak and second highest loads from each group of three load cells) from the rear loaded axle recorded during the clustered layout tests decreased from 28.9 kN during the no brush scenario to 22.1 kN for the 30 kg m–2 brush mat, equaling a 23.5% reduction in mean peak load (Fig. 10A). Modifying load cell position from a clustered to a transect test layout provided similar results as mean sum of peak and second highest loads decreased from 29.1 kN with the no brush scenario to 22.0 kN for the 30 kg m–2 brush mat, which translated to a 24.6% load reduction (Fig. 10B). Based on a one-way ANOVA, there was a statistical difference of mean load between 0 and 10 kg m–2 brush mats indicating a beneficial effect of having a minimum of 10 kg m–2 of brush to statistically lower machine loads (Figs. 10A–B). A further increase of brush also lowered mean loads up to the maximum brush amount studied of 30 kg m–2, with statistical differences between each brush amount. During testing with both of these test layouts (Figs. 10 A–B), the mean percentage of the third highest load to the sum of three load cells wide (scenario 1), and the sum of four load cells wide (scenario 2), a so-called half cluster (right ordinate of Fig. 10) increased with additional brush. This result supports the assumption of enhanced lateral load distributing capability of brush mats as brush amounts increase. From our data, we calculated that the addition of a sand layer (20 cm thick) on top of the steel load test area, on average, lowered mean loads recorded below the sand by 25% in comparison to tests done directly over the steel load test area (Fig. 10). Single tires from the rear axle exerted lower mean sum of peak and second highest loads when they were in direct contact with the sand than when the load test area was covered with 10 and 20 kg m–2 brush mats placed on top of the sand (Fig. 10C). This was surprising since we were expecting brush placed on top of the sand layer to further decrease mean loads. However, upon further investigation, we determined that the percentage of the third highest average load to the sum of the half cluster was much higher when the machine was in direct contact with the sand (17%) than when brush was added (11, 11, and 13% for the 10, 20, and 30 kg m–2 brush mats, respectively). A higher percentage here indicates that a higher load is being distributed to the third load cell. Therefore, combining all three highest loads per loading (indicated with dashed lines in Fig. 10C) showed the expected decrease of load from 25.3 kN for the no brush scenario to 21.8 kN for 30 kg m–2 brush amount. Croat. j. for. eng. 33(2012)2.
(17) Table 1 Descriptive statistics of peak loads and sum of peak and second highest loads for all tests (rear loaded axle only) Tablica 1. Opisna statistika vršnih opterećenja i zbroja vršnih i drugoga najvećega opterećenja za sva ispitivanja (samo stražnja opterećena osovina) Quantifying the Use of Brush Mats in Reducing Forwarder Peak Loads ... (249–274). Croat. j. for. eng. 33(2012)2 E. R. Labelle and D. Jaeger. 265.
(18) E. R. Labelle and D. Jaeger. Quantifying the Use of Brush Mats in Reducing Forwarder Peak Loads ... (249–274). Fig. 10 Mean sum of peak and second highest loads per brush amount. A different letter indicates a significant difference based on a oneway ANOVA test at the 0.05 probability level. Mean sum of peak, second, and third highest loads are indicated with dashed lines. Right ordinate identified with rhombus corresponds to the percentage of the mean third highest load to half cluster sum (rear loaded axle only) Slika 10. Sredina zbroja vršnoga i drugoga najvećega opterećenja za različite gustoće zastora granjevine. Različita slova označuju značajnost razlike na osnovi jednostruke analize varijance za razinu vjerojatnosti od 5 %. Sredina zbroja vršnoga, drugoga i trećega najvećega opterećenja označena je isprekidanom crtom. Desna ordinata predstavljena podacima u obliku romba odnosi se na udjel sredine trećih najvećih opterećenja u polovici zbroja klastera (samo stražnja opterećena osovina) 3.4.3 Peak surface contact pressures –Vršni površinski dodirni tlakovi To gain further insight on the capacity of brush mats to mitigate the effects of machine traffic, we re-. 266. lated ground pressures (obtained by dividing a peak load by the surface area of a single loading plate) to a fixed value, referred to as a dynamic surface contact pressure threshold (DSCPT), thereby making comCroat. j. for. eng. 33(2012)2.
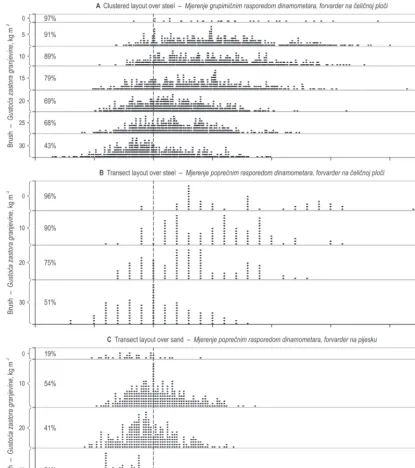
(19) Quantifying the Use of Brush Mats in Reducing Forwarder Peak Loads ... (249–274). E. R. Labelle and D. Jaeger. Fig. 11 Peak ground pressures per brush amount in relation to a 150 kPa dynamic surface contact pressure threshold as identified by vertical dashed line. Percentages indicate the number of surface contact pressures that exceed the threshold. (Rear loaded axle only) Slika 11. Vršni površinski tlak za različite gustoće zastora granjevine u odnosu na granični prag dinamičkoga površinskoga dodirnoga tlaka od 150 kPa (prikazan uspravnim isprekidanim crtama). Postotni udjeli pokazuju broj površinskih dodirnih tlakova koji nadilaze granični prag (samo stražnja opterećena osovina) parisons amongst brush mats, test layouts, and operating surfaces more equitable. Static surface contact pressure thresholds for maintaining soil integrity available from the literature vary from 35 to 80 kPa depending on soil type and soil strength (Olsen and Wästerlund 1989; Owende et al. 2002). However, loads Croat. j. for. eng. 33(2012)2. exerted by the forwarder during testing at the load test platform included dynamic loads and were therefore considerably higher than their static counterpart. To compensate for additional forces (vibratory, rolling, and transient) associated with dynamic testing, we assumed a DSCPT of 150 kPa for a single loading plate.. 267.
(20) E. R. Labelle and D. Jaeger. Quantifying the Use of Brush Mats in Reducing Forwarder Peak Loads ... (249–274). We derived the DSCPT of 150 kPa used for one loading plate by applying a multiplication factor of three to a conservative threshold of 50 kPa. The intention was not to determine an exact threshold at which soil properties are negatively affected, but rather compare all. surface contact pressure scenarios to the same reference value. Forwarder peak surface contact pressures were reduced and generally more concentrated (lower variation) as brush amounts increased from 0 to 30 kg m–2 (Fig. 11). When focusing on tests performed. Fig. 12 Mean sum of peak and second highest loads per brush amount and loaded forwarder passes. A different letter indicates a significant difference based on a one-way ANOVA test at the 0.05 probability level per loaded forwarder pass and brush amount (rear loaded axle only) Slika 12. Sredina zbroja vršnoga i drugoga najvećega opterećenja za različite gustoće zastora granjevine i prolaske opterećenoga forvardera. Različita slova označuju značajnost razlike po prolascima forvardera i gustoći zastora granjevine na osnovi jednostruke analize varijance za razinu vjerojatnosti od 5 % (samo stražnja opterećena osovina). 268. Croat. j. for. eng. 33(2012)2.
(21) Quantifying the Use of Brush Mats in Reducing Forwarder Peak Loads ... (249–274). over the steel load test area (no sand) with load cells placed in the clustered test layout, the percentage of recorded surface contact pressures exceeding the 150 kPa DSCPT decreased from 97 to 43% for 0 and 30 kg m–2 brush amounts, respectively. A similar trend was apparent with the transect test layout over steel where 96% of pressures exceeded the DSCPT threshold when the forwarder was operated directly on steel and only 51% when it was operated over the heaviest 30 kg m–2 brush mat (Fig. 11B). Peak surface contact pressures exceeding the 150 kPa DSCPT with the transect test layout over sand, decreased from 54 to 21% for the 10 and 30 kg m–2, respectively (Fig. 11C). However, even with the 30 kg m–2 brush mats, the percentage of peak pressures exceeding the threshold (21%) was slightly greater than when the forwarder was operated directly over sand without any brush (19%).. 3.5 Effects of repetitive loadings on load distribution below brush mats – Djelovanje višekratnoga opterećivanja na raspodjelu opterećenja ispod zastora granjevine All results presented so far have combined loadings recorded from all forwarding traffic frequencies per test. However, machine trafficability throughout a cut block is a function of wood location and volume making traffic frequency highly variable ranging from a single cycle to 12 cycles or more near a main landing where timber is being accumulated. To determine the ability of a brush mat to distribute loads over repetitive loadings, we averaged loads recorded during 1–2, 3–6, and 7–12 loaded forwarder passes and identified them as two, six, and 12 passes in Fig. 12. In the majority of cases, mean loads increased slightly with an increase of traffic frequency and based on a one-way ANOVA test were statistically significant between two and 12 loaded passes for brush mats of 15, 20, 25, and 30 kg m–2 (Fig. 12A). However, no statistical difference was found in loads recorded between the different passes for the lighter 5 and 10 kg m–2 brush amounts. We also noted that the differences between load distributing/reducing effects of brush mats of varying quantity decreased as traffic frequency increased from two to 12 loaded passes. This indicates that brush mats of higher amounts (e.g. 30 kg m–2) were most beneficial in reducing mean peak loads at lower traffic frequencies. Nevertheless, even after 12 loaded passes the 30 kg m–2 brush mats showed a higher capability to distribute machine loads than the lighter 10 kg m–2 brush mats after just two passes through a statistically significant reduction of mean loads (p = 0.000, p = 0.009, and p = 0.000, for Figs. 12A, B, and C, respectively). Croat. j. for. eng. 33(2012)2. E. R. Labelle and D. Jaeger. 4. Discussion – Rasprava 4.1 Brush mat properties – Značajke zastora granjevine Despite several studies relating the effect of brush mats to changes of soil properties, there is limited literature available on the mechanical properties of branches and none available on the properties of brush mats for mitigating soil disturbances. For effective load distribution, branches used to compose brush mats should have high plasticity and bending strength under loading. Unlike stem wood, branches are composed of reaction wood that is classified as compression or tension wood. Compression wood forms within the lower portion of leaning branches, whereas tension wood is created in the upper portion (Hsu et al. 2005). The modulus of elasticity and tensile strength of compression wood are lower than those of normal wood (Tsoumis 1968). However, compression parallel to the grain and bending strength are higher (Hakkila 1989 in Gurau et al. 2008). Gurau et al. (2008) found that scots pine (Pinus Sylvestris L.) branches (randomly collected from a delimbing operation) had average compression strength of 31.8 MPa, which was 56% less than that of stem wood. Branch wood usually demonstrate higher plasticity than stem wood by bending under compression rather than failing in shearing rupture typically observed for stem wood (Gurau et al. 2008). Overall, branch wood seems to have adequate mechanical properties that would allow brush mats to be effective at lateral and longitudinal load distribution. Generally, a brush mat composed of varying branch sizes and lengths will not react in the same manner to repetitive loadings compared to a single branch. Branches as part of a mat create a reinforced grid through increased internal friction and interlocking effect, thus increasing the overall bending and tensile strengths relative to individual branches. Branch species, through varying density, strength, and moisture content can potentially influence how a specific mat will react to loading forces. In this project, branches from balsam fir and black spruce were used to create brush mats because these are the most common species harvested using a CTL method in New Brunswick, Canada. In this province, softwoods comprise 63% of all Crown land forests (representing 51% of all New Brunswick forests) and from this amount, 80% are classified as balsam fir and spruce (Natural Resources Canada, 2008). This is the main reason why brush mats were composed of branches from balsam fir and black spruce in this study. Furthermore, black spruce is often located on. 269.
(22) E. R. Labelle and D. Jaeger. Quantifying the Use of Brush Mats in Reducing Forwarder Peak Loads ... (249–274). sites with wet soils such as low lying areas with a shallow depth to water table where the need of placing a brush mat on the machine operating trail is increased due to the greater risk of soil disturbance. The composition of brush mats (species, diameter and length of branches, and quantity) likely impacts their ability to reduce machine surface contact pressures. A study focusing on softwood and hardwood brush mat load distribution will be presented in a separate journal article. Branches used to create brush mats for tests on the sand covered load test area had an average moisture content of 48.8% (percent green mass), which was 3.3% lower than the average brush used for tests over the steel load test area. Lower branch moisture content would imply that more material is required to reach a target brush amount, thereby increasing the average mat thickness, than with branches of higher moisture content. This trend was observed in our results as higher brush thickness and it was recorded for most brush mats constructed over the sand covered load test area (lower moisture content) than the ones created directly over steel load test area (higher moisture content). This difference in moisture content is mainly related to the length of time required for testing. Brush amounts tested over the sand covered load test area were performed after all brush mats tested directly over the steel load test area had been completed. This study showed that average brush thickness recorded before machine impact (all scenarios combined) was 19 and 40 cm for 10 and 20 kg m–2 brush amounts, respectively (Fig. 8), which is similar to the results obtained by McMahon and Evanson (1994) where 20 and 40 cm thick radiata pine (Pinus radiata D. Don) brush mats corresponded to 9.2 and 18.6 kg m–2, respectively. Brush diameter can also contribute to the efficiency of brush mats in distributing machine loads. According to Jakobsen and Moore (1981), brush mats with branches of 20 cm diameter or more tend to impede the performance of the steel flexible track and can result in increased soil disturbance. Even though we used four diameter classes, one of which was > 6 cm, no branches or tree tops used in this study exceeded 10 cm in diameter, since this is the operational threshold for merchantable volume of most coniferous tree species in Eastern Canada. In fact, more than 60% of all branches used were in the range of 1 to 6 cm diameter. Based on a sample size of 133 branches collected during a commercial thinning of a radiata pine plantation, McMahon and Evanson (1994) recorded an average branch diameter of 3.3 cm (measured 10 cm away from the end of the stem) in material used to create their brush mats. Han et al. (2006) used Douglas-fir (Pseudotsuga menziesii var. glauca) and western hem-. 270. lock (Tsuga heterophylla) branches < 7.6 cm in diameter to create brush mats of 7.5 kg m–2. Ideally, we believe that having a combination of branch diameters and lengths would increase the overall stability and efficiency of the mat to distribute the applied loads because of increased friction between branches.. 4.2 Effects of brush on machine load distribution Djelovanje zastora granjevine na raspodjelu opterećenja vozila Previous studies focused on determining the effect of machine traffic over brush on soil physical conditions mainly through the assessment of soil mechanical resistance and soil density changes between pre- and post-impact measurements. Even though this study concentrated on loads recorded underneath different brush amounts, our results offered similar trends to what was reported by Han et al. (2006), where a 15 kg m–2 brush mat statistically lowered penetration resistance on a soil of medium moisture condition at a 10 cm depth. Poltorak (2011) also reported benefits of using a 20 kg m–2 brush mat to statistically lower soil density increase (compaction), soil displacement, and soil penetration resistance caused by mechanized forest operations compared to machine traffic directly over bare soil. In a similar study performed by Wronski et al. (1990), it was determined that for every increase of 10 kg m–2 beyond an initial 10 kg m–2 brush density, soil bearing capacity was increased by 25%. In both scenarios of the present study, where brush was in direct contact with steel loading plates, an increase in brush amount lowered the peak loads and also the sum of peak and second highest loads. However, the same could not be concluded for the sand covered scenario since lower mean sum of peak and second highest loads were observed when the forwarder was driven directly over the sand compared to when the sand was covered with 10 and 20 kg m–2 of brush. We assume that the reason for this is the increased surface contact area between both track and tire to the sand in combination with the ability of sand to distribute loads diagonally within the 20 cm thick sand layer. However, expanding the zone of analyses from two to three load cells wide provided similar results (i.e. lower loads as brush increased from 0 to 30 kg m–2) as to when the forwarder was driven over steel rather than sand covered load test area. The amount of brush required to protect forest soils is largely dependent on site characteristics (soil moisture, soil texture, organic content, stand type, etc.) and is therefore difficult to predict (Han et al., 2006). Jakobsen and Moore (1981) suggested that the critical amount of brush required to protect forest soils is 18 kg m–2. Based on the results Croat. j. for. eng. 33(2012)2.
(23) Quantifying the Use of Brush Mats in Reducing Forwarder Peak Loads ... (249–274). obtained from the load test platform, we would recommend leaving a minimum brush layer of 15 to 20 kg m–2 on sensitive sites to lower machine surface contact pressure. Operating heavy equipment on highly susceptible soils (silty clay, clay at high water contents) could require the maximum brush amount tested of 30 kg m–2 or more depending on the number of passes required for timber extraction. It is interesting to explore how much brush is needed to create the recommended brush mat of 20 kg m–2 on sensitive sites and how much biomass would still be remaining for biofuel use. Assuming average softwood stand conditions in New Brunswick with a merchantable volume of 130 m3 ha–1 the total available brush from clear-cut felling operations would amount to 50 green tons per hectare. Approximately 35 green tons per hectare or 70 % of the total brush available would be needed to create a brush mat of 20 kg m–2 covering the entire network of operating trails (average trail width of 3.5 m and spacing of 20 m between adjacent trail centrelines). If site conditions allow for biomass removal and related export of nutrients, this would leave 15 green tons per hectare of forest biomass available for biofuel use.. 4.3 Effects of repetitive loadings on load distribution below brush mats – Djelovanje višekratnoga opterećivanja na raspodjelu opterećenja ispod zastora granjevine In forest operations, the frequency of off-road machine traffic is a function of harvested wood volume, its location throughout a cut block, and the locations and capacities of the landings, and can vary between a single cycle to 12 cycles or more near a main landing where wood is being accumulated (Jakobsen and Moore 1981; McDonald and Seixas 1997; Han et al. 2009). For this reason it was of interest to quantify the received loads below varying brush mats during repetitive loadings. The ability of a brush mat to lower loads transferred below the mat was reduced when traffic frequency increased from two to 12 loaded forwarder passes. Other studies in forested settings also showed similar results where initial brush mats provided adequate protection but deteriorated with increasing machine passes, which in turn made them less effective at minimizing soil disturbance from machine traffic (Han et al. 2006; Akay et al. 2007). In particular, Wronski et al. (1990) reported that brush mats less than 10 kg m–2 had a negligible effect on minimizing rut depth following the first two machine passes. As a brush mat was being compacted by repetitive loadings of the forwarder, some branches were sheared off by the machine running gear which decreased the overall strength of the mat. The difference Croat. j. for. eng. 33(2012)2. E. R. Labelle and D. Jaeger. between mean peak loads recorded after two and 12 loaded passes increased with increasing brush amount. Brush mats of higher amounts (20–30 kg m–2) were more efficient in reducing mean peak loads at lower traffic frequencies but their load distributing capacity remained beneficial even after 12 loaded passes. According to a field study by Han et al. (2006), brush mats of 7.5 and 15 kg m–2 were only effective in minimizing the compactive energy of a forwarder (eight-wheel Valmet 890.1 equipped with steel flexible tracks weighing 31,434 kg loaded) for the first two to three loaded passes after which the brush mats deteriorated and no longer provided adequate support. Considering the similarity between the Valmet used in the study by Han et al. (2006) and the Timbco used in our study, we were not expecting such a difference between the ability of brush mats to lower machine impact. However, during the Han et al. (2006) study, over 70% of the machine operating trail was covered with brush greater than 7.6 cm in diameter and the maximum brush amount tested was only 15 kg m–2. As a comparison, only 4% of total branches used in this study were classified as greater than 6 cm in diameter and our maximum brush amount tested was 30 kg m–2.. 5. Conclusion – Zaključak In this study we intended to quantify the capability of brush mats to laterally distribute induced loads from forwarder traffic to reduce peak loads received below the mats, which have a high potential to severely disturb forest soils. This was done by analyzing the recorded loads below mats of varying brush quantity by using a load test platform. Softwood brush mats > 10 kg m–2 were proven to be beneficial in statistically reducing peak loads of an eight-wheel forwarder compared to a no brush scenario. However, based on results from the dynamic surface contact pressure analyses, we would recommend leaving 15–20 kg m–2 of softwood brush on sensitive sites and up to the maximum amount available for segments of trails located over highly susceptible soils. We also concluded that increasing traffic frequency from two to 12 loaded forwarder passes caused brush mats to lose some of their ability to distribute the applied loads but still remained beneficial at the highest traffic frequency tested. Besides the use of brush for mats on machine operating trails to lower machine impacts, its alternative use as biofuel will further increase. However, leaving sufficient amounts of brush on machine operating trails is essential for proactively mitigating soil disturbances during mechanized forest operations and needs to remain an integral part of best management practices.. 271.
Figure

+7

Related documents