Available online at http://ijdea.srbiau.ac.ir
Int. J. Data Envelopment Analysis (ISSN 2345-458X)
Vol.4, No.3, Year 2016 Article ID IJDEA-00422, 8 pages Research Article
Cross-Efficiency Evaluation Based on an Interval
Method
M. Khodadadi
*a, G. Tohidi
b(a)
Department of Mathematics, Urmia Branch, Islamic Azad University, Urmia, Iran
(b)
Department of Mathematics, Islamic Azad University, Central Tehran Branch, Iran
Received February 21, 2016, Accepted May 27, 2106
Abstract
In data envelopment analysis (DEA), several secondary goals have already been proposed in order to overcome the problem of the DEA alternative optimal weights in the cross-efficiency evaluation. However, in the presence of different secondary goals, the rank assigned to some of decision making units (DMUs) may be non-unique. To overcome the shortcomings, this paper considers the elements of cross-efficiency matrix as interval numbers based on maximum and minimum cross-efficiency that each of the DMUs can achieve. Then, the study using a formula reorders the aggregated interval numbers in each row of the cross-efficiency matrix, and obtains the rank of each of DMUs. The new method removes the problem of the DEA alternative optimal weights in the cross-efficiency evaluation. Moreover, it provides a distinct and unique rank to each of the DMUs. Ultimately, the usefulness of the proposed method in comparison with the previous methods is demonstrated by using a numerical example.
Keywords:Data envelopment analysis (DEA), Cross-efficiency evaluation, Interval numbers.
*
Corresponding Author: [email protected]
1024
1.
Introduction
This paper presents a solution to the problem of the non-uniqueness of the data envelopment analysis (DEA) optimal weights in the cross-efficiency evaluation by considering the elements of cross-efficiency matrix as interval numbers based on intermediate value theorem. DEA which was proposed by Charnes et al. [1] is a non-parametric method for evaluating the relative efficiency of homogenous decision making units (DMUs) such as bank branches, hospitals, production plants, universities, etc. Ranking of the DMUs is one of the important subjects in DEA, and, so far, several methods have been proposed on this issue. Some of these methods were reviewed by Adler et al. [2] Among the ranking methods, the cross-efficiency evaluation which was issued by Sexton et al. [3] is one of the most significant and effective ways. The main idea of cross-evaluation is to use DEA in a peer-cross-evaluation instead of a self-evaluation mode [4]. In the self-evaluation mode, each of the DMUs can achieve the best possible relative efficiency by assigning the most favorable weights to its inputs and outputs, while in the peer-evaluation mode each of the DMUs achieves its efficiency using the weights of the other DMUs. There are two principal advantages of cross-evaluation: (1) it provides a unique ordering of the DMUs and (2) it eliminates unrealistic weight schemes without requiring the elicitation of weight restrictions from application area experts [4].
In spite of the mentioned advantages, the non-uniqueness of the DEA optimal input and output weights decreases the benefit of the cross-efficiency evaluation. As a remedy, Sexton et al. [3] and Doyle and Green [4] suggested the aggressive and benevolent model formulations as secondary goals to deal with the issue of the alternative optimal solutions. The benevolent formulation is benevolent towards the cross-efficiencies of the other DMUs and maximizes them, while the aggressive formulation minimizes the cross-efficiencies of the other DMUs. In addition to the benevolent and aggressive formulations, many other secondary goals and methods have been proposed by different researchers ([6], [7], [8], [9]). But, the
proposed secondary goals may assign the non-unique ranks to some DMUs.
To overcome the mentioned shortcomings in the cross-efficiency evaluation, we consider the elements of the cross-efficiency matrix as interval numbers based on maximum and minimum cross-efficiency that each DMU can obtain. And then using a formula, we compare the aggregated interval numbers and then according to obtained rank by the interval numbers rank the DMUs.
The rest of this paper is organized as follows: Section 2 describes a formula to compare interval numbers and explains the cross-efficiency evaluation method. Section 3, uses the proposed interval method for the cross-efficiency evaluation. To illustrate the usefulness of the proposed method in comparison with the previous results, a numerical example is given in section 4. Ultimately, section 5 concludes the study.
2. Preliminaries
In this section, which is composed of two subsections, we present a brief description about the bases of the proposed method. The subsections are as follows:
2.1. Describing the formula to compare interval numbers
Definition1: An interval number a is defined as a[a aL U, ]{ |x aL x aU}. In the
special case when aL aU, a is called a real number.
Definition 2: Let a [ ,a aL U], b[ , ]b bL U , and 0; then:
1.
a
b
, if aL bL and aU bU. 2. a b [aL b aL, U bU].3. a[aL,aU]. Especially, a 0if
0
[10].
Definition3: Let a and b be interval numbers as a [ ,a aL U] and b[ , ]b bL U , the degree of possibility of abis defined as
(
) max 1 max
U L,0 ,0
a b
b
a
p a b
l
l
(1)1025
To compare n interval numbers [ ,L U], 1,...,
i i i
a a a i n with each other, we first compare each interval number
, 1,..., i
a i n with all interval numbers , 1,...,
j
a j n by using Equation 1. Let ( )
ij i j
p p a a , then we can construct a complementary matrix P as follows:
11 12 1
21 22 2
1 2
n n
n n nn
p p p
p p p
p p p
P
Where pij 0,
p
ij
p
ji
1
, 12
ii
p ,
, 1,..., .
i j n Summing all elements in each row of matrix P, we have:
1
,
1,..., .
n i ij
j
p
p i
n
(2)Now we rank the interval numbers
,
1,...,
i
a i
n
in descending order inaccordance with the value of
p
i ,i1,...,n[10].
2.2. Cross-efficiency evaluation method
In productive activities, we assume that there are n DMUs; each one produces different s outputs from m different inputs. Input and output vectors for DMUj ,
j J
1, ,
n
are denoted by Xj( , ,x1j xmj)T and
1
( , , )yj ysj T
j
Y . All input and output
vectors are semi-positive. That is,
1
( , , )T 0, 0 mj
j
x x
j j
X X and
1
( , , )T 0, 0. sj
j
y y
j j
Y Y
The cross-efficiency method consists of the following steps:
In step 1, the efficiency score of each DMUk
(
k J
1, , )
n
is obtained by solving the following fractional programming problem, (input oriented of the CCR model):| 1, 1, , ,
max , 1 1 T T j K
K k j n
T T
kk K k K j
s m K K U Y U Y
V X U X U 1 V 1
(3)
where
U
K andV
K are the input and output weight vectors of DMUk, respectively. And( 0)
is a non-Archimedean infinitesimal constant. Also kk represents the efficiency score of DMUk.
There is total flexibility in choosing the input and output weights in model (3). This issue allows DMUs to assign the best values for the individual input and output weights and thus achieve the most efficiency score. But total freedom in choosing the weights may cause some problems. Evaluating many of the DMUs as efficient units is one of the resulted problems. Various methods have been proposed to reduce the effects of total freedom of the weights. Cross-efficiency evaluation as one of these methods tries to reduce the effects of total freedom of weights by considering both the self-evaluation and the peer-evaluation efficiency scores in the peer-evaluation process of the DMUs. The Self-evaluated and the peer-evaluated efficiency of the DMUs are as follows:
Suppose (U*k, Vk*) be the optimal weight vector of model (3),
* * T k k kk T k k
U Y
V X
(4)
kk
in equation (4) represents the self-evaluated (CCR) efficiency of DMUk and
* * T k j jk T K j
U Y V X
j J
1, ,
n j
;
k
(5)jk
in equation (5) shows the cross-efficiency of DMUj using the optimal weights of DMUk, and indicates the peer-evaluation of DMUk to DMUj,j J
1, ,
n j
;
k
[8].1026
Table1
Cross-efficiency matrix for n DMUs
DMU1 DMU2 DMUn
DMU1 11 12 1n
DMU2 21 22 2n
DMUn n1 n2 nn
Finally, the average of all
jk , k 1,,nwill indicate the overall efficiency score for DMUj
j J
1, ,
n
;
and n DMUs can be ranked according to their related overall efficiency scores. Under the alternative optimal weight vectors of model (3), the elements of Table 1 are not constant and may alter. Therefore, the overall efficiency score and the assigned ranks to the DMUs may also vary. This issue reduces the usefulness of the cross-efficiency evaluation method. In the next section, we will use our proposed interval method for the cross-efficiency evaluation method.3. An interval method for cross-efficiency evaluation
As mentioned earlier, in the presence of the non-uniqueness of the DEA optimal weights the elements of the cross-efficiency matrix are not fix and may vary. To overcome this problem and assign the unique rank to each of the DMUs, in this section we will try to consider all ranges of the cross-efficiency of the DMUs in to the evaluation process. To this end, firstly, we will propose two models to obtain the maximum and minimum cross-efficiency that each DMU can obtain. Then, based on the intermediate value theorem, we will consider the elements of the cross-efficiency matrix as interval numbers and use the formula of section 2 to rank the interval numbers in each row of the cross-efficiency matrix.
With more detail the proposed method is presented in the following steps:
1) We solve model (3) for all the DMUs and set the CCR efficiency of DMUk (k=1,…,n), i.e.,
kk, as [
kk,
kk] in the diagonal of the cross-efficiency matrix.2) Using the optimal value of model (3) for
DMUk, k =1,…,n, we solve the following two
models:
| 1, 1,..., ,
max ,
, 1 , 1
1,..., , ,
t t
j t t n t k t t
U j t
jk t
k kk t
k j n j k
U Y U Y
V X V X U Y
U V V X
(6)
and
| 1, 1,..., , ,
min ,
, 1 , 1
1,..., , .
t t j t
t n t k t t
L j t
jk t
k kk t
k j n j k
U Y U Y
V X V X
U Y
U V V X
(7)
Then we replace the peer-evaluation of DMUk to DMUj, i.e., jk (j 1, ...,n j, k) with the
interval number
[ , ]
jkL Ujk (j1,..., ,n jk) inthe k th column of the cross-efficiency matrix. By repeating the above process for all
1,...,
1027
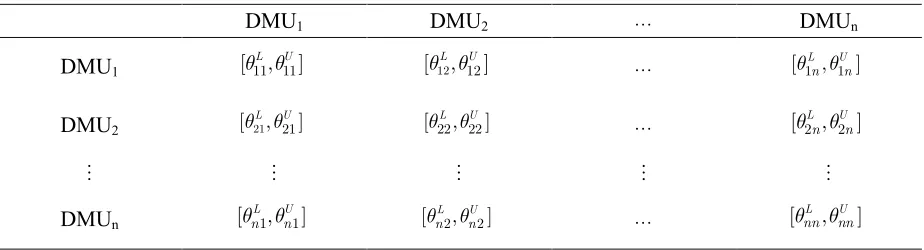
Table 2
Interval cross-efficiency matrix for n DMUs
DMU1 DMU2 DMUn
DMU1 [ ,11 11]
L U
[ , 12L 12U]
[1Ln,1Un]
DMU2 [ , 21L 21U ] [ 22L, U22] [ 2Ln, 2Un]
DMUn [ 1, 1]
L U
n n
[ L2, U2]
n n
[ L , U ]
nn nn
Models (6) and (7) provide the maximum and minimum cross-efficiency that DMUj can achieve under the optimal weight vectors of DMUk. According to the intermediate value theorem, each value of the interval number [ L, U ]
jk jk
can be considered as peer-evaluation
of DMUk to DMUj. Furthermore, all secondary goal models assign a value of the interval number [ L, U ]
jk jk
as peer-evaluation of DMUk
to DMUj.
3) In this step, we use the weight vector
(1 ,
n
,1 )
n
to aggregate the efficiencies in each row of the cross-efficiency matrix. 4) The formula of section 2 is used to rank the obtained interval numbers. When model (3) has a unique optimal weight vector, some interval numbers in Table 2 become real numbers, hence we consider the following points in the comparison process: When a is a real number we define
1 2
(
)
p a
a
. To compare two real numbers we consider them as real numbers.
To compare a real number and an interval number, we consider the real number as the interval number and then compare them. After the comparing process, we consider the real number as the interval number.
As can be seen, the proposed method removes the problem of the alternative optimal
solutions in the cross-efficiency evaluation. Moreover, it provides the distinct and unique rank to each of the DMUs.
In the next section a numerical example illustrates the applicability and usefulness of what were mentioned.
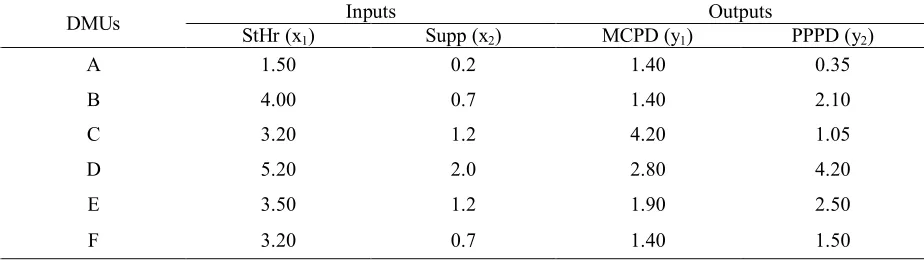
4. Numerical example
In this section, we will consider a case of six nursery homes as an example which was primarily expressed by Sexton et al. [3]. Table 5 reports the relevant input and output data for a given year. These two inputs and three outputs are defined bellow:
StHr (x1): staff hours per day, including nurses, physicians, etc.
Supp (x2): supplies per day, measured in thousands of dollars.
MCPD (y1): total medicare-plus medicaid-reimbursed patient days (0000).
PPPD (y2): total privately paid patient days (0000) [7].
By applying steps 1 and 2 to the given data in Table 3, we obtain the interval cross-efficiency matrix which is illustrated in Table 4.
According to the step 3, the weight vector (1/6,…,1/6) is used to aggregate the efficiencies in each row of the cross-efficiency matrix 4.
1028
Table 3
Input and output data for six nursing homes
DMUs Inputs Outputs
StHr (x1) Supp (x2) MCPD (y1) PPPD (y2)
A 1.50 0.2 1.40 0.35
B 4.00 0.7 1.40 2.10
C 3.20 1.2 4.20 1.05
D 5.20 2.0 2.80 4.20
E 3.50 1.2 1.90 2.50
F 3.20 0.7 1.40 1.50
Table 4
Aggregated values and obtained ranks to DMUs
DMUs A B C D E F
Aggregated
values [0.75,1] [0.7,0.98] [0.64,0.915] [0.72,1] [0.695,0.98] [0.6,0.86]
DMUs’ ranks 1 3 5 2 4 6
Table 5
Comparisons between the proposed method and the other methods
Methods
DMUs
A B C D E F
DMUs’ ranks
Proposed method 1 3 5 2 4 6
Cross-efficiency – benevolent 1 4 5 1 3 6
Liang et al.’s methods [7] 1 4 5 1 3 6
Cross-efficiency – aggressive 1 2 5 2 4 6
Jahanshahloo et al.’s method [6] 1 5 2 3 4 6
As it can be seen from Table 5, in the presence of the different secondary goals, the ranks of DMUs B, C, D and E are not unique and may vary. Moreover, the assigned ranks to DMUs B and D by the aggressive cross-efficiency model ([5]) and to DMUs A and D by the benevolent cross-efficiency model ([5]) or Liang et al.’s method ([7]) are not distinct. However, our proposed method by considering all the ranges of cross-efficiency of the DMUs in the evaluation process presents the unique and distinct rank to all the DMUs. All the methods assign the highest rank to DMU A and the lowest rank to DMU F. The ranking of the DMUs by the proposed method and the aggressive cross-efficiency method are nearly the same.
5. Conclusion
1029 References
[1] Charnes, A., Cooper, W.W., Rhodes, E., Measuring the efficiency of decision making units, Eur. J. Oper. Res. 2, 429–444, 1978.
[2] Adler, N., Friedman, L., Sinuany-Stern, Z., Review of ranking methods in data envelopment analysis context, Eur. J. Oper. Res. 140, 249–265, 2002.
[3] Sexton, T.R., Silkman, R.H., Hogan, A.J., Data envelopment analysis: critique and extensions, 1986, in: Silkman, R.H. (Eds.), Measuring Efficiency: An Assessment of Data Envelopment Analysis. Jossey-Bass, San Francisco, pp. 73–150.
[4] Anderson, T.R., Hollingsworth, K.B., Inman, L.B., The fixed weighting nature of a cross-evaluation model, J. Product. Anal. 18 (1), 249–255, 2002.
[5] Doyle, J., Green, R., Efficiency and cross-efficiency in DEA: Derivations, meanings and uses. J. Oper. Res. Soc. 45, 567–578, 1994.
[6] Jahanshahloo, G.R., Hosseinzadeh Lotfi, F., Jafari, Y., Maddahi., R., Selecting symmetric weights as a secondary goal in DEA cross-efficiency evaluation. Appl. Math. Model. 35, 544–549, 2011.
[7] Liang, L., Wu, J., Cook, W.D., Zhu, J., Alternative secondary goals in DEA cross-efficiency evaluation. Int. J. Prod. Econ. 113, 1025–1030, 2008.
[8] Wang, Y. M., Chin, K. S., A neutral DEA model for cross-efficiency evaluation and its extension. Exp. Syst. Appl. 37(5), 3666–3675, 2010b.
[9] Yang, F., Ang, S., Xia, Q., Yang, C., Ranking DMUs by using interval DEA cross efficiency matrix with acceptability analysis. Eur. J. Oper. Res. 223, 483–488, 2012.