This work is licensed under the Creative Commons Attribution 4.0 International Licence.
To view a copy o this licence, visit https://creativecommons.org/licenses/by/4.0/
A Fuzzy TOPSIS Approach for Big Data Analytics
Platform Selection
Salah Uddin1, Mizanur Rahman2, Samaun Hasan3, Irfan Rana4, Shaikh Muhammad Allayear5
1,2,3,4,5 – Department of Multimedia and Creative Technology, Daffodil International University, Dhaka, Bangladesh 1- ([email protected])
Received (2018-12-23) Accepted (2019-01-24)
Abstract: Day by day data volumes are increasing and Big Data Analytics are analyzing massive datasets, which increasingly occur in web-scale business intelligence problems. The aim of this paper is to demonstrate the use of modify Fuzzy TOPSIS approach for the big data analytics platform selection, which may be used by businesses, public sector institutions to solve multiple criteria decision making problems.
Keywords: Big data analytics, Fuzzy TOPSIS, MCDM, Platform selection.
I. INTRODUCTION
B
ig data sizes are constantly increasing.Big data analytics is where advanced analytic techniques are applied on big data sets. Analytics based on large data samples reveals and leverages business change. The popularity of big data analytics platforms, which are often available as open-source, has not remained unnoticed by big companies. Google uses MapReduce for PageRank and inverted indexes. Facebook uses Apache Hadoop to analyse their data and created Hive. eBay uses Apache Hadoop for search optimization and Twitter uses Apache Hadoop for log file analysis and other generated data[1]. Different Big data analytics platform provides different types of facilities. People follow multiple criteria to select those analytics platform for the business and public sector institutions. Multiple criteria decision making (MCDM) is mostly used in ranking
one or more alternatives from the finite set of available alternatives. Different multi-criteria techniques such as MAXMIN, MAXMAX, SAW, AHP, TOPSIS, SMART, ELECTRE are the most frequently used methods. The TOPSIS (Technique for Order Preference by Similarity to the Ideal Solution) method is one of the most popular method which has simplicity, rationality, comprehensibility, good computational efficiency and ability to measure the relative performance for each alternative in a simple mathematical form.
II. BACKGROUND
1. Data Analysis
Big data analytics help organizations harness their data and use it to identify new opportunities. It also leads to smarter business moves, more efficient operations, higher profits and happier customers.
The most widely used big data analytics platforms are Apache Hadoop, Cloudera, How to cite this article:
50 J. ADV COMP ENG TECHNOL, 5(1) Winter 2019 Hortonworks, Pivotal, MapR, etc [4].
The most widely used business intelligence platforms are BIRT, Jaspersoft, OpenI, SpagoBI etc. The most widely used big data mining platforms are Giraph, GraphLab, IKANOW, KEEL, KNIME, Apache Mahout, Orange, PEGASUS, RapidMiner, Rattle, SAMOA, SPMF or Weka. These are mostly offered in a community open source edition as well as under several commercial editions with broad support for various databases and data sources.
2. The Fuzzy Numbers
Fuzzy numbers have been widely used in engineering disciplines because of their suitability to represent imprecise and vague information. Fuzzy numbers depict the physical world more realistically than single-valued numbers. Among the fuzzy number Triangular Fuzzy Number (TFN) is capable of aggregating the subjective opinions [6].
A triangular fuzzy number (TFN) is described by a triplet (L, M, H) where M is the modal value, L and H are the left (minimum value) and right (maximum value) boundary respectively. TFN has been used to represent stakeholder opinions for criteria which are established through goal models [7].
3. The Fuzzy TOPSIS Algorithm
The Technique for Order of Preference by Similarity to Ideal Solution (TOPSIS) is a multi-criteria decision analysis method. It is used to compare a set of alternatives based on weighted scores of each criterion. In this method two alternatives are hypothesized: positive ideal alternative and negative ideal alternative and then best alternative is selected which is close to the positive ideal solution and farthest from negative ideal alternative [11].
The TOPSIS process is carried out, with a decision-making matrix consisting of 'm' alternatives and 'n 'criteria, as following [7]:
1- Create an evaluation matrix consisting of 'm' alternatives and 'n' criteria.
2- Normalize the decision matrix.
3- Calculate the weighted normalized decision matrix.
4- Determine the worst alternative (A-, FPIS) and the best alternative (A+, FPIS) for criteria.
5- Calculate the distance between the target alternative 'i' and the Fuzzy worst condition and the distance between the alternative 'i ' and the Fuzzy best condition.
6- Calculate the distance between the target alternative 'i' and ideal solution
7- Rank the alternatives.
III. MOTIVATION
The business needs a highly available, flexible, scalable and fault tolerance platform with a good computational complexity to store a big amount of data. It requires a real-time processing platform with a very good data security. Platform has to be easy to deploy with a wide customer support. At present world there are so many big data analytics platform. To select a right platform user generally follow some criteria. The motivation of this work is the unmet demand in the market for analysis and comparison of different big data analytics platform, in a way that helps users to choose based on their needs and limitations. In this work a real world case has been studied and defined the main criteria for platform selection problem (see fig.1).
J. ADV COMP ENG TECHNOL, 5(1) Winter 2019 51 IV. THE PROPOSED METHOD
Fig.2. Proposed Methodology for big data analytics platform selection problem.
The aforesaid decision-making methodology has been applied to a case of platform selection. Eight alternatives were chosen from among the most popular platform after analyzing market (see fig.2). It has been adopted a group decision making approach, three decision makers (DMs) were chosen for weighting the criteria and examination of alternatives against the criteria. The DMs are IT experts who have substantial experience in big data issues and we also followed some special qualification like Position and organization, Knowledge of policy, Interest, Alliances, Resources, Power and Leadership. Thirteen criteria were identified by DMs for decision-making. To collect data DMs has arranged interview of stakeholder. Finally, DMs has got solution based on interview result and research questions (see fig.3).
Fig.3. Conceptual model for data collection system.
1. Criteria selection
Based on of our conceptual model these criteria are selected to choose the most suitable platform satisfying the requirements of various big data analytics challenges.
1. Availability and fault tolerance – networks, servers, and physical storage must be both resilient and redundant, this criterion has the values of linguistic variable very low, low, medium low, medium, very high, high, medium high.
2. Scalability and flexibility – how to add a more scale for unexpected challenges, the criterion has the values of very low, low, medium low, medium, very high ,high, medium high.
3. Performance – data processing time, based on a single transaction or query request, the criterion has the values of very low, low, medium low, medium, very high, high, medium high.
4. Computational complexity – extensions such as data mining and business intelligence tools, the criterion has the values of very low, low, medium low, medium, very high, high, medium high.
5. Distributed storage capacity– to work with different storage systems, how much data needs to be available in storage nodes at the same time, how much data is required to be archived on a periodic basis etc.
J. ADV COMP ENG TECHNOL, 5(1) Winter 2019 52 values of: Transaction processing (1) / Real-time
processing (2) / Batch processing (3),
7. Data security – level of security and tools offered, data are protected, more or less valuable, platform is subject to strict security, compliance or governance requirements.
8. Ease of installation and maintenance – command line interface or graphical user interface, skills and knowledge needed for the deployment of a new solution.
9. User interface and reporting – usability and complexity of features, the criterion has the values of values of very low, low, medium low, medium, very high , high, medium high.
10. Documentation and support – to simply describe each feature of the tool, technical and customer support.
11. Sustainability of the solution – the cost associated with the skills maintenance, configuration, and adjustments to the level of agility in development, how much data the organization will need to manage and process today and in the future.
12. Policy and regulation – related to the deployment of the selected solution such as privacy policy, law conflicts and restrictions of the use.
13. Cost – what a customer wants, how much can be spent on, the criterion offers these options: Open source (1) / Trial version (2) / Commercial release (3).
2. Criteria Analysis
The criteria has been analyzed to check which criteria has high interest & high influence based on stakeholder opinion.
Fig.4. Mind Map for Criteria Analysis.
3. Solution using Fuzzy TOPSIS Algorithm
Fuzzy TOPSIS approach has been applied to solve the MCDM problem because of its numerous advantages: (1) the processing of TOPSIS fits the human decision selection process; (2) the best and the worst solutions are compared quantitatively; (3) it is easy to calculate and implement the algorithm.
Step1: For each criterion a fuzzy importance weight (Wj) is defined. The decision-makers use the linguistic weighting variables to assess the importance of the criteria (Table 1); the ratings of alternatives are represented by linguistic rating variables (Table 2). The linguistic variables is developed by Chen & Hwang [9] and used by the DMs are transformed into triangular fuzzy numbers.
Fig. 5. The fuzzy linguistic variables for each criterion
Table 1. Fuzzy linguistic terms and their correspondent fuzzy numbers for each criterion
Importance Abbreviation TFN
Very Low VL (0, 0, 0.2)
Low L (0.05, 0.2, 0.35)
Medium Low ML (0.2, 0.35, 0.5)
Medium M (0.35, 0.5, 0.65)
Medium High MH (0.5, 0.65, 0.8)
High H (0.65, 0.8, 0.95)
53 J. ADV COMP ENG TECHNOL, 5(1) Winter 2019 Fig. 6. The fuzzy linguistic variables for each alternative
Importance Abbreviation TFN
Very Poor VP (0, 0, 0.2) Poor P (0.05, 0.2, 0.35) Medium Poor MP (0.2, 0.35, 0.5) Fair F (0.35, 0.5, 0.65) Medium Good MG (0.5, 0.65, 0.8) Good G (0.65, 0.8, 0.95) Very Good VG (0.8, 1, 1)
Table 2. Fuzzy linguistic terms and their correspondent fuzzy numbers for each alternative
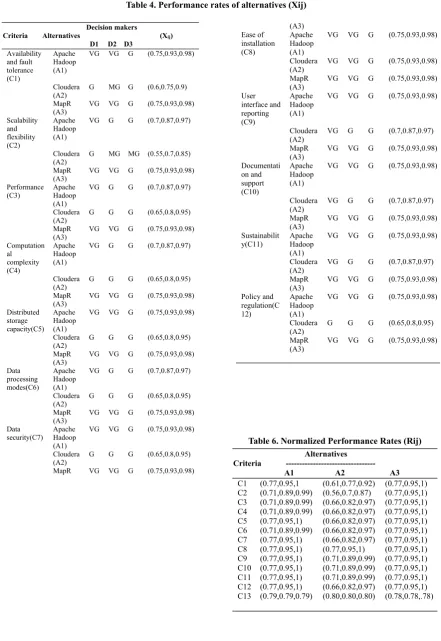
Both the weights of the criteria and the performance ratings of alternatives against the criteria are determined by these three decision-makers and aggregated into triangular fuzzy numbers (table 3,4).
Wj=(Wj1, Wj2, Wj3) ;
𝑤𝑤��� ��1𝑘𝑘�� 𝑤𝑤��� �
���
;
𝑤𝑤��� ��𝑘𝑘�� 𝑤𝑤1 ��� �
���
𝑤𝑤��� ��𝑘𝑘�� 𝑤𝑤1 ��� �
��� ;
Here k = number of DM & j=1,2,..,n ;
Xij = (αij, βij, πij) ;
𝛼𝛼��� ��𝑘𝑘�� 𝛼𝛼1 ��� �
��� ;
𝛽𝛽���� �1𝑘𝑘�� 𝛽𝛽��� �
���
𝛾𝛾��� ��1𝑘𝑘�� 𝛾𝛾��� �
���
Here i=1,2,...,m & j=1,2,..,n ;
Table 3. Weights of criteria solicited from three decision makers (Wj)
Decision makers
Criteria --- Aggregate Weight (Wj)
D1 D2 D3
Availability and fault
tolerance VH H VH (0.75,0.93,0.98) Scalability and
flexibility H VH MH (0.65,0.82,0.92) Performance VH VH H (0.75,0.93,0.98) Computational
complexity L L L (0.05,0.2,0.35) Distributed storage
capacity VH H VH (0.75,0.93,0.98) Data processing
modes M VH M (0.50,0.67,0.77)
Data security VH VH VH (0.8,1,1) Ease of installation
and maintenance VH MH H (0.65,0.82,0.92) User interface and
reporting H M MH (0.50,0.65,0.80) Documentation and
support MH H H (0.60,0.75,0.90) Sustainability L M L (0.15,0.30,0.45) Policy and regulation M M H (0.45,0.60,0.75)
Cost MH H M (0.50,0.65,0.80)
The Thirteen criterion (Price per month $) is deterministic and inquired of the clients. Thus the prices are presented as crisp numbers that can easily be transformed into triangular fuzzy numbers and treated as TFN in Fuzzy-TOPSIS procedures.
Table 5- Price of the Alternatives
Alternative Apache
Hadoop (A1) Cloudera (A2) MapR (A3)
Cost (C13) 495 490 500
Step 2: Once the weights of the criteria and ratings of the criteria are obtained then it needed to normalize performance rates.
𝑅𝑅��� �𝛼𝛼𝛿𝛿��� ,
𝛽𝛽��
𝛿𝛿�,
𝛾𝛾��
𝛿𝛿�� � 𝛿𝛿�� ��� �𝛾𝛾���
; For Benefit Criteria
𝑅𝑅��� �𝛿𝛿 �
𝛼𝛼�� ,
𝛿𝛿�
𝛽𝛽��,
𝛿𝛿�
𝛾𝛾��� � 𝛿𝛿
�� ��� �𝛼𝛼 ���
54 J. ADV COMP ENG TECHNOL, 5(1) Winter 2019 Decision makers
Criteria Alternatives (Xij) D1 D2 D3
Availability and fault tolerance (C1) Apache Hadoop (A1)
VG VG G (0.75,0.93,0.98)
Cloudera
(A2) G MG G (0.6,0.75,0.9) MapR
(A3) VG VG G (0.75,0.93,0.98) Scalability and flexibility (C2) Apache Hadoop (A1)
VG G G (0.7,0.87,0.97)
Cloudera
(A2) G MG MG (0.55,0.7,0.85) MapR
(A3) VG VG G (0.75,0.93,0.98) Performance
(C3) Apache Hadoop (A1)
VG G G (0.7,0.87,0.97)
Cloudera
(A2) G G G (0.65,0.8,0.95) MapR
(A3) VG VG G (0.75,0.93,0.98) Computation al complexity (C4) Apache Hadoop (A1)
VG G G (0.7,0.87,0.97)
Cloudera
(A2) G G G (0.65,0.8,0.95) MapR
(A3) VG VG G (0.75,0.93,0.98) Distributed storage capacity(C5) Apache Hadoop (A1)
VG VG G (0.75,0.93,0.98)
Cloudera
(A2) G G G (0.65,0.8,0.95) MapR
(A3) VG VG G (0.75,0.93,0.98) Data processing modes(C6) Apache Hadoop (A1)
VG G G (0.7,0.87,0.97)
Cloudera
(A2) G G G (0.65,0.8,0.95) MapR
(A3) VG VG G (0.75,0.93,0.98) Data
security(C7) Apache Hadoop (A1)
VG VG G (0.75,0.93,0.98)
Cloudera
(A2) G G G (0.65,0.8,0.95) MapR VG VG G (0.75,0.93,0.98)
(A3) Ease of installation (C8) Apache Hadoop (A1)
VG VG G (0.75,0.93,0.98)
Cloudera
(A2) VG VG G (0.75,0.93,0.98)
MapR
(A3) VG VG G (0.75,0.93,0.98)
User interface and reporting (C9) Apache Hadoop (A1)
VG VG G (0.75,0.93,0.98)
Cloudera
(A2) VG G G (0.7,0.87,0.97)
MapR
(A3) VG VG G (0.75,0.93,0.98)
Documentati on and support (C10) Apache Hadoop (A1)
VG VG G (0.75,0.93,0.98)
Cloudera
(A2) VG G G (0.7,0.87,0.97)
MapR
(A3) VG VG G (0.75,0.93,0.98)
Sustainabilit
y(C11) Apache Hadoop (A1)
VG VG G (0.75,0.93,0.98)
Cloudera
(A2) VG G G (0.7,0.87,0.97)
MapR
(A3) VG VG G (0.75,0.93,0.98)
Policy and regulation(C 12) Apache Hadoop (A1)
VG VG G (0.75,0.93,0.98)
Cloudera
(A2) G G G (0.65,0.8,0.95)
MapR
(A3) VG VG G (0.75,0.93,0.98)
Table 6. Normalized Performance Rates (Rij) Alternatives
Criteria
A1 A2 A3
55 J. ADV COMP ENG TECHNOL, 5(1) Winter 2019 Step 3: The normalized performance rates
are multiplied by the weight of criteria to give weighted normalized performance rates (table 7) performance rates.
Table 7. Weighted Normalized Performance Rates Vij = Rij* Wj.
Alternatives
Criteria
A1 A2 A3
C1 (0.58,0.88,0.98) (0.46,0.72,0.90) (0.58,0.88,0.98) C2 (0.46,0.73,0.91) (0.36,0.57,0.80) (0.5,0.78,0.92) C3 (0.53,0.83,0.97) (0.50,0.76,0.95) (0.58,0.88,0.98) C4 (0.04,0.18,0.35) (0.03,0.16,0.34) (0.04,0.19,0.35) C5 (0.58,0.88,0.98) (0.5,0.76,0.95) (0.58,0.88,0.98) C6 (0.36,0.60,0.76) (0.33,0.55,0.75) (0.39,0.64,0.77) C7 (0.62,0.95,1) (0.53,0.82,0.97) (0.62,0.95,1) C8 (0.50,0.78,0.92) (0.50,0.78,0.92) (0.5,0.78,0.92) C9 (0.39,0.62,0.80) (0.36,0.58,0.79) (0.39,0.62,0.8) C10 (0.46,0.71,0.90) (0.43,0.67,0.89) (0.46,0.71,0.9) C11 (0.12,0.29,0.45) (0.11,0.27,0.45) (0.12,0.29,0.45) C12 (0.35,0.57,0.75) (0.30,0.49,0.73) (0.35,0.57,0.75) C13 (0.40,0.51,0.63) (0.40,0.52,0.64) (0.39,0.51,0.62)
Step 4: Now it is necessary to calculate the fuzzy positive and negative ideal solutions (FPIS and FNIS) by using the weighted normalized performance rates matrix (table 8).
𝐴𝐴�� ���
������ ; 𝐴𝐴�� ��������� ;
� � ���� � � � ; � � ���� � � �
Table 8. Positive and negative ideal solutions
Ideal Solutions Criteria
A+ A-
C1 (0.90,0.98,0.98) (0.27,0.27,0.31) C2 (0.91,0.91,0.92) (0.23,0.23,0.27) C3 (0.97,0.97,0.98) (0.31,0.31,0.35) C4 (0.34,0.35,0.35) (0.02,0.02,0.02) C5 (0.98,0.98,0.97) (0.35,0.38,0.42) C6 (0.76,0.76,0.77) (0.21,0.23,0.23) C7 (0.99,1,1) (0.37,0.37,0.41) C8 (0.92,0.92,0.92) (0.3,0.33,0.36) C9 (0.79,0.8,0.8) (0.26,0.31,0.31) C10 (0.89,0.9,0.9) (0.28,0.31,0.34) C11 (0.45,0.45,0.45) (0.06,0.07,0.08) C12 (0.74,0.75,0.75) (0.14,0.16,0.18) C13 (0.7,0.78,0.8) (0.39,0.4,0.4)
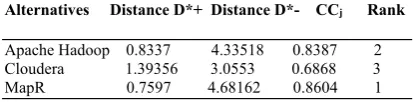
Step 5: For each alternative (B=(b1,b2,b3))
its distances to FPIS(A+=(a
1,a2,a3)) and
FNIS(A+=(a1,a2,a3)) are calculated. Then
closeness coefficients (CCj) are calculated for each alternative which is the final measure of suitability of the alternatives. Finally, the alternatives are ranked based on their CCj. (table 9) by these three decision-makers and aggregated into triangular fuzzy numbers.
𝐷𝐷��∗ � �𝑎𝑎�� 𝑏𝑏����12�𝑎𝑎�� 𝑏𝑏����𝑎𝑎�� 𝑎𝑎��
� �𝑏𝑏�� 𝑏𝑏���
�19 ��𝑎𝑎�� 𝑎𝑎���� �𝑎𝑎�� 𝑎𝑎���
� �𝑏𝑏�� 𝑏𝑏���� �𝑏𝑏�� 𝑏𝑏����
�19��𝑎𝑎�� 𝑎𝑎���𝑎𝑎�� 𝑎𝑎��
� �𝑏𝑏�� 𝑏𝑏���𝑏𝑏�� 𝑏𝑏��� �16 �2𝑎𝑎�
� 𝑎𝑎�� 𝑎𝑎���2𝑏𝑏�� 𝑏𝑏�� 𝑏𝑏��
𝐷𝐷
�∗�� ∑
����𝐷𝐷
��∗;
� � ���� � � �
;
𝐷𝐷
�∗�� ∑
𝐷𝐷
��∗ ����
;
� � ���� � � �
;
𝐶𝐶𝐶𝐶
�� �
𝐷𝐷
���
𝐷𝐷
���� 𝐷𝐷
���
Table 9. The distances of alternatives to positive/negative
ideal solutions, the related closeness coefficients (CCj)
and the rankings.
Alternatives Distance D*+ Distance D*- CCj Rank
56 J. ADV COMP ENG TECHNOL, 5(1) Winter 2019 V. CONCLUSION
The aim of this paper is to provide a better guideline to select appropriate big data analytics platform for starting new business or private organization. A modified Fuzzy TOPSIS approach has been proposed to solve this problem. Fuzzy-AHP and other multiple attributes decision making approach can also be used in this problem. But those techniques have some limitations and they do not give higher priority of Stackholder opinions. But Fuzzy TOPSIS approach gives more priority of Stakeholders opinions. Although different researchers have used Fuzzy TOPSIS approach different way. A new Fuzzy TOPSIS approach has been introduced here to solve multi-criteria and sub-multi-criteria based problem after analyzing all the approaches of Fuzzy TOPSIS. Finally, it has been proved that following new Fuzzy TOPSIS approach any person can easily solve their problems.
REFERENCES
1. Saecker, M., & Markl, V. (2. Big Data Analytics on Modern Hardware Architectures: A Technology Survey. In M. A. Aufaure & E. Zimányi (Eds.), Business Intelligence (pp. 125-149). Berlin Heidelberg: Springer..
2. Elgendy, N., & Elragal, A. (2014). Big Data Analytics: A Literature Review Paper. In P. Perner (Ed.), ICDM 2014. LNAI, vol. 8557 (pp. 214-227). Heidelberg: Springer..
3. Lněnička, M., & Komárková, J. . An Overview and Comparison of Big Data Analytics Platforms. In Sborník příspěvků z mezinárodní vědecké konference MMK 2014 (pp. 3446-3455). Hradec Králové: Magnanimitas.
4. TIEN-CHIN WANG, HSIEN-DA LEE and CHUAN-CHENG WU. A Fuzzy TOPSIS Approach with Subjective Weights and Objective Weights.
5. Mohammad Dabbagh, S.P.L. (2014) An Approach for Integrating the Prioritization of Functional and Nonfunctional Requirements. The Scientic World Journal, 2014, Article ID: 737626.
6. Arfan Mansoor, Detlef Streitferdt, Franz-Felix Füßl. Alternatives Selection Using GORE Based on Fuzzy Numbers and TOPSIS.
7. Chen-Tung, Ch., "Extensions of the TOPSIS for group decision-making under fuzzy environment",Fuzzy Sets and Systems, Volume 114, 2000.
8. S. J. Chen and C. L. Hwang, Fuzzy Multiple Attribute Decision Making, (Lecture Notes in Economics and Mathematical System Series 375).Springer-Verlag. New York, 1992.
9. C.-B. Cheng, 2004. Group Opinion Aggregation Based on a Grading Process: A Method for Constructing Triangular Fuzzy Numbers. Computers and Mathematics with Applications 48:1619-1632.
10. D. Dubois and H. Prade. 1980. Fuzzy Sets and Systems: Theory and Applications. Academic Press, New York, 393 pp.
11. C. Elkan, 1994. The Paradoxical Success of Fuzzy Logic. IEEE Expert: Intelligent Systems and Their Applications, 9(4):3-8.