www.ann-geophys.net/26/2449/2008/ © European Geosciences Union 2008
Annales
Geophysicae
Momentum transfer at the high-latitude magnetopause and
boundary layers
E. J. Lund1, C. J. Farrugia1, and P. E. Sandholt2
1Space Science Center, University of New Hampshire, Durham, New Hampshire, USA 2Department of Physics, University of Oslo, Oslo, Norway
Received: 7 April 2008 – Revised: 10 June 2008 – Accepted: 27 June 2008 – Published: 13 August 2008
Abstract. How and where momentum is transferred from the solar wind to the magnetosphere and ionosphere is one of the key problems of space physics. Much of this transfer oc-curs through direct reconnection on the dayside, particularly when the IMF is southward. However, momentum transfer also occurs at higher latitudes via Alfv´en waves on old open field lines, even for southward IMF. This momentum is trans-ferred to the ionosphere via field-aligned currents (FACs), and the flow channel associated with these FACs produces a Hall current which causes magnetic variations at high lat-itude (the Svalgaard-Mansurov effect). We show examples where such momentum transfer is observed with multiple spacecraft and ground-based instruments.
Keywords. Magnetospheric physics (Current systems; Magnetopause, cusp, and boundary layers; Magnetosphere-ionosphere interactions)
1 Introduction
Large-scale field-aligned currents (FACs) transmit stresses originating at the magnetopause and its boundary layers throughout the magnetosphere-ionosphere system. Their ex-istence was established a long time ago from the magnetic deflections registered by polar-orbiting spacecraft (Zmuda et al., 1966; Armstrong and Zmuda, 1973). That FACs are a quasi-permanent feature of the magnetosphere was de-termined from the extensive statistics using measurements made by the Triad spacecraft by Iijima and Potemra (1976) and are subject to variations in intensity related to the IMF direction (see Cowley, 2000, for a review). These are called Region 1 (higher latitude) and 2 currents (R1 and R2) and they form two rings of currents next to each other.
Correspondence to: E. J. Lund (eric.lund@unh.edu)
Using 47 passes of the Dynamics Explorer spacecraft, Taguchi et al. (1993) established conclusively the presence of a separate pair of FACs – the cusp/cleft currents – lying pole-ward of the R1 and R2 currents. Their position and direction (into or out of the ionosphere) is governed by the polarity of the IMF east-west component,By. Thus, for IMFBy>0 (By<0), they lie on the prenoon (postnoon) side and are such that the current in the higher latitude component, which we call hereinafter C1, flows out of (into) the ionosphere, and that in the lower-latitude component C2 flows into (out of) the ionosphere. Thus in both cases the current in C2 flows in the same direction as that in R1 and the current in C1 flows in the same direction as that in R2. These cusp currents had been predicted on theoretical grounds (Lee et al., 1985) based on considerations of reconnection at a magnetopause when it is a rotational discontinuity. Taguchi et al. (1993) postulated steady reconnection as origin for these currents.
Fig. 1. Interplanetary conditions as observed by Wind on 3 De-cember 1997. The UT reflects the estimated 70-min lag from Wind to the magnetopause. Top to bottom: Solar wind density, velocity, temperature, and dynamic pressure; total interplanetary magnetic
field, its GSM components, clock angle (azimuth inY ZGSMplane),
and cone angle (angle fromXGSMdirection).
Mansurov, 1969). Our observations extend the interpreta-tion of Taguchi et al. (1993) in that they focus on tempo-ral variability in these currents and thus relate them to tran-sient, rather than steady, reconnection. Specifically, these events have been linked to flux transfer events (FTEs; Russell and Elphic, 1978), and they agree with other observations of FTEs at high latitudes (Thompson et al., 2004). The observa-tions cover cases with both signs ofBy, and the pattern has been consistent: the C1/C2 currents and flow channels oc-cur prenoon (postnoon) for positive (negative)By (all these observations are from the Northern Hemisphere).
[image:2.595.310.545.66.291.2]In this paper we will focus on two examples of this phe-nomenon: 3 December 1997 and 21 January 2001. In pre-senting these examples, we follow a long tradition in the field of solar wind-magnetosphere-ionosphere coupling which has been overlooked in recent years, namely, momentum cou-pling via the dynamo region in the HBL (Cowley, 1981; Stern, 1984; Siscoe et al., 1991, 2000; Taguchi et al., 1993).
Fig. 2. Map showing the trajectory of Polar’s magnetic
foot-point relative to observatories around Svalbard. Also shown is
the approximate region where cusp aurora was observed from Ny ˚
Alesund.
We present the data in the next two sections, discuss our in-terpretation of the data in Sect. 4, and give our concluding remarks in Sect. 5.
2 3 December 1997
The interplanetary conditions observed by Wind (Lepping et al., 1995; Ogilvie et al., 1995) during this event, which was first examined by Farrugia et al. (2003), are shown in Fig. 1. The UTs in the figure have been modified to take into ac-count the estimated 70-min propagation delay between Wind and the magnetopause. The labels I–IV in the figure indi-cate times when, as will be shown below, the Polar spacecraft passed through various large-scale FACs. The IMFBzturned southward at the start of interval I, turned northward again at a field and flow discontinuity during interval II, was slightly negative during interval III, and became increasingly nega-tive during interval IV. Note that IMF conditions were similar during intervals I and IV. Apart from a brief excursion to near zero at about 05:00 UT (during interval II),By was positive during this period, and for most of this timeBy>|Bz|.
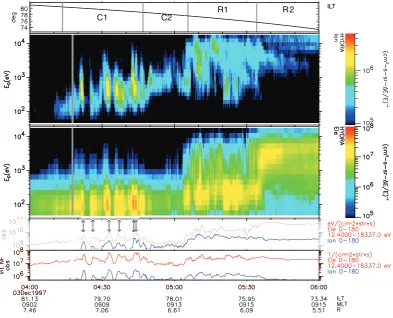
Fig. 3. Data from the Polar spacecraft pass through the region of cusp aurora. Top to bottom: invariant latitude; ion and electron energy spectrograms; integrated energy and number fluxes for electrons (red) and ions (blue).
auroral activity located poleward of Ny ˚Alesund. Although optical data are not available before 05:15 UT, meridian scan-ning photometer and all-sky camera data taken during the in-terval marked IV in Fig. 1 show a series of quasi-periodic auroral intensifications at intervals of 7–8 min to the north of Ny ˚Alesund, in the same latitude range that Polar traversed during interval I. Since intervals I and IV were under sim-ilar IMF conditions, it is reasonable to assume that simsim-ilar auroral activity was occurring at these latitudes during inter-val I. The large-scale FACs encountered by Polar are marked along its trajectory. The identifications are based on the mea-sured deflections and fluctuations of the magnetic field (see Farrugia et al., 2003, Fig. 3).
Polar particle data (HYDRA; Scudder et al., 1995) for the interval 04:00–06:00 UT are shown in Fig. 3. The large-scale FAC identifications are marked in the top panel. Several bursts of low energy particles (∼300 eV ions and∼100 eV electrons) are visible in the time period corresponding to in-terval I of Fig. 1. These signatures are consistent with FTEs originating at a reconnection line tilted with respect to the geomagnetic equator, as appropriate for a significant IMF By. As will be explained below, we infer the existence of an upward FAC in this region. Comparison with later
inter-vals leads us to identify this region as the C1 current. As Polar moved equatorward into a region of downward FAC which we identify as the C2 current, these temporally varying structures ceased; however, since the IMFBzturned positive around this time we cannot determine whether the change is due to the change in current or the change in IMF. We dis-tinguish C2 from R1, which has the same sign, by (1) the convection reversal separating them and (2) the appearance of plasma sheet particles in the R1 current. The directions of the four current sheets agree with the results of Taguchi et al. (1993).
Polar/MFE/HYDRA December 3, 1997 (GSM)
4.17 4.33 4.50 4.67 4.83
4 12 20
Bx (nT)
4.17 4.33 4.50 4.67 4.83 0
4 8 12
By (nT)
4.17 4.33 4.50 4.67 4.83
-4 0 4
Bz (nT)
4.17 4.33 4.50UT 4.67 4.831 3 5
B-B
model
(nT)
4.17 4.33 4.50UT 4.67 4.83
0 1 2
Np (c
m
-3)
4.17 4.33 4.50UT 4.67 4.83 0
50 100
V (km
s
-1)
4.17 4.33 4.50UT 4.67 4.83
0.0 0.5 1.0
Tp (keV)
4.17 4.33 4.50UT 4.67 4.83-50 0 50
Vx (km/s)
4.17 4.33 4.50UT 4.67 4.83
-50 0 50
Vy (km/s)
4.17 4.33 4.50UT 4.67 4.83-50 0 50
Vz (km/s)
4:10 20 30 40 50
[image:4.595.310.546.61.275.2]UT
Fig. 4. Expanded view of Polar magnetic field and plasma moments from the interval marked I in Fig. 1. Top to bottom: Magnetic field components; magnetic field magnitude (IGRF model subtracted); proton density, bulk speed, temperature, and velocity components. Vertical dash-dot lines indicate flow bursts which are consistent with FTE signatures.
∼79◦ magnetic latitude, MLAT) occurred at a time when a series of poleward propagating magnetic impulse events (MIEs) was observed in the same MLT sector by the IMAGE Svalbard magnetometer chain (71–76◦). The poleward prop-agation of the IMAGE disturbances (MIEs) corresponds to the poleward propagation of the convection channel and Hall current associated with ionospheric current closure of FACs in newly-reconnected flux tubes as envisaged, for example, by Southwood (1987). The ions in these flow bursts are of typical magnetosheath energies (a few hundred eV) and were accompanied by field-aligned electrons (not shown). The positivevz background flow on which these flow bursts are superimposed is characteristic of mirroring ions in the mantle (Rosenbauer et al., 1975), while the flow bursts themselves have negativevz, consistent with injections at high latitude on old open field lines (reconnected in the past) in the man-tle. The temperature and density profiles suggest two compo-nents with different injection latitudes: a warmer, less dense component injected behind the cusp, followed by a cooler,
90
80
70
70
15
09
80
0750 0840
PMAFs/prenoon PMAFs/postnoon
MABS
0920
12
(
)
3 Dec. 97 ( By > O )
0540 Polar
C2 C1
diffuse aurora
Plasma flow Auroral motion
R1 R2
Fig. 5. Schematic of the Polar footpoint track in the context of au-rora and plasma convection in MLT/MLAT coordinates during the interval 05:40–09:30 UT on 3 December 1997. Approximate fields of view (assuming a typical 250 km altitude for the 630.0 nm
emis-sions) of the MSP at Ny ˚Alesund are indicated by double-arrowed
meridional lines for the times 05:40 UT, 07:50 UT, and 09:20 UT; circles mark the all sky camera fields of view for the same times. Auroral motions are indicated by arrows attached to the respective forms. Plasma convection streamlines are marked red. The shaded sector marks the plasma convection channel associated with the C1-C2 field-aligned currents.
denser component injected closer to the central cusp (Smith, 1994). Thus the flow bursts have some of the characteris-tics of flux transfer events (FTEs) (Russell and Elphic, 1978). These observations suggest that time variations in the recon-nection rate may be important in the C1 current region.
[image:4.595.51.283.62.368.2]SOHO/CELIAS-ACE/MAG January 21, 2001 (GSM)
13 14 15 16 17
0 5 10 15 20
n (cm
-3
)
13 14 15 16 17
300 320 340
v (km/s)
13 14 15 16 17
0 2•104 4•104
T (K)
13 14 15 16 17
0 1 2 3 4
P
D(nPa)
13 14 15 16 17
5 10 15
B (nT)
13 14 15 16 17-10
0 10
Bx (nT)
13 14 15 16 17
-15 -5 5
By (nT)
1 3 1 4 1 5U T 1 6 1 7-20
-10 0
Bz (nT)
13 14 15 16 17
UT
180120 60
Clock Ang (°)
[image:5.595.54.281.59.333.2]0
Fig. 6. Solar wind from SOHO/CELIAS and IMF from ACE on 21 January 2001. The time refers to the ACE spacecraft and does not include a delay of 75 min (confirmed by observations as discussed in the text). Top to bottom: Solar wind density, velocity, temperature, and dynamic pressure; total magnetic field, its GSM components, and clock angle.
were in the shaded region near 80◦MLAT; they occur only in the prenoon sector. The region marked MABS in the fig-ure is an MLT band near local noon with attenuated emission intensity.
3 21 January 2001
During the second event, which was first examined by Far-rugia et al. (2004a), the IMF was much more steady with By<0,Bz<0, andBy∼Bz, as can be seen in the interplan-etary data shown in Fig. 6. This is the oppositeBy polarity to the first event. Here the time shown is at ACE, where the magnetometer measurements (Smith et al., 1998) were made. We show plasma data from SOHO/CELIAS (Hovestadt et al., 1995), shifted to ACE times, because the corresponding ACE plasma data are considered unreliable during this inter-val. Estimated lag time from ACE to the magnetopause is 75 min; we can confirm this timing thanks to the abrupt drop in solar wind density, and therefore dynamic pressure, at the time (∼14:28 UT) marked with the vertical dashed line.
Figure 7 shows the footpoints (magnetically mapped to 100 km via the Tsyganenko, 1989, model) of the Cluster
T89 Kp=3 21 Jan 2001
15:45
15:30
15:35
15:40
15:50 15 16
1413 12 11 10 9 8
7
• Sondrestrom
Fig. 7. Ionospheric footpoints of FAST (red) and Cluster (blue) relative to Søndrestrøm.
(blue) and FAST (red) spacecraft. A magnetic conjunction occurs where the trajectories cross at about 15:45 UT, which is near the time when the dynamic pressure drop arrives at the magnetopause. The conjunction maps to near the location of the Søndrestrøm radar (green dot). At the time of con-junction Søndrestrøm was at about 13:00 MLT at the open-closed field line boundary (Farrugia et al., 2004a). The radar at Søndrestrøm observed a transient flow channel around the time of conjunction, with strong∼2 km/s antisunward flow just poleward of the convection reversal (see Farrugia et al., 2004a, Fig. 13). Since the IMFByis negative here, in con-trast to the 3 December 1997 event, the C1/C2 currents and associated flow channels should be postnoon, which is where the observations took place.
[image:5.595.312.542.62.320.2]2001 January 21 FAST Orbit 17543
10 100 1000 10000 ( eV)104 108 eV
___________ cm
2 s
s r e V -900 90 180 270 e- P. A. 105 108 10 100 1000 10000
Ions (eV) 104
107 eV ___________ -900 90 180 270
Ion P.A. 104
107 15:42 12.7 1104.1 82.2 15:44 12.9 947.7 75.5 15:46 13.0 803.4 68.5 15:48 13.1 674.4 61.3 UT MLT ALT ILAT cm
2 s
s
r
e
[image:6.595.50.287.61.271.2]V
Fig. 8. Spectrograms of particle data from the FAST spacecraft as it passes through the cusp. Top to bottom: electron energy, electron pitch angle, ion energy, and ion pitch angle.
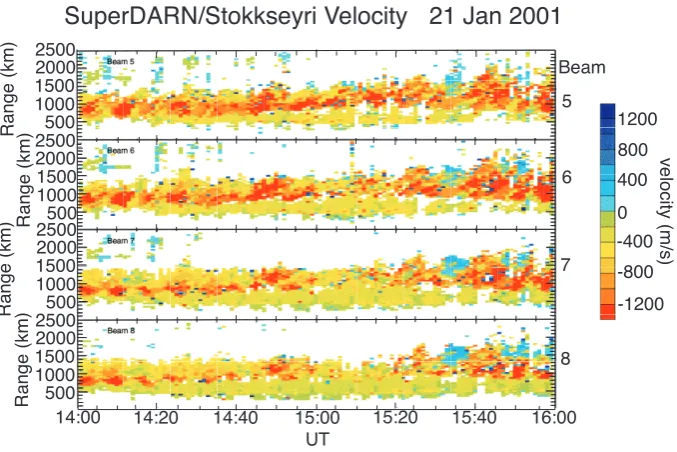
Among the signatures of time-varying reconnection we see is repeated poleward moving flow bursts in beams 5–7 of the Stokkseyri SuperDARN radar (Fig. 9), which looks to-ward Greenland. The earliest such flows begin around 14:40, but they become particularly intense at about 15:35. Previ-ously reported observations have demonstrated an associa-tion between these poleward moving radar auroral forms and FTEs (Wild et al., 2001, and references therein).
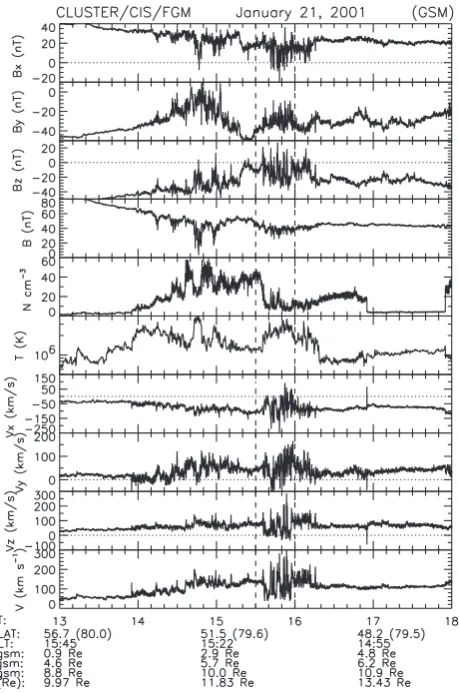
Figure 10 shows an overview of the data from Cluster 1 from 13:00 to 18:00. Cluster made several excursions into the cusp between 14:00 and 15:00, as can be seen from the diamagnetic features in|B|. Once the dynamic pressure de-crease hit the magnetopause around 15:35 (as can be seen from the sudden density drop at Cluster), Cluster entered a highly dynamic region with large amplitude fluctuations in bothBand the ion flow velocityv, the latter reaching a sub-stantial fraction of the solar wind speed (320 km s−1). At this time Cluster was poleward of the cusp: the background field hadBx>0 andBz<0.
To see these fluctuations better, we expand the interval be-tween the vertical dashed lines in Fig. 11. At this scale it is clear that the fluctuations inBandvare correlated, com-ponent by comcom-ponent. Eight examples of these flow bursts, which are consistent with FTEs, are shown in the figure, the first coinciding with the arrival of the dynamic pressure de-crease at the magnetopause. Each component ofBandv sep-arately satisfies the Wal´en relation (Sonnerup et al., 1981), demonstrating that these flow bursts are Alfv´enic. Finally, in the bottom panel of Fig. 11 we show the east-west magnetic field (IGRF subtracted) as observed by FAST during the in-terval 15:43–15:46. From the FAST magnetometer data we
infer the existence of two FAC systems: the C1/C2 system in which the flow bursts are embedded, and the R1/R2 system located equatorward of the C1/C2 system, with R1 and C2 having the same sign. The C1 current flows into the iono-sphere, as indicated by the sign of the magnetic deflection. During its traversal of C1, FAST observed mantle precipita-tion, as expected for the location of Cluster 1 (Rosenbauer et al., 1975); thus these flux tubes have been opened at some point in the past, i.e. they are old open flux tubes. We in-fer that the FAC due to these FTEs is driving the intermit-tent flows we observe in the radar data, and therefore infer that the high-latitude boundary layer (HBL) acts as a dynamo (j·E<0). This mode of momentum transfer from magneto-sphere to ionomagneto-sphere is not due to thej×Bforce.
4 Discussion
The two events we have shown here, as well as several other case studies (Provan et al., 2002; Sandholt et al., 2004, 2006; Sandholt and Farrugia, 2007a), build evidence for the proposition that momentum transfer from the solar wind to the ionosphere is not restricted to newly reconnected flux tubes, but also continues on previously reconnected flux tubes downstream of the cusp. Field line stresses and FTEs give rise to an FAC system, whose location relative to noon depends on the IMFBy, poleward of the auroral Birkeland currents (Taguchi et al., 1993). These FACs couple to a flow channel poleward of the convection reversal boundary. The-oretical models of ionospheric convection under strongBy have hitherto not taken into account this flow channel and its associated electrodynamics. This flow channel cannot have been driven by thej×B force on newly opened field lines; instead it is connected to the boundary layer dynamo region threaded by old open field lines tailward of the cusp. Any model of solar wind-magnetosphere-ionosphere momentum transfer which depends exclusively on the j×B force on newly opened field lines is therefore incomplete.
Our work confirms and extends the work of Thompson et al. (2004), who noted a specific magnetic field signature in Cluster data, namely a reversal inBz, when Cluster was downstream of the cusp. They suggested that theseBz re-versals, which result from currents transverse to the field, are signatures of high-latitude FTEs. The confined current sys-tem they propose is likely to connect with sys-temporally varying C1/C2 currents such as we have discussed here.
Range (km) 500 1000
15002000
2500
Range (km) 500 1000 1500 2000 2500 Range (km) 500 1000 1500 2000 2500 Range (km) 500 1000
15002000
2500
14:00 14:20
SuperDARN/Stokkseyri Velocity 21 Jan 2001
14:40 15:00
UT
15:20 15:40 16:00
1200
800
400
0 -400
-800
-1200
velocity (m/s)
Beam
5
6
7
[image:7.595.129.468.61.287.2]8
Fig. 9. Line-of-sight velocities measured in several beams of the Stokkseyri SuperDARN radar which point in the general direction of Søndrestrøm.
These observations hold important implications for ex-tending the explanation of the Svalgaard-Mansurov effect (Svalgaard, 1968; Mansurov, 1969). The canonical expla-nation is that the asymmetric Maxwell stress force due toBy induces asymmetries in the ionospheric flow pattern on the dayside. However, it is well known (e.g. Weimer, 2001) that the asymmetry persists at least as far tailward as the termi-nator. A single Alfv´en wave cannot account for the rotation of the magnetic field from the magnetosheath orientation to the orientation found both equatorward and poleward of the cusp, as the latter two orientations are quite different. It has long been hypothesized that a distinct Alfv´en wave forms on the downstream side of the cusp (Vasyli¯unas, 1995), and our observations provide support for this scenario.
The additional asymmetry due to the C1/C2 FAC sys-tem may also account for differences in the propagation of prenoon and postnoon PMAFs (Sandholt and Farrugia, 2007a). These authors found that while prenoon PMAFs have a three-phase development pattern over a wide latitude range, postnoon PMAFs fade after an initial intensification and the third phase of development is not observed. Thus the dawn-dusk asymmetry of PMAFs, which manifests itself as specific high-latitude phase which is found only prenoon for By>0 conditions, is closely related to the convection asym-metry resulting from the additional convection channel in the same sector (Sandholt and Farrugia, 2007b).
The flow channels we report here are distinct from the re-versed flow events (RFEs) which have recently been reported in radar observations from Svalbard (Oksavik et al., 2004; Rinne et al., 2007). There are several similarities between our
events and RFEs, among them associations with FTEs and PMAFs and the presence of a transient flow channel. How-ever, unlike our flow channels, the RFEs seem to have no correlation between MLT of occurrence and the sign of the IMFBy, nor are they limited to periods withBz<0. RFEs appear to be a manifestation of momentum transfer on newly reconnected field lines, whereas the events we describe here show that momentum transfer occurs on old open field lines. To summarize, our contribution to the major theme of the paper, namely momentum coupling via the dynamo region in the high-latitude boundary layer (see Introduction) is as follows. Using coordinated satellite-ground observations, we documented the following elements of M-I coupling along old open field lines:
– In satellite data, we showed the presence of a specific FAC system (the C1-C2 currents) poleward of the R1 current in the prenoon (postnoon) sector for IMF By positive (negative) conditions. This is identified as the HCC-LCC FACs of Taguchi et al. (1993). These cur-rents were associated with (a) “stepped (staircase) cusp” ion precipitation: the mantle precipitation regime (Polar observations at low altitudes: 2RE, discussed in Farru-gia et al., 2004b); and (b) FTE-type, repetitive plasma injections in the C1 current regime (Polar observations at mid-magnetospheric altitudes: 7RE).
– In ground-based data, we showed
Fig. 10. Data from the Cluster traversal through the cusp. Top to bottom: Magnetic field components and magnitude; ion density, temperature, velocity components, and magnitude. The interval be-tween vertical dashed lines is expanded in Fig. 10.
IMFBy positive (negative) conditions. This flow channel is theE×Bdrift associated with the Ped-ersen current closure of the C1-C2 FACs.
2. Relationship with poleward propagating “magnetic impulse events” appearing at lower latitudes (newly open field lines) and ending at latitudes threaded by old open field lines and mantle precipitation. The latter component is due to the Hall current associ-ated with the above mentioned flow channel sand-wiched between the C1/C2 currents. This ground magnetic deflection contributes to the Svalgaard-Mansurov effect.
3. Relationship with the aurora in the form of the highest-latitude stage of poleward mov-ing auroral forms (PMAFs) appearmov-ing in the prenoon (PMAFs/prenoon/By>0) and postnoon (PMAFs/postnoon/By<0) sectors.
Fig. 11. Top: Expanded view of Cluster data showing density and components and magnitude of ion velocity and magnetic field. Eight flow bursts are marked in the figure. Bottom: Cross-track magnetic field (IGRF model subtracted) observed at FAST. The flow bursts are embedded in the FAC pair labeled C1/C2 in the bot-tom panel.
5 Conclusions
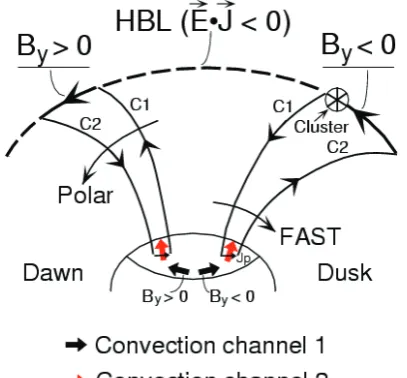
[image:8.595.311.542.62.375.2]Fig. 12. Schematic of the IMFBy-dependent FAC system located poleward of the R1 current. The red arrow marks plasma convection channels associated with the closure of the C1/C2 current system. Locations of Polar during the first example and Cluster and FAST during the second example are indicated.
flow channels, in turn, are coupled to PMAFs observed in the dayside high-latitude region (Farrugia et al., 2003; Oksavik et al., 2004). By this mechanism, momentum transfer into the high-latitude ionosphere is maintained at levels significant to the dynamics of this region.
Acknowledgements. Work at the University of New Hampshire was
supported by the National Aeronautics and Space Administration under grant numbers NNG05GG25G and NNX08AD11G.
Topical Editor R. Nakamura thanks three anonymous referees for their help in evaluating this paper.
References
Armstrong, J. C. and Zmuda, A. J.: Triaxial magnetic measure-ments of field-aligned currents at 800 km in the auroral region: Initial results, J. Geophys. Res., 78, 6802–6807, 1973.
Cowley, S. W. H.: Magnetospheric asymmetries associated with the
Y-component of the IMF, Planet. Space Sci., 29, 79–86, 1981.
Cowley, S. W. H.: Magnetosphere-Ionosphere interactions: A tu-torial review, in: Magnetospheric Current Systems, edited by: Ohtani, S.-I., Fujii, R., Hesse, M., and Lysak, R. L., Geophys. Monogr. Ser., vol. 118, American Geophysical Union, Washing-ton, p. 91, 2000.
Farrugia, C. J., Sandholt, P. E., Denig, W. F., and Torbert, R. B.: Observations of a correspondence between poleward-moving au-roral forms and stepped-cusp ion precipitation, J. Geophys. Res., 103, 9309–9315, 1998.
Farrugia, C. J., Sandholt, P. E., Maynard, N. C., Torbert, R. B., and Ober, D. M.: Temporal variations in a four-sheet field-aligned current system and associated aurorae as observed during
a Polar-ground magnetic conjunction in the midmorning sector, J. Geophys. Res., 108(A6), 1230, doi:10.1029/2002JA009619, 2003.
Farrugia, C. J., Lund, E. J., Sandholt, P. E., Wild, J. A., Cowley, S. W. H., Balogh, A., Mouikis, C., M¨obius, E., Dunlop, M. W., Bosqued, J. M., Carlson, C. W., Parks, G. K., Cerisier, J.-C., Kelly, J. D., Sauvaud, J.-A., and R`eme, H.: Pulsed flows at the high-altitude cusp poleward boundary, and associated iono-spheric convection and particle signatures, during a Cluster-FAST-SuperDARN-Sondrestrom conjunction under a southwest IMF, Ann. Geophys., 22, 2891–2905, 2004a,
http://www.ann-geophys.net/22/2891/2004/.
Farrugia, C. J., Sandholt, P. E., Torbert, R. B., and Østgaard, N.: Temporal and spatial aspects of the cusp inferred from local and global ground- and space-based observations in a case study, J. Geophys. Res., 109, A04209, doi:10.1029/2003JA010121, 2004b.
Hovestadt, D., Hilchenbach, M., B¨urgi, A., et al.: CELIAS – Charge, element, and isotope analysis system for SOHO, Solar Phys., 162, 441–481, 1995.
Iijima, T., and Potemra, T. A.: Field-aligned currents in the dayside cusp observed by Triad, J. Geophys. Res., 81, 5971–5979, 1976. Lee, L., Kan, J. R., and Akasofu, S.-I.: On the origin of cusp field
aligned currents, J. Geophys., 57, 217–221, 1985.
Lepping, R. P., Acu˜na, M. H., Burlaga, L. F., et al.: The Wind Mag-netic Field Investigation, Space Sci. Rev., 71, 207–229, 1995. Lockwood, M. and Smith, M. F.: The variation of reconnection rate
at the dayside magnetopause and cusp ion precipitation, J. Geo-phys. Res., 97, 14 841–14 847, 1992.
Mansurov, S. M.: New evidence of a relationship between magnetic fields in space and on Earth, Geomagn. Aeron. USSR, 9, 622– 623, 1969.
Ogilvie, K. W., Chornay, D. J., Fitzenreiter, R. J., et al.: SWE, a comprehensive plasma instrument for the Wind spacecraft, Space Sci. Rev., 71, 55–77, 1995.
Øieroset, M., Sandholt, P. E., L¨uhr, H., Denig, W. F., and Moret-to, T.: Auroral and geomagnetic events at cusp/mantle latitudes in the prenoon sector during positive IMF By conditions: Sig-natures of pulsed magnetopause reconnection, J. Geophys. Res., 102, 7191–7206, 1997.
Oksavik, K., Moen, J., and Carlson, H. C.: High-resolution obser-vations of the small-scale flow pattern associated with a pole-ward moving auroral form in the cusp, Geophys. Res. Lett., 31, L11807, doi:10.1029/2004GL019838, 2004.
Provan, G., Milan, S. E., Lester, M., Yeoman, T. K., and Khan, H.: Simultaneous observations of the ionospheric footprint of flux transfer events and dispersed ion signatures, Ann. Geophys., 20, 281–287, 2002,
http://www.ann-geophys.net/20/281/2002/.
Rinne, Y., Moen, J., Oksavik, K., and Carlson, H. C.: Reversed flow events in the winter cusp ionosphere observed by the European Incoherent Scatter (EISCAT) Svalbard radar, J. Geophys. Res., 112, A10313, doi:10.1029/2007JA012366, 2007.
Rosenbauer, H., Gr¨unwaldt, H., Montgomery, M. D., Pasch-mann, G., and Sckopke, N.: HEOS 2 plasma observations in the distant polar magnetosphere: The plasma mantle, J. Geophys. Res., 80, 2723–2737, 1975.
Russell, C. T., Snare, R. C., Means, J. D., Pierce, D., Dearborn, D., Larson, M., Barr, G., and Le, G.: The GGS/Polar magnetic field investigation, Space Sci. Rev., 71, 563–582, 1995. Sandholt, P. E. and Farrugia, C. J.: Role of poleward moving
auroral forms in the dawn-dusk auroral precipitation
asymme-tries induced by IMF By, J. Geophys. Res., 112, A04203,
doi:10.1029/2006JA011952, 2007a.
Sandholt, P. E. and Farrugia, C. J.: Poleward moving auroral forms (PMAFs) revisited: Responses of aurora, plasma convection and Birkeland currents in the pre- and postnoon sectors under
posi-tive and negaposi-tive IMFByconditions, Ann. Geophys., 25, 1629–
1652, 2007b,
http://www.ann-geophys.net/25/1629/2007/.
Sandholt, P. E., Farrugia, C. J., and Denig, W. F.: Detailed day-side auroral morphology as a function of local time for south-east IMF orientation: Implications for solar wind-magnetosphere coupling, Ann. Geophys., 22, 3537–3560, 2004,
http://www.ann-geophys.net/22/3537/2004/.
Sandholt, P. E., Farrugia, C. J., Lund, E. J., and Denig, W. F.:
IMFByand the spatio-temporal structure of the dayside aurora,
in: Recurrent Magnetic Storms: Corotating Solar Wind Streams, edited by: Tsurutani, B., McPherron, R., Gonzalez, W., Lu, G., Sobral, J. H. A., and Gopalswamy, N., Geophysical Monograph 167, AGU, Washington, p. 213, 2006.
Scudder, J. D., Hunsacker, F., Miller, G., et al.: Hydra – a 3-dimensional electron and ion hot plasma instrument for the Polar spacecraft, Space Sci. Rev., 71, 459–495, 1995.
Siscoe, G. L., Lotko, W., and Sonnerup, B. U. ¨O.: A high-latitude,
low-latitude boundary layer model of the convection current sys-tem, J. Geophys. Res., 96, 3487–3495, 1991.
Siscoe, G. L., Erickson, G. M., Sonnerup, B. U. ¨O., Maynard, N. C.,
Siebert, K. D., Weimer, D. R., and White, W. W.: Deflected mag-netosheath flow at the high-latitude magnetopause, J. Geophys. Res., 105, 12 851–12 858, 2000.
Smith, C. W., L’Heureux, J., Ness, N. F., Acu˜na, M. H., Burlaga, L. F., and Scheifele, J.: The ACE Magnetic Fields Experiment, Space Sci. Rev., 86, 613–632, 1998.
Smith, M. F.: Transient dayside reconnection and its effect on the ionosphere, in: Physical Signatures of Magnetospheric Bound-ary Layer Processes, NATO ASI Series, vol. 425, edited by: Holtet, J. A. and Egeland, A., Kluwer, Dordrecht, p. 275, 1994.
Sonnerup, B. U. ¨O., Paschmann, G., Papamastoriakis, I.,
Sckop-ke, N., Haerendel, G., Bame, S. J., Asbridge, J. R., Gosling, J. T., and Russell, C. T.: Evidence for reconnection at the earth’s mag-netopause, J. Geophys. Res., 86, 10 049–10 067, 1981.
Southwood, D. J.: The ionopsheric signatures of flux transfer events, J. Geophys. Res., 92, 3207–3213, 1987.
Stern, D.: Magnetospheric dynamo processes, in: Magnetospheric Currents, Geophys. Monogr. Ser., vol. 28, edited by: Potemra, T., p. 200, AGU, Washington, D.C., 1984.
Svalgaard, L.: Sector structure of the interplanetary magnetic field and daily variations of the geomagnetic field at high latitudes, Geophys. Pap. R-6, Dan. Meteorol. Inst., Charlottenlund, Den-mark, 1968.
Taguchi, S., Sugiura, M., Winningham, J. D., and Slavin, J. A.:
Characterization of the IMFBy-dependent field-aligned currents
in the cleft region based on DE 2 observations, J. Geophys. Res., 98, 1393–1407, 1993.
Thompson, S. M., Kivelson, M. G.. Khurana, K. K.. Balogh, A., R`eme, H., Fazakerley, A. N., and Kistler, L. M.: Cluster observa-tions of quasi-periodic impulsive signatures in the dayside north-ern lobe: High-latitude flux transfer events, J. Geophys. Res., 109, A02213, doi:10.1029/2003JA010138, 2004.
Trattner, K. J., Fuselier, S. A., Peterson, W. K., Sauvaud, J.-A., Ste-nuit, H., Doubuloz, N., and Kovrazhkin, R. A.: On spatial and temporal structures in the cusp, J. Geophys. Res., 104, 28 411– 28 421, 1999.
Tsyganenko, N. A.: A magnetospheric magnetic field model with a warped tail plasma sheet, Planet. Space Sci., 37, 5–20, 1989. Vasyli¯unas, V. M.: Multiple-branch model of the open
magne-topause, Geophys. Res. Lett., 22, 1145–1147, 1995.
Weimer, D. R.: Maps of ionospheric field-aligned currents as a function of the interplanetary magnetic field derived from Dy-namics Explorer 2 data, J. Geophys. Res., 106, 12 889–12 902, 2001.
Wild, J. A., Cowley, S. W. H., Davies, J. A., Khan, H., Milan, S. E., Provan, G., Yeoman, T. K., Balogh, A., Dunlop, M. W., Fornac¸on, K.-H., and Georgescu, E.: First simultaneous obser-vations of flux transfer events at the high-latitude magnetopause by the Cluster spacecraft and pulsed radar signatures in the con-jugate ionosphere by the CUTLASS and EISCAT radars, Ann. Geophys., 19, 1491–1508, 2001,
http://www.ann-geophys.net/19/1491/2001/.