doi:10.5194/bg-8-189-2011
© Author(s) 2011. CC Attribution 3.0 License.
Remote sensing of ecosystem light use efficiency with MODIS-based
PRI
A. Goerner1, M. Reichstein1, E. Tomelleri1, N. Hanan2, S. Rambal3, D. Papale4, D. Dragoni5, and C. Schmullius6
1Max Planck Institute for Biogeochemistry, 07745 Jena, Germany
2Natural Resources Ecology Lab, Colorado State University, Fort Collins, USA 3CEFE-CNRS, 34293 Montpellier cedex 5, France
4Department of Forest Science and Environment, University of Tuscia, 01100 Viterbo, Italy 5Department of Geography, Indiana University, Bloomington, Indiana, USA
6Friedrich-Schiller-University Jena, 07743 Jena, Germany
Received: 20 August 2010 – Published in Biogeosciences Discuss.: 14 September 2010 Revised: 11 January 2011 – Accepted: 11 January 2011 – Published: 26 January 2011
Abstract. Several studies sustained the possibility that
a photochemical reflectance index (PRI) directly obtained from satellite data can be used as a proxy for ecosystem light use efficiency (LUE) in diagnostic models of gross primary productivity. This modelling approach would avoid the com-plications that are involved in using meteorological data as constraints for a fixed maximum LUE. However, no unifying model predicting LUE across climate zones and time based on MODIS PRI has been published to date. In this study, we evaluate the effectiveness with which MODIS-based PRI can be used to estimate ecosystem light use efficiency at study sites of different plant functional types and vegetation densi-ties. Our objective is to examine if known limitations such as dependence on viewing and illumination geometry can be overcome and a single PRI-based model of LUE (i.e. based on the same reference band) can be applied under a wide range of conditions. Furthermore, we were interested in the effect of using different faPAR (fraction of absorbed photo-synthetically active radiation) products on the in-situ LUE used as ground truth and thus on the whole evaluation exer-cise. We found that estimating LUE at site-level based on PRI reduces uncertainty compared to the approaches rely-ing on a maximum LUE reduced by minimum temperature and vapour pressure deficit. Despite the advantages of us-ing PRI to estimate LUE at site-level, we could not establish an universally applicable light use efficiency model based on MODIS PRI. Models that were optimised for a pool of data from several sites did not perform well.
Correspondence to: A. Goerner
(anna.goerner@bgc-jena.mpg.de)
1 Introduction
Sound estimates of gross primary productivity (GPP) are es-sential for an accurate quantification of the global carbon cy-cle and an understanding of its variability (Schulze, 2006). Many diagnostic models of primary productivity are based on a light use efficiency approach (Running et al., 2000; Yuan et al., 2007; Beer et al., 2010, e.g.).
All light use efficiency models represent photosynthetic assimilation of vegetation as a function of the amount of pho-tosynthetically active radiation absorbed by plants (aPAR) (Monteith, 1972; Running et al., 2000). In these models, all environmental and biophysical constraints on the conversion of photo energy to plant biomass are aggregated in the term light use efficiency (LUE). GPP is thus calculated as:
GPP=LUE×aPAR (1)
aPAR=faPAR×PAR (2)
where faPAR is the fraction of absorbed photosynthetically active radiation. The simplicity of this approach, with lit-tle need for ancillary data, makes it possible to base these models on remote sensing products and meteorological fields (Hilker et al., 2008c; McCallum et al., 2009). Thus, an im-portant prerequisite for application on the global scale is ful-filled.
It should be noted, although the definition of aPAR is clear, faPAR and incident PAR derived from different sources and can differ substantially (e.g. McCallum et al., 2010).
plant nutrition. LUE is usually modelled by constraining a certain maximum LUE according to a set of environmental conditions (e.g. Running et al., 2000; Yuan et al., 2007; Horn and Schulz, 2010). The determinants of LUE and on which time-scales they act are only partially resolved. Among the main difficulties on the daily to annual time-scales are finding a suitable surrogate for ecosystem water limitation (Garbul-sky et al., 2010a) and the accuracy of the available meteoro-logical data (Heinsch et al., 2006).
It is thus attractive to derive LUE directly from just one kind of satellite data, without relying on estimates of differ-ent meteorological variables. Two types of remotely sensed data are candidates for this: fluorescence and the photochem-ical reflectance index (PRI).
While studies using airborne fluorescence measurements had promising results, the signal-to-noise ratio needs to be improved to be useful for satellite-based observations; efforts are ongoing (Meroni et al., 2009). The PRI combines re-flectance at 531 nm (ρ531) with a reference wavelength
insen-sitive to short-term changes in light energy conversion effi-ciency (ρref) and normalises it (Gamon et al., 1992; Pe˜nuelas
et al., 1995):
PRI=(ρ531−ρref)/(ρ531+ρref) (3)
The original PRI formulation by Gamon et al. (1992) used 550 nm as the primary reference band since, according to a study on sunflowers, it seemed least affected by changes in green canopy structure. It also had 531 nm and reference wavelength swapped compared to recent use (c.f. Eq. 3). Later studies noted that for leaf-level reflectance, 570 nm appears to normalise best for confounding effects like pig-ment content and chloroplast movepig-ment (Gamon et al., 1993, 1995). Thus, 570 nm became the most widely used PRI ref-erence band. Recently, Middleton et al. (2009) showed for a douglas fir forest that reference bands in the ranges 540– 574 nm, 480–515 nm and 670–680 nm have a high correla-tion with foliage LUE. An overview on protocols used for PRI studies can be found in a review by Garbulsky et al. (2010b).
PRI can be a useful proxy for LUE because changes in reflectance at 531 nm are a side effect of mechanisms that protect the photosynthetic system in the leaves from excess light by down-regulating carbon assimilation (for an exten-sive summary, see Middleton et al., 2009; Coops et al., 2010). PRI also correlates with the total content of carotenoid pig-ments (Stylinski et al., 2002), this needs to be considered when looking at seasonal changes in PRI.
At site level, PRI has been shown to give good estimates of LUE when derived from field spectrometers (Gamon et al., 1992), but also from airborne sensors (Nichol et al., 2000, 2002; Rahman et al., 2001). Recently, the MODIS sensor on TERRA and AQUA has also been used successfully at ecosystem scale (Rahman et al., 2004; Drolet et al., 2005, 2008; Garbulsky et al., 2008; Goerner et al., 2009; Xie et al., 2009). MODIS provides a useful temporal resolution, a band
around 531 nm, but not the reference band at 570 nm. Thus, the MODIS PRI has been based on several alternative refer-ence bands. However, the PRI has some well known limita-tions (Grace et al., 2007). Multiple studies showed that the PRI signal is affected by the viewing and illumination geom-etry, including the fraction of sunlit and shaded leaves seen by the sensor, canopy structure, and background reflectance (Barton and North, 2001; Nichol et al., 2002; Su´arez et al., 2008; Sims and Gamon, 2002; Louis et al., 2005; Drolet et al., 2008; Hilker et al., 2009; Middleton et al., 2009). These difficulties, along with data access problems, might have hindered the evaluation of an LUE model based on MODIS PRI across space and time. So far it is unclear if one model can be applied at multiple sites. Also, the ques-tion remains whether one MODIS PRI reference band can be recommended for all sites, or if different reference bands have to be used depending on for example plant functional type and vegetation density.
Despite the fluctuations in illumination geometry, dimen-sion of the surface area sensed by each instantaneous field-of-view and background reflectance at every site, the site level models based on MODIS PRI published so far yielded good agreement with observed LUE. That considerable po-tential exists for mapping LUE with a common model has also been shown by Drolet et al. (2008), who found a unify-ing model for eight sites in central Saskatchewan. These bo-real sites are close to each other (within the confines of one satellite scene), hence they can be simultaneously monitored instead of by comparing data from different image acquisi-tions. The viewing geometry and atmospheric disturbance of the satellite signal is therefore similar. Consequentially, the next step is to evaluate PRI based models across sites and satellite scenes.
In this study, we evaluate the effectiveness with which MODIS-based PRI can be used to estimate ecosystem light use efficiency (LUE) at study sites of four distinct plant func-tional types and different vegetation densities. Our objec-tive is to find out if the limitations can be overcome and a single PRI-based model of LUE (i.e. based on the same reference band) can be applied under a wide range of con-ditions. Furthermore, we were interested in how different fAPAR products affect the in-situ LUE estimates which are used as ground truth.
2 Data and methods
2.1 Selection of study sites
Table 1. Overview of the sites used in this study.
Site code Site name Lat, Lon Data PFT (dominant species) LAI References
(flux tower) used
ZA-Kru Skukuza, Kruger −25.0197, 2001– Savanna (Combretum 1 (area average trees, Scholes et al. (2001);
National Park 31.4969 2003 apiculatum, Sclerocarya max.) Kutsch et al. (2008)
(South Africa) birrea, Acacia nigrescens) 3 (within tree
canopy, max.) 1 (herbaceous layer, avg.)
FR-Pue Puechabon (France) 43.7414, 2000– evergreen 2.8±0.4 Allard et al. (2008)
3.59583 2006 broad-leaved forest
(Quercus ilex L)
IT-Cpz Castelporziano 41.7052, 2000– evergreen broad-leaved 3.2–3.8 Tirone et al. (2003)
(Italy) 12.3761 2006 forest (Quercus ilex L.)
US-MMS Morgan Monroe 39.3231, 2000– deciduous broad-leaved 4.8 Schmid et al. (2000)
State Forest (US) −86.4131 2005 forest (sugar maple, tulip
poplar, sassafras, white and red oak)
US-Me2 Metolius – 44.4523, 2003– evergreen needle-leaved 2.8 (overstorey), Thomas et al. (2009)
intermediate aged −121.557 2005 forest (Pinus ponderosa) 0.2 (understorey)
ponderosa pine (US)
Here, we focus on non-boreal forest/savanna sites with wa-ter stress during part of the year. Some sites have to be ex-cluded because of too few valid PRI data. Such data scarcity can be caused by frequent cloud cover or saturation of the satellite signal at sparsely vegetated sites. The largest limi-tation on the number of relevant sites is the size of the tar-geted ecosystem surrounding the flux tower. It must be large enough to contain the footprint of a≥1×1 km MODIS pixel so that the flux tower footprint is representative of the re-motely sensed footprint.
We thus conducted our analysis on 5 sites: two dry-summer subtropical evergreen broad-leaved forests, a site with vegetation typical for tropical savanna, a humid-subtropical deciduous forest and a dry-summer humid-subtropical evergreen needle-leaved forest. All years for which eddy co-variance and MODIS data are available simultaneously were analysed (Table 1). Castelporziano is a borderline case re-garding the extension of the target ecosystem. For this site, we discarded satellite scenes in which the pixel containing the flux tower is partially made of non-forest.
2.2 In-situ LUE
We define LUE as the effectiveness with which an ecosystem uses absorbed photosynthetically active radiation (aPAR) to produce photosynthates (recorded as gross primary produc-tivity, GPP):
LUE= GPP
faPAR×PAR (4)
We used daily and half-hourly GPP data derived from eddy covariance measurements, in-situ PAR measurements from the Fluxnet LaThuile data base, and different satellite based faPAR data sets. The eddy covariance data were processed using the standardised methodology described in Papale et al. (2006); Reichstein et al. (2005). We calculated aPAR as the product of available photosynthetically active radiation (PAR, here in the form of average daylight photosynthetic photon flux density – µmol m−2s−1) and the fraction of PAR that is actually absorbed by the vegetation (faPAR).
Table 2. Bandwidth of the MODIS spectral bands used in this study.
The narrow red bands 13 and 14 were excluded right from the begin-ning because they tend to saturate over land (Goerner et al., 2009).
Band Bandwidth (nm) Use in this study
1 620–670 PRI, NDVI
2 841–876 NDVI
4 545–565 PRI
10 482–493 PRI
11 526–536 PRI
12 546–556 PRI
products) or 23 days (equal to 2 missing values in the aggregates MODIS product). The light use efficiency calculated with these faPAR data is denoted as LUEMODIS,
LUESeaWiFSand LUECyclopes. For the US-Me2 site, no valid
aPAR is contained in the Cyclopes data set throughout the study period.
2.3 Modelling LUE from MODIS based PRI
2.3.1 Acquisition and processing of MODIS reflectance
data
To process the MODIS data for this study, we modified the procedure described by Drolet et al. (2005) as follows. Three MODIS products were downloaded from the Level 1 and At-mosphere Archive and Distribution System (http://ladsweb. nascom.nasa.gov). Of those products, from both the Terra and Aqua satellite, we selected all scenes containing the tower locations. The MOD/MYD021KM product contains calibrated digital signals measured by the MODIS sensor, from which at-sensor reflectances and radiances can be cal-culated from two pairs of scale and offset terms included in the product (Toller et al., 2005). We calculated top-of-atmosphere reflectances for the spectral bands listed in Ta-ble 2. The MOD/MYD03 product has the same spatial ex-tent and resolution and provides the geographic coordinates as well as the solar and sensor zenith and azimuth angles of each pixel. These geolocation data were used to extract the spectral information of the pixel closest to each tower loca-tion. The MOD/MYD04 were used for an initial cloud cover screening.
Those acquisition dates were discarded where the quality flags attached to the MODIS products indicated saturation of a detector, where cloud cover is likely or where the sensor viewing angle at the tower site is more than 40◦(otherwise
the MODIS pixel footprint would get too large, the result being a mixed signal from different land cover classes, c.f. Wolfe et al., 1998).
Light reaching a satellite sensor after traveling trough the atmosphere is inevitably affected by scattering and absorp-tion. In addition, natural surfaces reflect light differently subject to the viewing geometry. Ideally, data recorded by
a satellite sensor should be corrected for these wavelength-dependent effects to make the reflectances computed from these records comparable. Albeit, from a previous study (Goerner et al., 2009) and preliminary experiments we know that correcting MODIS reflectances with bidirectional re-flectance distribution function (BRDF) parameters from ex-isting data bases either has no effect on the PRI signal (when using POLDER/PARASOL based parameters (Bacour and Br´eon, 2005), see Fig. 2 in the Supplement) or only seems to increase noise in the PRI signal (when using the MODIS MOD43 product, see Fig. 3 in the Supplement). Additional doubt about the usefulness of correcting reflectance data for this study using ready made products is caused by the un-availability of a BRDF model and atmospheric parameters at the exact acquisition time and spatial resolution of the radi-ance data and some of the spectral bands listed in Table 2. Because the need for synchronous estimates of atmospheric parameters flagged as high quality also reduces the number of available observations, we chose not to correct specifically for atmospheric or surface anisotropy effects. To some de-gree, a correction is inherent in a ratio made of reflectances that are not too far apart in the visible part of the solar spec-trum.
The MODIS cloud mask does not allow the detection of cloud cover or cloud shadows with absolute certainty. To rule out cloudiness, we visually checked for each day if the daily course of incident PAR (measured in-situ as Photosynthetic Photon Flux Density on half-hourly basis) follows an ideal curve. Acquisition dates at which the measured PAR at the flux towers notably differs from the PAR pattern during cloud free days at the same time of year were excluded from further analysis (see Fig. 1 in the Supplement for example).
2.3.2 Preparation of vegetation indices
The standard configuration of the PRI (Eq. 3) has to be adapted to the spectral bands available on MODIS (Drolet et al., 2005). The MODIS band 11 is centred at 531 nm (cf. Table 2). As the MODIS-sensor is not equipped with a spectral band centred at 570 nm, we tested bands 1 (620– 670 nm), 4 (545–565 nm), and 12 (546–556 nm) as poten-tial reference bands, in accordance with the proposition of Drolet et al. (2005, 2008). A modification of PRI has been computed from top-of-atmosphere reflectances for each of the 4 reference bands, denoted by PRI1, PRI4. PRI10, and
PRI12. We compared the performance of the PRI as a proxy
Table 3. Overview of abbreviations used for “in-situ” light use efficiency and for LUE modelled from vegetation indices (The models
denoted with∗were established for each site (for all MODIS viewing angles and also specifically for viewing angles<10◦) as well as for all evergreen sites combined and the two evergreen oak sites combined.)
abbreviation explanation
LUE used for evaluation
LUEMODIS light use efficiency calculated from site GPP, site PAR, and MODIS faPAR
LUESeaWiFS light use efficiency calculated from site GPP, site PAR, and JRC SeaWiFS faPAR
LUECyclopes light use efficiency calculated from site GPP, site PAR, and Cyclopes faPAR
LUE modelled from vegetation indices, general scheme*
LUEPRIX,Y LUE modelled from regression between PRIX(i.e. with reference band X) and LUEY
LUE modelled from vegetation indices, example
LUEPRI1,SeaWiFS LUE modelled from regression between PRI1and LUESeaWiFS
LUEPRI LUE modelled from regression between PRI and observed LUE (summary term for multiple models)
LUENDVI,MODIS LUE modelled from regression between NDVI and LUEMODIS
LUE calculated using look-up table and site meteorology
LUEMOD17 LUE calculated from biome specific MOD17 parameters and siteTmin, VPD
LUEMOD17,opt LUE calculated from optimised biome specific MOD17 parameters and siteTmin, VPD
(NDVI) (Tucker, 1979) from reflectance data: NDVI=ρNIR−ρred
ρNIR+ρred
=ρbd2−ρbd1
ρbd2+ρbd1
(5)
2.3.3 Empirical PRI-based LUE models
Exponential relationships between observed LUE
(LUEMODIS, LUESeaWiFS, LUECyclopes) and PRI were
explored with Bayesian hierarchical models. Models were established separately for each version of PRI with data binned as follows:
– observations from all evergreen sites combined (i.e.
FR-Pue, IT-Cpz, US-Me2; separate models for NDVI, PRI1,
PRI2. PRI10and PRI12),
– observations from the two evergreen broad-leaved sites
combined (i.e. FR-Pue, IT-Cpz; also separate models for each vegetation index),
– one site specific model (for sensor viewing zenith angles
≤40◦), this results in five models per vegetation index,
– separate bins for each range of viewing zenith angles
(0–10◦, 10–20◦, 20–30◦, 30–40◦) for each site, this re-sults in 20 models per vegetation index.
Results for all those viewing angle bins are listed in the Supplement. In the following we will only show outcomes for the complete range of viewing angles and near-nadir ob-servations (0–10◦). The variance explained with models fit-ted to the other bins lies in between those two. Table 3 gives an overview of how observed and modelled light use efficien-cies are denoted in this study.
2.4 LUE modelled fromTmin, VPD and plant functional
type
For benchmarking the performance of vegetation index-based LUE proxies, we also calculated the LUE in the way it is operationally used in the MODIS GPP algorithm (Heinsch et al., 2003). In this approach, a biome-specific maximum light use efficiency is reduced by a vapour pressure deficit scalar and a minimum temperature scalar. These attenua-tion scalars are calculated from daily daylight VPD andTmin
based on linear ramp functions, the parameters of which are contained in the biome property look-up table (BPLUT).
LUEMOD17=LUEmax,BLUT×f(VPD)×f(Tmin) (6)
We computed LUEMOD17using the standard MOD17
pa-rameters and LUEMOD17.optusing parameters that have been
optimised per site and year by Enrico Tomelleri (see section on LUE models in the Supplement of Beer et al., 2010).
As this study is concerned with the site level, we use for both LUEMOD17and LUEMOD17.optsite measurements of
VPD and Tmin from the Fluxnet LaThuile data set instead
● ● ●● ● ● ● ● ● ● ● ● ● ● ● ● ● ● ● ● ●● ● ● ● ● ● ● ●●●● ● ● ● ●● ●●●●● ● ● ● ● ● ● ● ● ● ●● ● ● ●●● ● ● ●● ● ● ● ● ● ● ● ● ●● ●● ● ●● ● ●● ● ● ● ●●● ● ● ● ● ● ● ●●●● ● ●●●●● ● ● ● ●● ● ● ●
0.00 0.02 0.04
0.00 0.01 0.02 0.03 0.04 daily LUE halfhour ly LUE ZA−Kru
r2 = 0.65 y = 0.69 x + 0.0013
10:00−10:30 13:30−14:00 ●●● ● ● ● ● ● ● ● ● ● ● ● ● ● ● ● ● ● ● ● ● ● ● ● ● ● ● ● ●● ● ● ● ● ● ● ● ● ●● ● ● ● ● ● ●● ● ●● ● ● ● ● ● ● ● ● ● ● ● ● ● ●● ● ● ●●●● ● ● ● ● ● ● ● ● ● ● ● ● ● ● ● ●●● ● ● ● ● ● ● ● ● ●● ● ● ● ● ● ● ●●● ● ● ● ● ● ● ● ● ●●● ● ● ● ● ● ● ●● ● ● ● ● ● ● ● ● ● ● ● ● ●● ● ● ● ● ● ● ● ● ●● ● ●●● ●●● ● ● ● ●●●● ●●● ● ●●●● ● ● ● ●● ● ● ●●●●● ● ●●●● ● ●● ● ● ● ●●●● ● ● ● ● ● ● ●●●● ● ● ● ● ● ● ● ● ●● ● ● ● ●●●●●●● ●●● ● ●●● ● ●● ● ● ● ● ● ● ● ● ● ●●● ● ● ● ● ● ● ● ● ● ● ●● ●● ● ● ●●●●● ● ●● ● ●● ● ●●● ● ● ● ● ● ● ●● ● ● ●● ● ● ● ● ● ●●● ●● ● ● ● ● ● ● ● ●● ● ● ● ● ● ● ● ● ● ● ● ● ● ● ● ● ● ● ● ● ● ● ● ● ● ● ● ● ● ●
0.00 0.01 0.02 0.03 0.04
daily LUE FR−Pue
r2 = 0.91 y = 0.97 x + −0.0011
10:30−11:30 12:30−13:00 ● ●● ●● ●●● ● ● ● ● ● ● ● ●● ● ● ●● ● ● ● ● ● ● ● ● ● ●● ●●● ● ● ● ● ● ●●●● ● ● ●●● ●● ● ●●●● ● ● ● ● ● ● ● ● ● ● ●● ● ●● ● ● ● ●●●● ● ● ●● ● ● ● ● ●● ● ● ● ● ● ● ● ● ●● ● ● ● ● ● ● ● ● ● ● ● ● ● ● ● ● ● ● ● ● ● ● ● ● ● ● ● ● ● ● ● ● ● ● ● ● ● ●● ● ● ● ● ●● ● ● ● ● ● ●●●● ● ●●●●● ● ● ● ● ● ● ● ● ● ●● ● ● ● ● ● ●●●● ● ● ●●● ● ● ● ● ● ● ● ●● ●● ● ● ● ● ● ● ● ● ● ●● ● ● ● ● ● ● ●● ● ● ● ● ● ● ● ●● ● ●● ● ● ● ● ● ● ●● ● ● ● ●● ●● ● ● ● ● ● ● ●●● ● ● ● ●●● ● ●●● ● ●●●●● ● ● ● ● ● ● ● ● ● ● ● ● ● ● ● ● ● ● ● ● ● ●●● ● ●●● ●● ● ● ● ● ● ● ● ●●●● ● ● ● ● ● ●● ● ● ● ● ● ●● ● ● ● ● ● ● ● ● ● ● ● ● ● ● ● ● ● ● ●● ● ● ●● ● ● ● ● ● ●●●●●●● ● ● ● ● ● ● ● ● ● ● ● ● ●●● ● ● ● ●● ● ● ● ● ● ● ● ● ● ● ● ● ● ● ●●● ● ● ● ● ●
0.00 0.01 0.02 0.03 0.04
daily LUE IT−Cpz
r2 = 0.71 y = 1 x + −0.0011
10:00−11:00 12:00−12:30 ● ●● ● ● ● ● ● ●● ● ● ● ● ● ● ● ● ● ● ● ● ● ● ● ● ● ● ● ● ● ● ● ● ● ● ● ● ● ● ● ● ● ● ● ● ● ● ● ● ● ● ●● ●● ● ● ● ● ● ● ● ● ● ●● ● ● ● ● ● ● ● ● ● ●● ●●● ● ● ● ● ● ● ●● ● ● ● ●●●● ● ● ● ●● ● ● ● ● ● ●● ● ● ●● ● ● ● ● ● ● ● ●● ● ●
0.00 0.01 0.02 0.03 0.04
daily LUE US−MMS
r2 = 0.9 y = 0.9 x + −0.00049
11:00−12:00 13:30−14:00 ● ● ● ●●● ●● ● ●●●● ● ● ● ● ● ● ● ● ● ● ● ● ●● ●●●●●●●● ●● ● ● ● ● ● ● ● ● ● ● ● ● ● ● ● ●● ● ● ●● ● ●● ● ● ● ●●● ● ● ● ● ● ●● ● ● ● ● ●● ● ● ● ●●●● ● ● ● ● ● ● ●●●●●●● ● ●● ● ● ● ● ● ●●● ● ●● ● ● ●● ● ● ● ● ●●●●●●●● ● ●● ● ● ● ● ● ● ● ●●● ●●
0.00 0.01 0.02 0.03 0.04
daily LUE US−Me2
r2 = 0.86 y = 0.89 x + −0.00044
[image:6.595.98.498.64.165.2]10:30−11:30 12:00−13:00
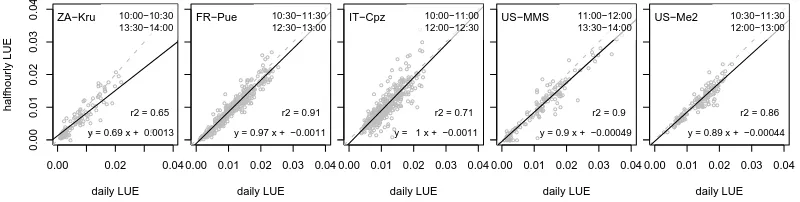
Fig. 1. Comparing daily and half-hourly light use efficiency (based on MODIS faPAR) for all the cloud free times where MODIS PRI is
available. The times of MODIS overpass are given in the upper right corner of each panel.
3 Results
3.1 Are LUEs at times of MODIS overpass
representative for the whole day?
The MODIS sensors operate sun-synchronous, i.e. images are only acquired within a certain window of local time (morning through midday on the Terra platform, midday through afternoon on the Aqua satellite). As a first step in our analysis, we checked if the LUE at time of satellite over-pass is representative for the whole day. For the five sites in this study, half-hourly LUEMODISduring the time of MODIS
overpass can explain 65% (ZA-Kru) through 92% (FR-Pue) of the variability in daily LUEMODIS(c.f. Fig. 1). The slope
of the regression line between half-hourly and daily LUE for ZA-Kru has the strongest deviation from the 1:1 line. Mid-day LUE at ZA-Kru is lower compared to other sites, while LUE in the late afternoon and evening is on average higher than at the other sites. This might be due to differences in moisture limitation. The atmospheric moisture demand in-creases during middays stronger than at the other study sites (see Figs. 5 and 6 in Supplement).
The relationship between halfhourly and daily LUE re-mains the same when using other faPAR products. This jus-tifies the use of PRI “snapshots” to estimate daily LUE.
3.2 Which MODIS-PRI version suits which setting?
In the next step of our analysis, we only use LUEMODIS to
evaluate the different modelled LUEs and to figure out which PRI configuration is most useful for which site. Afterwards, the effect of using different faPAR products is scrutinised us-ing only the best suited PRI reference bands.
As an example for the relationship between PRI and LUE, Fig. 2 shows PRI1 and LUEMODIS for all five studies sites
as well as for the combined evergreen and oak models (c.f. Sect. 2.3.3). We chose exponential functions to avoid negative modelled LUEs. The divergences between the fitted models become already apparent in this example.
For all LUE modelled site-specific based on PRI and NDVI, the correspondence with LUEMODISis better for
near-nadir observations than for all observations together (c.f.R2s in Fig. 3).
LUEMODIS can be modelled properly based on PRI
for the savanna site ZA-Kru (R2 for near nadir observa-tions [Rnadir2 ] = 0.78, R2 for all observations [R2all] = 0.49) and for the deciduous broad-leaved forest site US-MMS (Rnadir2 = 0.71, R2all= 0.46). LUEMODIS can be reasonably
well modelled for the two evergreen oak forest sites (FR-Pue:
Rnadir2 = 0.57,Rall2 = 0.45; IT-Cpz: Rnadir2 = 0.43,Rall2 = 0.44). The modelling of LUEMODISfor the evergreen needle-leaved
forest US-Me2 is less successful using PRI (Rnadir2 = 0.37,
Rall2 = 0.2, see also the table in the Supplement).
The optimal reference band for the PRI differs between sites. For three sites with completely different character-istics, LUEPRI1,MODIS with a site-specific model explains
most of the variability in daily LUEMODIS(ZA-Kru, FR-Pue,
US-MMS). PRI4is most suitable for modelling LUE at
IT-Cpz. LUEPRI12,MODISworks best at the US-Me2 site.
3.3 Can LUE estimation from MODIS-PRI be
generalised?
Ideally, a model of light use efficiency would be parame-terised once for all possible cases, or for well defined cat-egories, and could then be applied to other location in the same range of environmental conditions. When applying the model that has been established for the pooled evergreen-site observations at site level, the correspondence with observed LUE values is low (c.f. Figs. 2b, 3, 4) as it can be expected for sites of different plant functional type and location. Even when parameterising a model for the two evergreen broad-leaved forest sites with the same dominant species, the ex-plained variability is low.
3.4 How does LUE modelled from MODIS-PRI
compare to other LUE models?
Of course, estimating LUE from PRI would not be justified if the same or a better accuracy can be achieved with mod-els/data that are already operational.
LUENDVI,MODISresulted only for the two sites with high
0.0 0.1 0.2 0.3
0.00
0.01
0.02
0.03
PRI 1
LUE (MODIS f
apar)
all viewing angles near nadir viewing angles
FR−Pue IT−Cpz
a
0.0 0.1 0.2 0.3
PRI 1 US−Me2 evergreen sites oak sites
b
0.0 0.1 0.2 0.3
PRI 1 ZA−Kru US−MMS
[image:7.595.128.471.63.208.2]c
Fig. 2. Light use efficiency (based on MODIS faPAR) versus PRI based on reference band 1 with exponential models fitted to the
observa-tions. The shaded areas represent the 95% Bayesian confidence interval. For each site, two different models were calculated. One is using all available observations (solid lines) and the other only observations with near nadir sensor viewing angles (0–10◦, dashed lines). In addition, the combined models for evergreen sites (FR-Pue, IT-Cpz, US-Me2) and oak sites (FR-Pue, IT-Cpz) are shown (panel c).
R^2 (LUE)
0.0 0.2 0.4 0.6 0.8 1.0
ZA−Kru FR−Pue IT−Cpz US−MMS US−Me2 evergreen oak
0−40 0−10 0−40 0−10 0−40 0−10 0−40 0−10 0−40 0−10 FR IT US2 ev FR IT oak
best reference band:
1 1 4 1 12 1 10 1 1 1 10 1
N N
N N
N N
N N
N N ●
●
● ●
● ● ●
●
● ●
●
● ● ● ●
● ● M
M M
M M M M M M
M
m m
m m
m m m
m
m m
N M m
NDVI, MODIS faPAR MOD17, MODIS faPAR opt. MOD17, MODIS faPAR
●PRI 1
PRI 4 PRI 10 PRI 12
Fig. 3.R2of modelled LUE vs. LUEMODISfor two ranges of sensor viewing zenith angle: 0–40◦and 0–10◦. The most suitable reference band for each site is displayed at the top. The same pattern appears when using the root mean square error (not shown).
LUE: for near-nadir observations in ZA-Kru, and when using all observations in US-MMS. The differences inR2 to the best LUEPRIare only 0.03% and 0.2% (c.f. Fig. 3, Table in
the Supplement).
For the sites we have studied, LUEMOD17has in every
set-ting much less agreement with observations than LUEPRI.
LUEMOD17,opt.performs much better, though not superior to
LUEPRIexcept at FR-Pue with MODIS viewing angles
rang-ing from 0–40◦. The agreement between LUE
MOD17.optand
the reference LUE increases slightly (without changing any of the statements above) when using faPAR from MODIS collection 4 instead of 5 to calculate LUEMOD17because the
MOD17 parameters have been optimised based on collec-tion 4 data (not shown). Note that, while benchmarking with
LUEMOD17 and LUEMOD17.opt provides an additional point
of reference, the main evaluation is performed with in-situ LUE.
3.5 Which influence does the choice of an faPAR
product have on PRI evaluation?
For the deciduous forest site (US-Me2), the choice of fa-PAR product does not influence the relationship between ob-served and modelled LUE. The temporal dynamics of both the MODIS and SeaWiFS faPAR are very similar, Cyclopes faPAR is not available for this site.
[image:7.595.142.455.280.453.2]R^2 (LUE) 0.0 0.2 0.4 0.6 0.8 1.0
ZA−Kru FR−Pue IT−Cpz US−MMS US−Me2 evergreen oak
0−40 0−10 0−40 0−10 0−40 0−10 0−40 0−10 0−40 0−10 FR IT US2 ev FR IT oak
best faPAR product with given reference band:
M/S M S M M M S M S M S M
N N N N N N N N N N ● ● ● ● ● ● ● ● ● ● ● ● ● ● ● ● ● ● ● ● ● ● ● ● ● ● ● ● ● ● ● ● ● M M M
M M M
M M M M m m m m m m m m m m N M m
[image:8.595.151.447.63.227.2]NDVI, MODIS faPAR MOD17 LUE optimized MOD17 ●PRI1 PRI 4 PRI 10 PRI 12 MODIS fapar Seawifs fapar Cyclopes fapar
Fig. 4.R2of modelled vs. observed LUE using PRI with the best reference band for each site to find out the most suitable faPAR product for each setting. At each site, two ranges of sensor viewing zenith angle are shown: 0–40◦and 0-10◦. The best faPAR product for a given reference band is denoted with M (MODIS MOD15) and S (JRC SeaWiFS faPAR).
● ● ● ● ● ● ● ● ● ● ● ●● ● ● ● ● ● ●● ●● ● ●●●●● ● ●●● ● ● ● ●●●● ●● ● ● ● ● ● ● ●●●●●●●●●●●●●●●●●●●●● ● ● ●● ● ● ●● ● ●●●●● ●● ● ● ● ● ● ● ●● ● ● ●● ● ● ●●● ●●●● ●●●● ●
−0.05 0.05 0.15
0.0 0.4 0.8 PRI 1 faP AR ●● ● ● ● ● ● ● ● ● ● ●● ● ● ● ● ● ●● ●● ● ●●●●●● ●●●● ● ● ●●● ●●● ●●●● ● ● ● ● ●● ● ● ● ● ● ● ● ●●●●●● ● ● ●● ● ●●●●●●● ● ●●●●● ●● ● ● ● ● ● ● ●● ● ● ●● ● ● ●●● ●●●● ●●●● ● ● ● ● ● ● ● ● ● ● ● ● ●● ● ● ● ● ● ● ● ●● ● ● ●● ● ● ● ●●●●● ● ● ● ● ● ● ●● ● ● ● ● ● ● ● ●●● ● ● ● ● ● ● ●●●● ● ● ● ● ●● ● ● ●● ● ● ●● ● ●●●● ● ●● ● ● ● ● ● ● ●● ● ● ●● ● ● ●●● ●●●● ●●●● ●
M; R2= 0.67 ***
S; R2= 0.69 ***
C; R2= 0.75 *** ZA−Kru ● ● ● ● ● ● ● ● ● ●● ● ● ● ●●●●●●●●● ●●● ● ● ●● ●●●● ●● ● ● ● ●●● ● ●● ●● ●● ●●●● ●●●● ●●● ●● ● ● ●●●●●●●●● ●●●● ● ●● ●●● ● ● ●● ●●● ● ●●●●●●● ●●● ● ● ●●● ●●● ● ●●●●●●● ●● ● ●● ● ●● ● ●● ● ●●●●● ●●●● ●●●●●●●●●●●●●●●●●●●●●●●●●●●●●●●●● ●●●●●●● ● ●●●●● ●● ● ● ● ● ● ●● ● ● ● ● ●●●●● ●●●●● ●●●●●●●● ●●●●●●● ● ●●● ●● ●●● ● ● ● ● ●●● ●●●● ● ● ● ● ●●●● ● ● ● ● ● ● ● ●●●●●●●●● ●● ● ● ● ● ●●● ●● ●● ●● ●●●● ● ●● ●●●●●●●●●●● ● ● ● ● ● ●●●●●● ●●● ● ● ●●● ●●●● ●●● ●● ● ● ● ● ● ●● ● ● ●●● ●●●●●●●
0.10 0.20 0.30
PRI 1 ●● ● ●● ● ● ● ● ● ● ● ● ● ● ● ● ●● ● ●●● ● ● ● ●● ● ● ●●●● ● ●●● ● ● ● ●●● ● ●● ●● ● ● ● ●●● ●●●● ● ● ● ● ● ● ●● ● ● ●●●●●●●●● ● ●● ● ● ●● ●●● ● ● ●● ●●● ● ●●● ● ● ● ● ●●● ● ● ●●● ●●● ● ●●●● ●● ●●● ● ●●●●●● ●● ● ●● ●●●● ●●●● ●●● ●●●●● ● ●●● ●● ● ● ●● ● ● ●● ● ● ● ● ● ●●● ● ● ● ●● ● ●● ●●●●●●●●●●● ● ● ● ●● ● ● ● ● ●●●●● ●●●●● ● ● ●● ● ●● ● ● ● ● ● ●●● ●●●● ● ● ● ● ● ●● ● ● ●●● ●● ● ●● ● ● ● ● ●● ● ● ● ● ● ● ● ● ● ● ● ● ● ●● ● ● ● ●●●●●●●●● ● ● ● ●● ● ● ● ● ● ● ● ●● ● ● ●● ●●●●●● ●● ●● ●●●●●●● ● ●● ● ● ● ● ●● ● ● ●●●●●●●●● ● ●● ● ● ●● ●●● ● ● ●● ●●● ● ●●●● ● ● ● ●●● ● ● ●●● ●●● ● ●●●●●●● ●● ● ●●●●●● ●● ● ●● ●●●● ●●●●●●● ●●●●●● ● ●●●●●
M; R2= 0.19 ***
S; R2= 0.18 ***
C; R2= 0.52 *** FR−Pue ●● ● ● ●●● ●●●●●● ●● ●●●●● ● ● ●●●● ●●● ● ●●●●●●●●●●●●●●●●●●●●●●●●●●●●●●●●● ●●● ● ● ●● ● ●●●●●●●●●● ● ●●●●●●●●● ● ● ● ●● ● ●● ● ●●● ●●● ●●● ● ● ● ● ●● ● ● ● ● ● ●●●●● ● ●●● ●● ● ● ●●●●●● ●●● ●●●●●●●●●●●●●●●●●●●●●●●●●●●●●●●●●●●●●●●●●●●●●●●●●●●● ●●●●●●●●●●● ● ●● ● ● ● ● ● ● ● ● ● ● ● ●● ●●●●●● ●●●●●●●●●●●●●●●●●●●● ●●●●●●●●●●●●●●●● ●● ● ●●●● ●●● ● ● ● ● ● ● ●● ● ●● ●●●● ●●●●●●●●●●●●●●●●●●●●●●●●●●●●●●●●●●● ● ● ● ● ● ● ●● ● ● ● ● ● ●●●● ●●●●● ● ● ● ● ● ●●●●●●●●●●●●●●●●●●●●●●●●●●●●●●●●●●●●●●●● ● ● ●●●● ●●
0.02 0.04 0.06
PRI 4 ● ●● ● ● ●● ●● ● ●● ● ● ● ● ● ● ● ● ● ● ● ● ● ● ●● ●●● ● ● ● ●●●●●●●●●●●●●●●●●●●●●●●●●● ● ●●●● ● ● ● ● ● ● ●● ● ●●●●●● ● ● ● ● ● ●●● ● ● ● ●●● ●● ●● ●● ●● ● ● ● ● ● ●● ●●● ● ● ● ● ●● ● ● ● ● ● ●●●●● ● ●●● ●● ● ● ● ● ● ● ● ●● ●● ● ●●● ● ● ● ●●●● ●●●● ●●●●●●●●●●●●●●●●●●●●●●●●● ● ● ●●●●●●●●●● ●●●●●●● ● ● ● ● ●●●●●●●●●●● ● ● ● ● ● ● ● ● ● ● ● ●●●●●● ● ● ● ● ● ●● ●● ● ●● ●●● ● ● ● ● ● ●●●●●● ●●●●●●●● ● ● ●●● ●● ● ●●● ● ●● ● ● ● ● ●● ● ● ● ●● ● ● ● ● ●● ● ● ●● ●● ● ●● ● ● ● ● ● ●● ● ●● ● ● ● ● ●● ●●● ● ● ● ●●●●●●●●●●●●●●●●●●●●●●●●●●●●●●● ● ● ● ● ● ● ● ●● ● ● ● ●●●● ● ● ● ● ● ●●●●●●●●● ● ● ● ●● ●● ●● ● ● ● ● ●● ●●● ● ● ● ● ●● ● ● ● ● ● ●●●●● ● ●●● ●● ● ● ● ● ● ● ● ●● ●● ● ●●● ● ● ● ●●●● ●●● ●●●●●●●●●●●●●●●●●●●●●●●●●●●● ● ●●●●●●●●● ●●● ●●● ●● ●● ● ● ● ● ● ● ●●
M; R2= 0.42 ***
S; R2= 0.091 ***
C; R2= 0.038 ** IT−Cpz ● ● ● ● ● ● ● ● ● ● ● ● ● ● ●●●● ● ● ● ● ● ● ● ● ● ●● ● ● ● ● ● ● ●●●● ● ● ● ● ●● ● ● ● ● ● ● ● ● ● ●● ● ● ● ● ● ● ● ● ● ● ● ● ● ● ● ●● ● ● ● ● ●● ● ● ● ●●●● ● ● ● ● ●● ● ● ● ● ● ● ● ● ● ●●● ● ● ● ●● ●● ● ● ●● ●●●● ● ● ● ●
0.00 0.10 0.20 0.30
PRI 1 ● ● ● ● ● ● ● ● ● ● ● ● ● ● ●●●● ● ● ● ● ● ● ● ● ● ● ●● ● ● ● ● ● ●● ● ● ● ● ● ● ● ● ● ● ● ● ● ●● ● ● ● ● ● ● ● ● ● ●● ● ● ● ● ● ● ● ● ● ●● ● ● ● ●● ● ● ● ● ● ●● ● ● ● ● ●● ● ● ● ● ● ● ● ● ● ●●● ● ● ● ● ● ● ● ● ● ●● ●●●● ● ● ● ● ● ● ● ● ● ● ● ● ● ● ● ● ● ● ● ● ●● ● ● ●●● ● ● ● ● ● ● ● ● ● ● ● ●● ● ● ● ● ● ● ● ● ● ● ● ● ● ● ●● ● ● ● ● ● ● ● ●● ● ● ● ● ●● ● ● ● ● ● ● ● ● ● ● ● ● ● ● ●
M; R2= 0.73 ***
S; R2= 0.83 ***
C; R2= 0.56 *** US−MMS ● ● ● ● ● ● ● ● ●●●●●●●●●●●●●●●●●● ●●●●●●●●● ● ● ● ● ● ● ● ● ● ●●●●●● ●●●●● ●● ● ● ● ● ● ● ● ● ● ●● ● ●●●●●●●●●● ●●●●● ●● ● ● ● ● ● ● ● ● ● ● ● ● ● ● ● ● ●● ●●● ●●●●●●●●●●●●●●●●●●●●●●●●●●●●●●●●●●●●●●
−0.010 0.000 0.010 0.020
PRI 12 ● ● ● ● ● ● ●● ● ● ● ● ● ●●●●●●●●●●●●●●●●●●●●●●●●●●●●●●●●●●● ● ● ●●●●●●● ●●●●● ●●●●●●●● ● ● ● ●● ● ●●●●●●●●●●●●● ●●●●●●● ● ● ●●●●●●●●●●●●●● ● ● ● ● ● ● ● ●● ●● ● ● ●●● ●● ● ●●●●●●●●●● ● ●●●
M; R2= 0.4 ***
S; R2= 0.097 ***
US−Me2
Fig. 5. Scatterplots withR2of faPAR from different products (Black: MODIS – M), Red: SeaWiFS – S, Blue: Cyclopes – C) vs. PRI with site-specific most suitable reference band. Significance codes:pvalue≤0.001:∗∗ ∗;pvalue≤0.01:∗∗
In contrast with the other two faPAR products, Cyclopes faPAR at the ZA-Kru savanna site has a lower amplitude and does not seem to track the beginning and end of the growing season properly (concluded from comparing faPAR and GPP time series, data not shown). This might be the reason of the poor agreement between model and observation for the Cyclopes based LUE. SeaWiFS faPAR captures the length of the growing season for this savanna site well, which might be the reason for the higher agreement when using this faPAR product.
At the FR-Pue evergreen oak forest, both the MODIS and the SeaWiFS faPAR product show hardly any seasonality. This is probably why, despite MODIS faPAR having higher absolute values, choosing one or the other faPAR product has no influence on model fit. Cyclopes faPAR for the FR-Pue site has higher values in winter. The model fit is worse when LUE is based on Cyclopes faPAR.
At the other evergreen oak forest, IT-Cpz, using SeaWiFS faPAR instead of the other fapar products to calculate in-situ LUE results in a higher agreement with LUEPRI(c.f. Fig. 4).
A reason might be that the MODIS faPAR algorithm depends on proper biome classification and biome-specific canopy structures and soil patterns (McCallum et al., 2010).
3.6 Influence of vegetation structure on the PRI signal
For the deciduous sites (ZA-Kru and US-MMS), the MODIS photochemical reflectance index can be estimated from fa-PAR (see Fig. 5). The intra-annual changes in MODIS PRI are related to the temporal dynamics of total leaf area.
The fraction of PAR absorbed by the vegetation at the ev-ergreen sites shows little seasonal variation compared to the changes in PRI. Thus, for these sites the changes in PRI can-not be explained by variation in faPAR. This suggests that the changes in PRI in those evergreen sites are more a result of changes in leaf pigment composition rather than structural changes.
3.7 Sensitivity of the different modelled LUEs to
seasonal and interannual variability
The modelling approaches detailed in this study (c.f. Sects. 2.3.3, 2.4) differ in how well they are capa-ble of reproducing annual and interannual variations in LUE.
At the evergreen oak site FR-Pue, LUEPRI1 does
[image:8.595.96.504.285.389.2]0.00
0.01
0.02
0.03
0.04
LUE
FR−Pue, MODIS fapar, PRI ref. band 1 (MODIS viewing zenith angle 0−40°)
observed modeled from PRI 95% credible interval MOD17 optimized MOD17
−120
−60
0
w
ater deficit (mm)
[image:9.595.149.447.64.226.2]2000 2001 2002 2003 2004 2005 2006 2007
Fig. 6. Top: Time series of observed LUE as 14-day moving average (based on MODIS faPAR) and modelled LUEs (exponential model
based on PRI with reference band 1, MOD17, and optimised MOD17) at the FR-Pue site. Bottom: Water deficit in mm (calculated from field capacity and in-situ soil water content measurements).
0.00
0.01
0.02
0.03
0.04
0.05
LUE
IT−Cpz, SeaWiFS fapar, PRI ref. band 4 (MODIS viewing zenith angle 0−40°)
observed modeled from PRI 95% credible interval MOD17 optimized MOD17
−250
−150
−50
w
ater deficit (mm)
2000 2001 2002 2003 2004 2005 2006 2007
Fig. 7. Top: Time series of observed LUE as 14-day moving average (based on SeaWiFS faPAR) and modelled LUEs (exponential model
based on PRI with reference band 4, MOD17, and optimised MOD17) at the IT-Cpz site. Bottom: Water deficit in mm (calculated from water balance).
during summer drought, but not the interannual variability (c.f. Fig. 6). The observed LUE decline in summer is more pronounced during the 2003 heat wave, while the LUEPRI1
amplitude is similar to other years.
LUEMOD17 is less capable of capturing the summer
de-pression than the PRI based model. LUEMOD17.opt
repro-duces the minimum of summer depression well, but the mod-elled summer depression is much longer than observed.
At the other evergreen oak site, IT-Cpz, no distinct inter-annual variability is observed. The seasonal cycle is cap-tured well by LUEPRI4 (c.f. Fig. 7). Depending on the faPAR
product used for the in-situ LUE, LUE is severely over- or underestimated by LUEMOD17, the seasonal cycle is not well
reproduced. LUEMOD17.optshows a dampened seasonal
cy-cle and in general underestimates LUE.
At US-MMS the time series has gaps during cloud cover in winter time, but there are still enough observations and
PRI data to estimate the annual minimum in LUE. There is a peak in observed LUE in summer 2002 that is not reproduced by LUEPRI1, otherwise the seasonality is tracked well (not
shown). LUEMOD17does not match the LUE observations in
spring and autumn, while LUEMOD17.optunderestimates the
LUE peak in summer.
The evergreen needle-leaf site (US-Me2) possesses a low seasonal variability of LUE. The small fluctuations that are observed are neither well simulated by LUEPRI, nor by
LUEMOD17or LUEMOD17.opt(not shown).
The short LUE time series of the savanna site is mim-icked well by the PRI model, apart from an overestimation in 2002 and some missed nuances (not shown). LUEMOD17
and LUEMOD17values underestimate LUE observations,
[image:9.595.150.447.285.447.2]4 Discussion and conclusions
We conclude that in general estimating LUE at site-level based on PRI reduces uncertainty compared to the other ap-proaches we tested. There is only one set of LUE observa-tions which can be slightly better approximated by an LUE model based on VPD andTminthan by LUEPRI: the 0–40◦
viewing zenith angle FR-PUE data (c.f. Figs. 3, 4). Note that this LUE is not derived from the standard MOD17 parame-ters, but from parameters that have been optimised per site and year. This indicates that, at site level, MODIS-based PRI is very competitive as a proxy for light use efficiency.
It is apparent that fine-tuning maximum light use effi-ciency as well as the VPD and Tmin parameters improves
the performance of MOD17 type models of LUE (and ulti-mately GPP). However, our results support the growing body of evidence suggesting thatTminand VPD alone are not
suffi-cient to characterise temporal LUE (and hence GPP) dynam-ics due to i.e. drought stress (Kanniah et al., 2009; Maselli et al., 2009; Garbulsky et al., 2010a). Soil water availability determines stomatal conductance (Rambal et al., 2003) and hence productivity to a large extent and must be considered in LUE models that constrain a maximum LUE with environ-mental variables. Soil water estimates are difficult to obtain over larger regions. Estimates derived from remote sensing data are still poor, especially for forests (Guglielmetti et al., 2008). Surrogates of soil water content based on evapotran-spiration and precipitation could be a viable alternative Le-uning et al. (2005); Coops et al. (2007). Remotely sensed indices of vegetation water content such as the land surface water index (Xiao et al., 2005) or surface temperature might also help to obtain the seasonal variations of LUE in models that determine photosynthetic efficiency from environmental stresses (Hilker et al., 2008c). For these approaches, con-straints due to different image acquisition geometries must also be considered.
For the South-African savanna site and the humid sub-tropical deciduous broad-leafed forest (US-MMS), the accu-racy of LUE modelled from NDVI is comparable to that of LUEPRI. At both sites, vegetation greenness and faPAR (as
well as leaf area) are intrinsically linked to CO2exchange.
Hence NDVI and faPAR display similar seasonal dynamics as light use efficiency (Garbulsky et al., 2010b). The PRI signal in general is influenced both by changes in vegetation structure and by changes in pigment composition. Unsur-prisingly, the gain in accuracy through using PRI instead of NDVI or faPAR is highest for evergreen sites where changes in LUE are largely unrelated to greenness and changes in leaf area simply because there is little change in greenness over time while LUE varies significantly (see also Running and Nemani, 1988; Gamon et al., 1992; Garbulsky et al., 2010b). Despite the advantages of using PRI to estimate LUE at site-level, we found no universally applicable light use effi-ciency model based on MODIS PRI. Models that are
opti-mised for a pool of data from several sites do not perform well.
Plant functional type, even dominant species is not a suf-ficient criterion to generalise PRI based models. The two sites that are dominated by Quercus ilex, FR-Pue and IT-Cpz, seem to have a very different spectral response at comparable LUE levels since their optimal reference bands are 1 (red) and 4 (green). The different behaviour at IT-Cpz might be brought about by a different stand structure, as for example manifested in a higher LAI (c.f. Table 1), as well as higher ground water levels due to the closeness of the sea and hence less water stress (Valentini et al., 1992).
The optimal reference bands we determined (MODIS bands 1, 4, 12) fall within the spectral regions identified by Middleton et al. (2009); Cheng et al. (2009) as useful PRI reference wavelengths in a study on foliar LUE in a Dou-glas fir stand. Middleton et al. (2009) also showed that a PRI based on the relatively broad spectral bands of MODIS (10 nm) correlates well with PRI values derived from 3 nm wide bands. The results of our analysis suggest that the us-ability of different reference wavelength might depend on species composition and stand structure. The first study on PRI by Gamon et al. (1992) pointed out that no single refer-ence wavelength suited all purposes equally well (e.g. track-ing LUE in unstressed and water stressed sunflowers). The review by Garbulsky et al. (2010b) points out that the optical properties of the canopy are influenced – apart from species and environmental conditions – by the fraction of dead and woody biomass, vegetation density and spectral properties of the soil, all of which can affect the suitability of refer-ence bands. The present study adds to the body of knowledge showing that 570 nm is not the only reference bands suitable for PRI. A data base encompassing more sites with a diver-sity of functional and structural traits would be desirable to arrive at a final conclusion in this regard.
To increase the amount of data useful for a parameter es-timation, it would be helpful to include more heterogeneous sites in future analysis. A footprint climatology assessment such as described by Chen et al. (2009) in combination with multi-angular high spectral resolution measurements (Hilker et al., 2008b) would be valuable for optimising model pa-rameters in these cases. The impact of the sun’s position on the PRI-LUE relationships in this study should be limited by the similar data acquisition times (c.f. Fig. 1). Nevertheless, a follow on-study should consider the sensor angle relative to the position of the sun to obtain certainty on the influence of the image acquisition geometry on the PRI-LUE relation-ship.
Using only PRI values for near-nadir satellite observations does improve the accuracy of LUE predictions compared to using the whole range of viewing angles, or observations binned in off-nadir 10◦wide bands of viewing zenith angle. In a boreal setting, modelling LUE only based on PRI derived from backscatter reflectance also explained LUEobsvariance
2005, 2008). This is an indirect way of tackling the depen-dence of reflectance on viewing geometry. When looking from different angles, different fractions of e.g. tree canopy, understorey/grass, and soil will be visible to the sensor and result in a variation of surface reflection. Excluding off-nadir observations reduces this effect. For example, the va-lidity of the more densely vegetated and homogeneous FR-Pue site is less effected by viewing angle then the savanna site where the contribution of trees to the signal by MODIS is more dependent on viewing angle. Another reason why near nadir data might have a better correspondence with in-situ LUE is a smaller atmospheric effect on PRI/NDVI due to the shorter Earth surface-satellite distance at small view-ing zenith angles. The drawback of excludview-ing part of the data is of course that the temporal coverage might become inadequate. Hilker et al. (2009) found that most of the direc-tional effects on the LUE-PRI relationship can be attributed to atmospheric scattering. The standard single orbit algo-rithms such as 6S (Vermote et al., 1997) cannot compensate for this atmospheric disturbance. MAIAC, a generic aerosol-surface retrieval algorithm recently developed for MODIS (Lyapustin and Wang, 2009) showed promising results for detecting subtle changes in narrow waveband indices such as PRI (Hilker et al., 2009).
Another promising approach seems to be the considera-tion of shadow fracconsidera-tion in PRI-based estimaconsidera-tions of PRI. Ground-based pilot studies have been very successful in do-ing so (Hall et al., 2008; Hilker et al., 2009). The fraction of shaded/sunlit parts of the canopy has an important influence on the light use efficiency of vegetation and not just the PRI signal. However, which fraction of sunlit leaves is seen by a satellite depends on the position of the sensor relative to the canopy and the sun as well as the canopy structure. If the vegetation structure is not well known, uncertainty remains whether changes in PRI are due to a different position of the sensor or due to actual changes in LUE. For space-borne PRI studies, multi-angular acquisitions, taken within a short time period in which LUE is constant, are necessary (Coops et al., 2010).
Future research directions to improve the knowledge on PRI could include the development of physically-based mod-els that predict reflectance changes at 531 nm. Innovations in this regard must allow leaf optical properties to vary with leaf-level illumination conditions and base the computation of reflectance changes on down-regulation of photosynthesis (Coops et al., 2010).
In summary, when calibrated at site level a model based on MODIS PRI gives better or at least as good estimates of ecosystem light use efficiency as the other approaches we tested. In this study, an universally applicable model relating LUE to MODIS PRI across different sites could not be found.
Supplement related to this article is available online at: http://www.biogeosciences.net/8/189/2011/
bg-8-189-2011-supplement.pdf.
Acknowledgements. We are grateful for discussions with
col-leagues at the MPI for Biogeochemistry. We also appreciate the discussions on surface anisotropy with Franc¸ois-Marie Br´eon. Two anonymous referees and John Gamon have provided constructive comments for which we are thankful. AG, MR and ET gratefully acknowledge the support by the Max Planck Society. SR thanks Carboeurope-IP (GOCE-CT-2003-505572) and Drought+ (ANR-06-VULN-003-01) for supporting research at FR-Pue. Research at MMS was supported by the Office of Science (BER), US-Department of Energy. Castelporziano data have been provided by Riccardo Valentini and supported by the CarboItaly-FISR project. The Skukuza site was funded through grants to NH from US NSF and NASA We thank two anonymous referees and John Gamon for their valuable comments that helped to improve an earlier version of this manuscript..
The MODIS data are distributed by the Land Processes Distributed Active Archive Center (LP DAAC), located at the US Geological Survey (USGS) Earth Resources Observation and Science (EROS) Center (lpdaac.usgs.gov).
The service charges for this open access publication have been covered by the Max Planck Society.
Edited by: G. Wohlfahrt
References
Allard, V., Ourcival, J. M., Rambal, S., Joffre, R., and
Ro-cheteau, A.: Seasonal and annual variation of carbon
ex-change in an evergreen Mediterranean forest in southern France, Global Change Biol., 14, 714–725, doi:10.1111/j.1365-2486. 2008.01539.x, 2008.
Bacour, C. and Br´eon, F.-M.: Variability of biome reflectance direc-tional signatures as seen by POLDER, Remote Sens. Environ., 98, 80–95, doi:10.1016/j.rse.2005.06.008, 2005.
Baret, F., Hagolle, O., Geiger, B., Bicheron, P., Miras, B., Huc, M., Berthelot, B., Nino, F., Weiss, M., and Samain, O.: LAI, fAPAR and fCover CYCLOPES global products derived from VEGETATION Part 1: Principles of the algorithm, Remote Sens. Environ., 110, 275–286, doi:10.1016/j.rse.2007.02.018, 2007. Barton, C. V. M. and North, P. R. J.: Remote sensing of canopy
light use efficiency using the photochemical reflectance index – Model and sensitivity analysis, Remote Sens. Environ., 78, 264– 273, 2001.
Beer, C., Reichstein, M., Tomelleri, E., Ciais, P., Jung, M., Carval-hais, N., Rodenbeck, C., Arain, M. A., Baldocchi, D. D., Bo-nan, G. B., Bondeau, A., Cescatti, A., Lasslop, G., Lindroth, A., Lomas, M., Luyssaert, S., Margolis, H., Oleson, K. W., Roup-sard, O., Veenendaal, E., Viovy, N., Williams, C., Woodward, F. I., and Papale, D.: Terrestrial Gross Carbon Dioxide Uptake: Global Distribution and Covariation with Climate, Science, Sci-ence, 329(5993), 834–838, doi:10.1126/science.1184984, 2010. Chen, B., Black, T. A., Coops, N. C., Hilker, T., Trofymow, J.
cli-matology and scaling between remotely sensed and eddy covari-ance measurements, Bound.-Lay. Meteorol., 130, 137–167, doi: 10.1007/s10546-008-9339-1, 2009.
Cheng, Y.-B., Middleton, E. M., Hilker, T., Coops, N. C., Black, T. A., and Krishnan, P.: Dynamics of spectral bio-indicators and their correlations with light use efficiency using directional observations at a Douglas-fir forest, Meas. Sci. Technol., 20, 095107, doi:10.1088/0957-0233/20/9/095107, 2009.
Coops, N. C., Jassal, R., Leuning, R., Black, A. T., and Morgen-stern, K.: Incorporation of a soil water modifier into MODIS predictions of temperate Douglas-fir gross primary productivity: Initial model development, Agr. Forest Meteorol., 147, 99–109, doi:10.1016/j.agrformet.2007.07.001, 2007.
Coops, N. C., Hilker, T., Hall, F. G., Nichol, C. J., Drolet, G. G., Nov. 2010. Estimation of Light-use Efficiency of Terrestrial Ecosystems from Space: A Status Report. BioScience, 60(10), 788–797.
Drolet, G., Middleton, E. M., Huemmrich, K. F., Hall, F., Amiro, B., Barr, A., Black, T., McCaughey, J., and Margolis, H.: Regional mapping of gross light-use efficiency using MODIS spectral indices, Remote Sens. Environ., 112, 3064–3078, doi: 10.1016/j.rse.2008.03.002, 2008.
Drolet, G. G., Huemmrich, K. F., Hall, F. G., Middleton, E. M., Black, T. A., Black, T., Barr, A., Barr, A. A., and Margolis, H.: A MODIS-derived photochemical reflectance index to detect inter-annual variations in the photosynthetic light-use efficiency of a boreal deciduous forest, Remote Sens. Environ., 98, 212–224, doi:10.1016/j.rse.2005.07.006, 2005.
Gamon, J. A., Pe˜nuelas, J., and Field, C.: A narrow-waveband spec-tral index that tracks diurnal changes in photosynthetic efficiency, Remote Sens. Environ., 41, 35–44, 1992.
Gamon, J. A., Filella, I., Pe˜nuelas, J.: The dynamic 531-Nanometer reflectance signal: a survey of twenty angiosperm species, Am. Soc. Plant Physiol., 172–177, 1993.
Gamon, J. A., Field, C. B., Goulden, M. L., and Griffin, K. L.: Rela-tionships Between NDVI, Canopy Structure, and Photosynthesis in Three Californian Vegetation Types, Ecol. Soc. Am., 5(1), 28– 41, 1995.
Garbulsky, M. F., Pe˜nuelas, J., Papale, D., and Filella, I.: Remote estimation of carbon dioxide uptake by a Mediterranean forest, Global Change Biol., 14, 2860–2867, doi:10.1111/j.1365-2486. 2008.01684.x, 2008.
Garbulsky, M. F., Pe˜nuelas, J., Papale, D., Ard¨o, J., Goulden, M. L., Kiely, G., Richardson, A. D., Rotenberg, E., Veenendaal, E. M., and Filella, I.: Patterns and controls of the variability of radiation use efficiency and primary productivity across ter-restrial ecosystems, Global Ecol. Biogeogr., 19, 253–267, doi: 10.1111/j.1466-8238.2009.00504.x, 2010.
Garbulsky, M. F., Pen ?uelas, J., Gamon, J., Inoue, Y., Filella, I.: The photochemical reflectance index (PRI) and the remote sens-ing of leaf, canopy and ecosystem radiation use efficiencies: A review and meta-analysis, Remote Sens. Environ., 115(2), 281– 297, doi:10.1016/j.rse.2010.08.023, 2011
Goerner, A., Reichstein, M., and Rambal, S.: Tracking seasonal drought effects on ecosystemlight use efficiency with satellite-based PRI in a Mediterranean forest, Remote Sens. Environ., 113, 1101–1111, doi:10.1016/j.rse.2009.02.001, 2009.
Grace, J., Nichol, C. J., Disney, M., Lewis, P., Quaife, T., and Bowyer, P.: Can we measure terrestrial photosynthesis from
space directly, using spectral reflectance and fluorescence?, Global Change Biol., 13, 1484–1497, doi:10.1111/j.1365-2486. 2007.01352.x, 2007.
Guglielmetti, M., Schwank, M., Matzler, C., Oberdorster, C., Van-derborght, J., and Fluhler, H.: FOSMEX: Forest Soil Moisture Experiments With Microwave Radiometry, IEEE T. Geosci. Re-mote., 46, 727–735, doi:10.1109/TGRS.2007.914797, 2008. Hall, F. G., Hilker, T., Coops, N. C., Lyapustin, A., Huemmrich,
K. F., Middleton, E. M., Margolis, H. A., Drolet, G. G., and Black, T. A.: Multi-angle remote sensing of forest light use ef-ficiency by observing PRI variation with canopy shadow frac-tion. Remote Sens. Environ. 112(7), 3201–3211, doi:10.1016/j. rse.2008.03.015, 2008.
Heinsch, F. A., Reeves, M., Votava, P., Kang, S., Milesi, C., Zhao, M., Glassy, J., Jolly, W. M., Loehman, R., Bowker, C. F., Kim-ball, J. S., Nemani, R. R., and Running, S. W.: Users Guide GPP and NPP (MOD17A2/A3) Products NASA MODIS Land Algo-rithm, 2003.
Heinsch, F. A., Zhao, M., Running, S. W., Kimball, J. S., Ne-mani, R. R., Davis, K. J., Bolstad, P. V., Cook, B. D., Desai, A. R., Ricciuito, D. M., Law, B. E., Oechel, W. C., Kwon, H. J., Luo, H., Wofsy, S. C., Dunn, A. L., Munger, J. W., Bal-docchi, D. D., Xu, L., Hollinger, D. Y., Richardson, A. D., Stoy, P. C., Siqueira, M. B., Monson, R. K., Burns, S. P., and Flanagan, L. B.: Evaluation of remote sensing based terrestrial productivity from MODIS using regional tower eddy flux net-work observations, IEEE T. Geosci. Remote, 44, 1908–1925, doi:10.1109/TGRS.2005.853936, 2006.
Hilker, T., Coops, N. C., Black, T. A., Wulder, M. A., and Guy, R. D.: The use of remote sensing in light use efficiency based models of gross primary production: A review of current sta-tus and future requirements, Sci. Total Environ., 404, 411–423, 2008a.
Hilker, T., Coops, N. C., Hall, F. G., Black, T. A., Chen, B., Krishnan, P., Wulder, M. A., Sellers, P. J., Middleton, E. M., and Huemmrich, K. F.: A modeling approach for upscaling gross ecosystem production to the landscape scale using re-mote sensing data, J. Geophys. Res., 113, 1–15, doi:10.1029/ 2007JG000666, 2008b.
Hilker, T., Coops, N. C., Black, T. A., Wulder, M. A., Guy, R. D.: The use of remote sensing in light use efficiency based mod-els of gross primary production: A review of current status and future requirements, Sci. Total Environ., 404, 411–423, doi: doi:10.1016/j.scitotenv.2007.11.007, 2008.
Hilker, T., Lyapustin, A., Hall, F. G., Wang, Y., Coops, N. C., Dro-let, G. G., and Black, T. A.: An assessment of photosynthetic light use efficiency from space: Modeling the atmospheric and directional impacts on PRI reflectance, Remote Sens. Environ., 113(11), 2463–2475, 2009.
Horn, J. E. and Schulz, K.: Identification of a general light use efficiency model for gross primary production, Biogeosciences Discuss., 7, 7673–7726, doi:10.5194/bgd-7-7673-2010, 2010. Kanniah, K., Beringer, J., Hutley, L., Tapper, N., and Zhu, X.:
Eval-uation of Collections 4 and 5 of the MODIS Gross Primary Pro-ductivity product and algorithm improvement at a tropical sa-vanna site in northern Australia, Remote Sens. Environ., 113, 1808–1822, doi:10.1016/j.rse.2009.04.013, 2009.
water relations in a savanna ecosystem in South Africa, Biogeo-sciences, 5, 1797–1808, doi:10.5194/bg-5-1797-2008, 2008. Leuning, R., Cleugh, H., Zegelin, S., and Hughes, D.: Carbon and
water fluxes over a temperate forest and a tropical wet/dry sa-vanna in Australia: measurements and comparison with MODIS remote sensing estimates, Agr. Forest Meteorol., 129, 151–173, doi:10.1016/j.agrformet.2004.12.004, 2005.
Louis, J., Aurela, M., Ounis, A., Ducruet, J., Evain, S., Laurila, T., Thum, T., Wingsle, G., Alonso, L., and Pedros, R.: Remote sens-ing of sunlight-induced chlorophyll fluorescence and reflectance of Scots pine in the boreal forest during spring recovery, Remote Sens. Environ., 96, 37–48, doi:10.1016/j.rse.2005.01.013, 2005. Lyapustin, A. and Wang, Y.: The Time Series Technique for Aerosol Retrievals Over Land from MODIS, in: Satellite Aerosol Re-mote Sensing over Land, edited by: Kokhanovsky, A. A. and de Leeuw, G., Springer, Springer Berlin Heidelberg, Germany,
chap. 3, 69–99, doi:10.1007/978-3-540-69397-0\3, 2009.
Maselli, F., Papale, D., Puletti, N., Chirici, G., and Corona, P.: Com-bining remote sensing and ancillary data to monitor the gross productivity of water-limited forest ecosystems, Remote Sens. Environ., 113, 657–667, doi:10.1016/j.rse.2008.11.008, 2009. McCallum, I., Wagner, W., Schmullius, C., Shvidenko, A.,
Ober-steiner, M., Fritz, S., and Nilsson, S.: Satellite-based terres-trial production efficiency modeling, Carbon balance and man-agement, 4(8), http://www.cbmjournal.com/content/4/1/8, doi: 10.1186/1750-0680-4-8, 2009.
McCallum, I., Wagner, W., Schmullius, C., Shvidenko, A., Ober-steiner, M., Fritz, S., and Nilsson, S.: Comparison of four global FAPAR datasets over Northern Eurasia for the year 2000, Re-mote Sens. Environ., 114, 941–949, doi:10.1016/j.rse.2009.12. 009, 2010.
Meroni, M., Rossini, M., Guanter, L., Alonso, L., Rascher, U., Colombo, R., Moreno, J.: Remote sensing of solar-induced chlorophyll fluorescence: Review of methods and applications, Remote Sens. Environ., 113(10), 2037–2051, doi:10.1016/j.rse. 2009.05.003, 2009.
Middleton, E. M., Cheng, Y.-B., Hilker, T., Black, T. A., Krishnan, P., Coops, N. C., and Huemmrich, K. F.: Linking foliage spectral responses to canopy-level ecosystern photosynthetic Iight-use ef-ficiency at a Douglas-fir forest in Canada, Can. J. Remote Sens., 35, 166–188, 2009.
Monteith, J. L.: Solar Radiation and Productivity in Tropical Ecosystems, J. Appl. Ecol., 9, 747–766, 1972.
Myneni, R. B., Hall, F. G., Sellers, P. J., and Marshak, A. L.: The interpretation of spectral vegetation indexes, IEEE T. Geosci. Re-mote, 33, 1–5, 1995.
Nichol, C. J., Huemmrich, K. F., Black, T. A., Jarvis, P. G., Walthall, C. L., Grace, J., and Hall, F. G.: Remote sensing of photosynthetic-light-use efficiency of boreal forest, Agr. Forest Meteorol., 101, 131–142, doi:10.1016/S0168-1923(99)00167-7, 2000.
Nichol, C. J., Lloyd, J., Shibistova, O., Arneth, A., Roser, C., Knohl, A., Matsubara, S., and Grace, J.: Remote sensing of photosynthetic-light-use efficiency of a Siberian boreal forest, Tellus B, 54, 677–687, doi:10.1034/j.1600-0889.2002.01347.x, 2002.
Papale, D., Reichstein, M., Aubinet, M., Canfora, E., Bernhofer, C., Kutsch, W., Longdoz, B., Rambal, S., Valentini, R., Vesala, T., and Yakir, D.: Towards a standardized processing of Net
Ecosys-tem Exchange measured with eddy covariance technique: algo-rithms and uncertainty estimation, Biogeosciences, 3, 571–583, doi:10.5194/bg-3-571-2006, 2006.
Pe˜nuelas, J., Filella, I., and Gamon, J. A.: Assessment of Photosyn-thetic Radiation-Use Efficiency with Spectral Reflectance, New Phytol., 131, 291–296, 1995.
Rahman, A. F., Gamon, J. A., Fuentes, D. A., Roberts, D. A., and Prentis, D.: Modeling spatially distributed ecosystemflux of boreal forest usinghyperspectralindicesfrom AVIRIS imagery, J. Geophys. Res., 106, 33579–33591, 2001.
Rahman, A. F., Cordova, V. D., Gamon, J. A., Schmid, H. P., and Sims, D. A.: Potential of MODIS ocean bands for estimating
CO2flux from terrestrial vegetation: A novel approach,
Geo-phys. Res. Lett., 31, L10503, doi:10.1029/2004GL019778, 2004. Rambal, S., Ourcival, J.-M., Joffre, R., Mouillot, F., Nouvellon, Y., Reichstein, M., and Rocheteau, A.: Drought controls over con-ductance and assimilation of a Mediterranean evergreen ecosys-tem: scaling from leaf to canopy, Global Change Biol., 9, 1813– 1824, doi:10.1046/j.1529-8817.2003.00687.x, 2003.
Reichstein, M., Falge, E., Baldocchi, D. D., Papale, D., Aubi-net, M., Berbigier, P., Bernhofer, C., Buchmann, N., Gilmanov, T., Granier, A., Gr¨unwald, T., Havr´ankov´a, K., Ilvesniemi, H., Janous, D., Knohl, A., Laurila, T., Lohila, A., Loustau, D., Mat-teucci, G., Meyers, T., Miglietta, F., Ourcival, J.-M., Pumpanen, J., Rambal, S., Rotenberg, E., Sanz, M. J., Tenhunen, J. D., Seufert, G., Vaccari, F., Vesala, T., Yakir, D., and Valentini, R.: On the separation of net ecosystem exchange into assimila-tion and ecosystem respiraassimila-tion: review and improved algorithm, Global Change Biol., 11, 1424–1439, doi:10.1111/j.1365-2486. 2005.001002.x, 2005.
Running, S. W. and Nemani, R. R.: Relating seasonal patterns of the AVHRR vegetation index to simulated photosynthesis and tran-spiration of forests in different climates, Remote Sens. Environ., 24, 347–367, doi:10.1016/0034-4257(88)90034-X, 1988. Running, S. W., Thornton, P. E., Nemani, R. R., and Glassy, J. M.:
Global terrestrial gross and net primary productivity from the Earth Observing System, in: Methods in Ecosystem Science, edited by: Sala, O., Jackson, R., and Mooney, H., Springer, New York, USA, 44–57, 2000.
Schmid, H. P., Grimmond, S. B., Cropley, F., Offerle, B., and Su,
H.-B.: Measurements of CO2 and energy fluxes over a mixed
hardwood forest in the mid-western United States, Agr. Forest Meteorol., 103, 357–374, doi:10.1016/S0168-1923(00)00140-4, 2000.
Scholes, R. J., Gureja, N., Giannecchinni, M., Dovie, D., Wilson, B., Davidson, N., Piggott, K., McLoughlin, C., Van Der Velde, K., Freeman, A., Bradlay, S., Smart, R., and Ndala, S.: The environment and vegetation of the flux measurement site near Skukuza, Kruger National Park, Koedoe, 44, 73–83, 2001. Schulze, E.-D.: Biological control of the terrestrial carbon sink,
Biogeosciences, 3, 147–166, doi:10.5194/bg-3-147-2006, 2006. Sims, D. A. and Gamon, J. A.: Relationships between leaf pigment content and spectral reflectance across a wide range of species, leaf structures and developmental stages, Remote Sens. Environ., 81, 337–354, doi:10.1016/S0034-4257(02)00010-X, 2002. Stylinski, C. D., Gamon, J. A., Oechel, W. C.: Seasonal patterns