Ann. Geophys., 31, 805–816, 2013 www.ann-geophys.net/31/805/2013/ doi:10.5194/angeo-31-805-2013
© Author(s) 2013. CC Attribution 3.0 License.
EGU Journal Logos (RGB)
Advances in
Geosciences
Open Access
Natural Hazards
and Earth System
Sciences
Open AccessAnnales
Geophysicae
Open AccessNonlinear Processes
in Geophysics
Open AccessAtmospheric
Chemistry
and Physics
Open AccessAtmospheric
Chemistry
and Physics
Open Access DiscussionsAtmospheric
Measurement
Techniques
Open AccessAtmospheric
Measurement
Techniques
Open Access DiscussionsBiogeosciences
Open Access Open Access
Biogeosciences
DiscussionsClimate
of the Past
Open Access Open Access
Climate
of the Past
Discussions
Earth System
Dynamics
Open Access Open Access
Earth System
Dynamics
DiscussionsGeoscientific
Instrumentation
Methods and
Data Systems
Open Access
Geoscientific
Instrumentation
Methods and
Data Systems
Open Access DiscussionsGeoscientific
Model Development
Open Access Open Access
Geoscientific
Model Development
DiscussionsHydrology and
Earth System
Sciences
Open AccessHydrology and
Earth System
Sciences
Open Access DiscussionsOcean Science
Open Access Open Access
Ocean Science
Discussions
Solid Earth
Open Access Open Access
Solid Earth
DiscussionsOpen Access Open Access
The Cryosphere
Natural Hazards
and Earth System
Sciences
Open Access
Discussions
GPS phase scintillation and proxy index at high latitudes during a
moderate geomagnetic storm
P. Prikryl1, R. Ghoddousi-Fard2, B. S. R. Kunduri3, E. G. Thomas3, A. J. Coster4, P. T. Jayachandran5, E. Spanswick6, and D. W. Danskin7
1Communications Research Centre, Ottawa, ON, Canada
2Geodetic Survey Division, Natural Resources Canada, Ottawa, ON, Canada
3Bradley Department of Electrical and Computer Engineering, Virginia Tech, Blacksburg, VA, USA 4Haystack Observatory, Massachusetts Institute of Technology, Westford, MA, USA
5Physics Dept, University of New Brunswick, Fredericton, NB, Canada 6Department of Physics and Astronomy, University of Calgary, AB, Canada 7Geomagnetic Laboratory, Natural Resources Canada, Ottawa, ON, Canada Correspondence to: P. Prikryl ([email protected])
Received: 20 December 2012 – Revised: 5 April 2013 – Accepted: 8 April 2013 – Published: 6 May 2013
Abstract. The amplitude and phase scintillation indices are customarily obtained by specialised GPS Ionospheric Scintillation and TEC Monitors (GISTMs) from L1 signal recorded at the rate of 50 Hz. The scintillation indicesS4and σ8 are stored in real time from an array of high-rate scin-tillation receivers of the Canadian High Arctic Ionospheric Network (CHAIN). Ionospheric phase scintillation was ob-served at high latitudes during a moderate geomagnetic storm (Dst= −61 nT) that was caused by a moderate solar wind plasma stream compounded with the impact of two coro-nal mass ejections. The most intense phase scintillation (σ8 ∼1 rad) occurred in the cusp and the polar cap where it was co-located with a strong ionospheric convection, an extended tongue of ionisation and dense polar cap patches that were observed with ionosondes and HF radars. At sub-auroral lat-itudes, a sub-auroral polarisation stream that was observed by mid-latitude radars was associated with weak scintilla-tion (defined arbitrarily asσ8<0.5 rad). In the auroral zone, moderate scintillation coincided with auroral breakups ob-served by an all-sky imager, a riometer and a magnetometer in Yellowknife. To overcome the limited geographic cover-age by GISTMs other GNSS data sampled at 1 Hz can be used to obtain scintillation proxy indices. In this study, a phase scintillation proxy index (delta phase rate, DPR) is obtained from 1-Hz data from CHAIN and other GPS re-ceivers. The 50-Hz and 1-Hz phase scintillation indices are correlated. The percentage occurrences ofσ8>0.1 rad and
DPR>2 mm s−1, both mapped as a function of magnetic lat-itude and magnetic local time, are very similar.
Keywords. Ionosphere (Ionospheric irregularities) – Mag-netospheric physics (Storms and substorms) – Radio science (Space and satellite communication)
1 Introduction
The high-latitude ionosphere dynamics is largely driven by coupling processes between the solar wind and the Earth’s magnetic field and can be viewed as footprints in the iono-sphere. These include ionospheric convection, energetic par-ticle precipitation causing auroras, and ionospheric irregu-larities of various scale sizes. The ionospheric irreguirregu-larities cause rapid fluctuations of radio signal amplitude and phase, called scintillation, which can affect the performance of radio communication and navigation systems.
Scintillation indices,S4andσ8, are widely used as a mea-sure of amplitude and phase scintillation, respectively (Basu et al., 1985; Du et al., 2001; Kintner et al., 2007; B´eniguel et al., 2009; Spogli et al., 2009; Prikryl et al., 2011). The S4-index is the standard deviation of the received power nor-malised by its mean value, and the phase scintillation index σ8 is the standard deviation of the detrended L1 phase us-ing a filter in the receiver with a cutoff frequency. These in-dices are usually obtained from high-rate (typically 50 Hz)
Fig. 1. Canadian High Arctic Ionospheric Network (CHAIN) com-plemented by other GPS receivers recording at sampling rate of 1 Hz. Fields of view of an all-sky imager in Yellowknife and Su-perDARN radars in Rankin Inlet and Christmas Valley East with beams 6 and 3, respectively, are shown. Locations of other Super-DARN radars are indicated by diamonds. The corrected geomag-netic (CGM) latitudes 70 and 80◦, in yellow, are superposed over the geographic grid in dotted line.
data obtained by specialised GPS Ionospheric Scintillation and TEC Monitors (GISTMs), which provide only sparse ge-ographic coverage at present. The TEC rate can be used as an index to monitor ionospheric irregularities (see e.g., Pi et al., 1997; Beach and Kintner, 1999; Jakowski et al., 2012). S4scintillation index proxies have been used at low latitudes (Du et al., 2001; Dandekar and Groves, 2004). In this paper, a proxy forσ8is obtained from GPS receivers recording 1-Hz data to complement availability ofσ8that is often enhanced at high latitudes (Prikryl et al., 2011, 2013).
Observations of response in the northern high-latitude ionosphere to a moderate geomagnetic storm are presented. A variety of data are collected with an array of instruments, including HF radars, ionosondes, riometers, magnetometers, and an all-sky imager, to support a network of GPS receivers. The most intense scintillation was observed in the cusp and the polar cap, associated with a tongue of ionisation (TOI), while moderate-to-weak scintillation was associated with au-roral breakups and a sub-auau-roral polarisation stream (SAPS).
KUUJ 55.28 282.25 PICL 51.48 269.84 VALD 48.10 282.44 HLFX 44.68 296.39 ALGO 45.96 281.93 CHUR 58.76 265.91 EUR2 79.99 274.06 FRDN 45.93 293.34 NRC1 45.45 284.38 PRDS 50.87 245.71 SCH2 54.83 293.17 STJO 47.60 307.19 WHIT 60.75 224.78 WINN 49.01 262.74 YELL 62.48 245.52 ALBH 48.39 236.51 DR2O 49.32 240.37 DUBO 50.26 264.13 FLIN 54.73 258.02 NANO 49.29 235.91 SASK 52.20 253.60 PMTL 45.56 286.48 IQAL 63.76 291.49 BAMF 48.84 234.86 PTAL 49.26 235.14 PTRF 48.54 235.59 SC04 48.92 36.30
2 Instruments and methods
At the time of the data studied, the Canadian High Arctic Ionospheric Network (CHAIN) (Jayachandran et al., 2009) consisted of ten specialised GPS receivers and six Cana-dian Advanced Digital Ionosondes (CADIs) distributed in the auroral oval and the polar cap (Fig. 1). The locations of CHAIN stations that are shown at chain.physics.unb.ca are also included in Table 1. The receivers are the GISTM GSV 4004B (Van Dierendonck and Arbesser-Rastburg, 2004). A GISTM consists of a NovAtel OEM4 dual frequency receiver with special firmware specifically configured to measure and record power and phase of the GPS L1 signal at high sam-pling rate (50 Hz). The GSV 4004B can also automatically compute and record S4 andσ8 indices; one-minute values are used in this paper. Each receiver is capable of tracking and reporting scintillation and total electron content (TEC) measurements simultaneously from up to 10 GPS satellites in view.
[image:2.595.317.535.81.351.2]DPR= n P i=0 ψi n (1) where
ψi= ϕti+1
g −ϕgti
ti+1−ti (2)
where ti and ti+1 are two consecutive epochs and ϕg= λ1L1−λ2L2whereL1andL2are the GPS carrier phase mea-surements, andλ1andλ2are their respective wavelengths.
For direct comparison between the one-minute phase scin-tillation indexσ8and DPR proxy index we use the absolute value of DPR over 60 s (n=60). Because of the undersam-pling at 1 Hz, this proxy index does not capture the rapid changes of the phase and, therefore, is not valid for strong scintillation (Rino, 1979; Yeh and Liu, 1982).
Solar wind data were obtained from the Goddard Space Flight Center Space Physics Data Facility OMNIWeb (http: //omniweb.gsfc.nasa.gov/). Solar wind magnetic field and plasma parameters from OMNIWeb dataset combine avail-able solar wind monitor data projected to the nose of the Earth’s bow shock. To identify geo-effective interplanetary coronal mass ejections (ICMEs) we use a catalogue of near-Earth ICMEs (Richardson and Cane, 2010) that is updated at http://www.srl.caltech.edu/ACE/ASC/DATA/level3.
The GISTM arrays are supported by radars, optical instru-ments and magnetometers of the Canadian Geospace Mon-itoring (CGSM) programme (Liu, 2005) and magnetome-ter data provided by NRCan Geomagnetic Laboratory (http: //www.spaceweather.ca). The Northern Solar Terrestrial Ar-ray (NORSTAR) (Donovan et al., 2003) is an optical and radio facility designed to remotely sense auroral precipita-tion on a continental scale. NORSTAR consists of CCD-based All-Sky Imagers (ASIs), Meridian Scanning Photome-ters (MSPs), and riomePhotome-ters.
The Super Dual Auroral Radar Network (SuperDARN) is a network of coherent-backscatter HF radars with a collective field-of-view that covers a large fraction of the high-latitude ionosphere (Greenwald et al., 1995; Chisham et al., 2007). The radars transmit at frequencies 8–20 MHz along 16–24 contiguous, successively swept azimuthal beams, each of which is gated into 75–115 range bins. The bins are typically 45 km long in standard operations, and the dwell time for each beam is usually 3 or 7 s. A full 16-beam scan with suc-cessive beams separated by 3.24◦ covers∼52◦ in azimuth every 1 or 2 min. Several quantities including the line-of-sight Doppler velocity, spectral width and backscatter power from field-aligned ionospheric (FAI) plasma irregularities are routinely measured. The PolarDARN component of Super-DARN covers a large portion of the polar ionosphere in the Northern Hemisphere. The mid-latitude component of Su-perDARN has been expanded since 2009 owing to NSF-funded construction of several radars under the Mid-Sized
Infrastructure (MSI) programme (see, e.g., Clausen et al., 2012). By the time of the radar data that are presented in this paper were collected, the mid-latitude SuperDARN cov-erage reached across North America in an unbroken chain of interlocking radar field-of-view.
The GPS TEC maps are obtained using the plotting tools (Thomas et al., 2013) available online (http://vt.superdarn. org) with the TEC data downloaded from the Madrigal database. The Madrigal database system is an open-source project based at MIT Haystack Observatory. It is a robust World Wide Web based system, capable of managing and serving archival and real-time data, in a variety of formats, from a wide range of upper atmospheric science instruments. It allows for data files to be easily exchanged between sites, although data at each Madrigal site is locally controlled and can be updated at any time, but shared metadata between Madrigal sites allow searching of all Madrigal sites at once. It is used by most incoherent scatter radar facilities around the world to allow access to their data over the web. Built into Madrigal are a large number of web services designed for atmospheric scientists, such as field line tracing and sim-ple access to geophysical parameters. GPS processing tools have also been developed at MIT Haystack that allow for au-tomated processing of total electron content data from more than 2000 GPS receivers available online.
The TEC data are stored in the Madrigal data base in 1 de-gree by 1 dede-gree by 5 min bins where data are available. The TEC data were processed using MIT Automated Processing of GPS (MAPGPS) that has been developed to automate the processing of GPS data into global TEC maps (Rideout and Coster, 2006). A standard spatiotemporal median filtering technique is applied using TEC observations from three in-tervals to generate a single TEC map. The primary modifica-tion involved an improvement in the handling of errors used in the TEC processing. Errors are now tracked throughout the software, and random and correlated receiver bias errors de-scribed above are handled separately. This allows for optimal estimation of binned measurements using weighted averages and allows error values to be calculated independently for each binned measurement. The bin-to-bin variability in the TEC measurements was greatly reduced using this approach.
3 Solar wind conditions and the ionospheric response at high latitudes
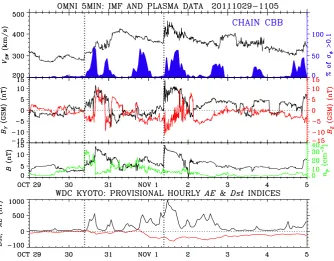
Fig. 2. Solar wind magnetic field and plasma parameters from OMNIWeb dataset. Hourly occurrence ofσ8>0.1 radians from Cambridge Bay is highlighted in blue. Hourly values of AE (black line) and Dst (red line) indices are shown in the bottom panel.
the co-rotating interaction region (CIR) on 30 October. The second upstream shock bounded a sheath of compressed so-lar wind permeated by an oscillation of predominantly south-ward IMFBz.Bpeaked at 14 nT, but then dropped to almost zero (magnetic hole) at 00:00 UT on 2 November followed by relatively constantBof∼4–6 nT.
The first ICME shock, which was associated with a south-ward turning of the IMF, caused the onset of auroral activ-ity and phase scintillation. Figure 2 shows an initial rise in the AE index correlated with an increase in the occurrence of phase scintillation exceeding 0.1 radians at Cambridge Bay, which was located at the poleward edge of the auro-ral oval, and observed scintillation primarily in the cusp. As the IMFBzswitched between southward and northward, the enhancements of AE index and scintillation occurrence were associated with the southward IMF. The arrival of the sec-ond ICME was associated with the strongest southward IMF and resulted in the highest values of AE and phase scintil-lation index. A weak geomagnetic storm from the previous day peaked at∼15:00 UT (Dst= −61 nT) on 1 November. During the storm recovery phase the scintillation occurrence tapered off staying mostly confined to the cusp and the polar cap as shown below.
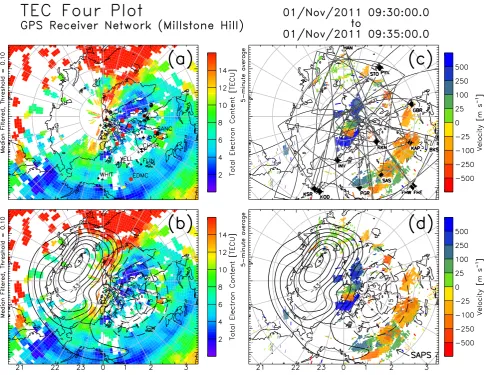
Using the altitude adjusted corrected geomagnetic (AACGM) latitude and magnetic local time (MLT) as co-ordinates, Fig. 3 shows 5-min median-filtered TEC maps (left panels) and mapped HF backscatter line-of-sight ve-locity (right panels). In Fig. 3a, the TEC map is overlaid
with CHAIN stations (red dots), IGS stations (black dots) and ionospheric pierce points (IPPs) at 350-km altitude for cases of phase scintillationσ8 >0.1 radians (open circles) and DPR>2 mm s−1 (crosses). In Fig. 3b, the TEC map is overlaid with the electrostatic potential contours. The drift velocities observed by SuperDARN (Fig. 3d) are used to de-termine a solution for electrostatic potential expressed as a series expansion in spherical harmonics (Ruohoniemi and Baker, 1998). The line-of-sight velocity maps are overlaid with SuperDARN radar fields of view (Fig. 3c), as well as the electrostatic potential contours (Fig. 3d). Magnetic local noon is toward the top and the night MLT hours are shown at the bottom in each plot.
Fig. 3. (a), (b) The 5-min median-filtered TEC mapped in coordinates of CGM latitude and MLT is overlaid (top) with CHAIN (red dots), IGS stations (black dots), IPPs forσ8>0.1 radians (open circles), DPR>2 mm s−1(crosses), and (bottom) the SuperDARN potential map. (c), (d) The SuperDARN line-of-sight (LoS) velocities shown in colour on the CGM-MLT grid are overlaid with radar fields of view and the potential map. Blue indicates motion away from the radar and red towards.
that exceeded 1 radian and was caused by polar cap patches that originated from the TOI. The scintillation was observed from Eureka and Resolute Bay at the edge or inside of the TOI as shown by the IPPs for these two stations that are su-perposed on the TEC map (Fig. 3a).
The ionosondes in Resolute and Eureka observed strong polar patches convecting at velocities reaching up to 1500 m s−1 after the arrival of the second ICME. Figure 4 shows a fixed frequency ionogram at 4 MHz from Resolute Bay. A series of patches identified as U-shaped structures were observed during most of the day. The swept-frequency ionograms (not shown) indicated maximum foF2 values up to ∼7 MHz in the densest patches. During the period of south-ward IMF, horizontal drift velocity azimuth was consistently anti-sunward until∼19:00 UT when the IMF turned north-ward and fluctuated (Fig. 2).
[image:5.595.55.542.61.436.2]Fig. 4. Fixed frequency ionogram and drift velocity from Resolute Bay on 1 November 2011.
consistent with a moderate sub-auroral polarisation stream (SAPS) (Foster and Burke, 2002; Clausen et al., 2012; Kun-duri et al., 2012). Figure 3d shows the SAPS velocities ex-tended along the main trough just south of the radars in Prince George and Saskatoon and adjacent to the CHAIN GPS receiver in Ministik Lake near Edmonton (EDMC in Fig. 1). A weak-to-moderate phase scintillation that was ob-served at the poleward edge of the mid-latitude trough be-tween 06:00 to 12:00 UT is discussed below.
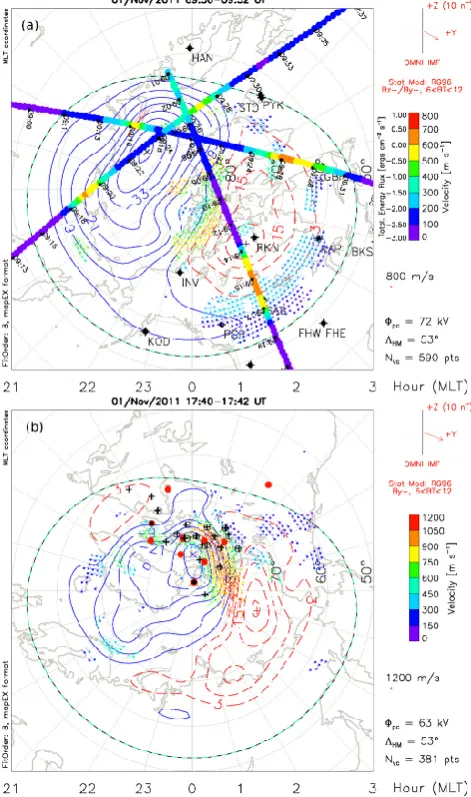
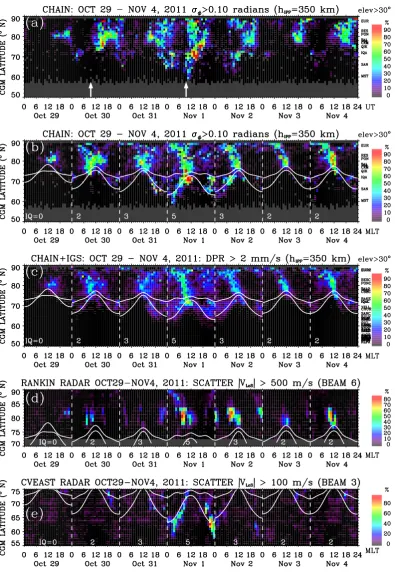
The SuperDARN convection map at 17:40 UT (Fig. 5b) shows very high ionospheric velocities exceeding 1 km s−1 that extended from the cusp deep into the central po-lar cap where TOI caused intense scintillation. CHAIN (red dots) and IGS stations (black dots) along with IPPs where scintillation index σ8>0.1 radians (open circles) and/or DPR>2 mm s−1 (crosses) that were observed be-tween 17:40 and 17:42 UT, are superposed. The most intense scintillation showed values ofσ8 exceeding 1 radian. Fig-ure 6a shows percentage occurrence of phase scintillationσ8 exceeding 0.1 radians in the Canadian Arctic from 29 Octo-ber to 4 NovemOcto-ber, mapped as a function of CGM latitude and universal time (UT) on a grid 1◦×1 h, assuming the iono-spheric pierce points (IPP) at 350 km altitude. Grey areas in-dicate either complete absence or insufficient number of data points for statistically significant scintillation occurrence in a given grid cell (Spogli et al., 2009). The arrows indicate the arrival times of two ICMEs. The phase scintillation oc-currence was significantly enhanced at high latitudes from the auroral oval to polar cap starting on 30 October from ∼11:00 UT and subsided during the recovery phase of the geomagnetic storm.
Figure 6b shows the phase scintillation occurrence maps as a function of magnetic latitude and magnetic local time (MLT) generated for each day separately. The positions of
Fig. 5. SuperDARN convection and potential map showing (a) mod-erate flows in the polar cap and midnight-to-dawn auroral zone, as well as weakened SAPS observed at 09:30 UT overlaid with three passes of POES satellites that observed auroral precipita-tion between 09:00 and 09:35 UT, and (b) fast convecprecipita-tion in the throat region through the cusp where TOI caused intense scin-tillation. CHAIN (red dots) and IGS stations (black dots) along with IPPs where scintillation indexσ8>0.1 radians (open circles) and/or DPR>2 mm s−1 (crosses) were observed between 17:40 and 17:42 UT, are superposed.
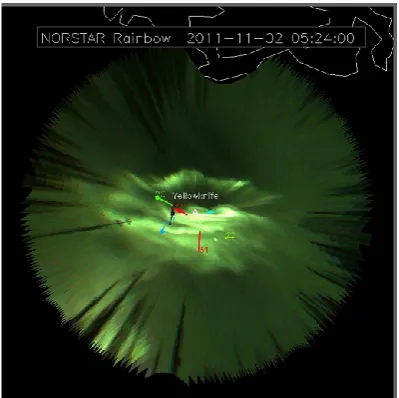
[image:6.595.309.545.66.465.2]Fig. 7. The auroral emission during an auroral breakup mapped on a geographic grid. The IPPs for GPS satellites at elevation angles above 30◦are superposed for one hour starting at 05:00 UT. The altitude of 110 km is assumed for both the auroral emission and IPPs. The dots show IPPs at the time when the image was taken, provided that DPR exceeded 4 mm s−1. The PRNs are shown and colour-coded as in Fig. 8.
Figure 6c shows the occurrence map of DPR exceed-ing 2 mm s−1. These maps are very similar to the occur-rence maps of CHAIN phase scintillationσ8>0.1 radians (Fig. 6b) although the percentages are higher for the latter threshold. To minimise the multipath effect the phase scintil-lation indexσ8and its proxy DPR are obtained for elevations above 30 degrees. Bothσ8and DPR are projected to the ver-tical to account for geometrical effects on the measurements made at different elevation angles (Spogli et al., 2009; see their Eq. 1).
The PolarDARN radar in Rankin Inlet (Fig. 1) observed ionospheric backscatter primarily from F region decameter irregularities in the polar cap (Fig. 3). The occurrence of ionospheric backscatter from irregularities moving at line-of-sight velocityVLOS>500 m s−1for beam 6 is mapped as a function of magnetic latitude and MLT (Fig. 6d). In general, the regions of backscatter coincide with both the TOI and the regions of enhanced scintillation. However, because of var-ied HF propagation conditions and proximity of the Rankin radar to the cusp, strong backscatter that would otherwise co-incided with the strongest scintillation could not be observed by the radar.
The MSI radars in Christmas Valley observed the strongest SAPS on 1 November (Fig. 3). The occurrence of iono-spheric backscatter from irregularities moving at line-of-sight velocityVLOS>100 m s−1for beam 3 of the CV East radar (Fig. 6e) shows a band of high occurrence of sub-auroral backscatter that is very similar to a band of scintilla-tion observed primarily from Ministik Lake near Edmonton
Fig. 8. The meridian scan of auroral intensity as a function of geo-graphic latitude and UT assuming the mapping altitude of 110 km. The IPPs for elevation angles above 30◦ and DPR exceeding 4 mm s−1are superposed.
(MST in Fig. 6b). Weak enhancements in DPR index were also observed by 1-Hz receivers in Whitehorse, Saskatoon and Flin Flon but their contributions to the mapped DPR oc-currence are smoothed out in Fig. 6c due to many other con-tributing receivers distributed over a wide range of longitudes where there was no scintillation and the SAPS may not have been present.
The auroral zone was sparsely populated by CHAIN re-ceivers, but they were complemented by the 1-Hz rere-ceivers, mostly from IGS stations, which provided the proxy scintil-lation index. The scintilscintil-lation in the auroral oval (e.g., Prikryl et al., 2010) is known to be caused primarily by ionospheric irregularities resulting from energetic particle precipitation, which can penetrate deep into the E region and below. In gen-eral, the assumption of an E-region altitude for IPP mapping results in co-location of enhanced scintillation with bright auroras (Prikryl et al., 2010).
On 2 November several auroral breakups were observed with an ASI, a riometer and a magnetometer in Yellowknife between 05:00 and 12:00 UT. Figure 7 shows the broadband auroral intensity mapped with geographic projection assum-ing altitude of 110 km. The superposed line segments show IPPs for GPS satellites at elevation angles above 30◦from the IGS GPS receiver in Yellowknife. The lines have dots where the dots are shown when DPR exceeded a threshold value of 4 mm s◦. The threshold value is doubled to emphasise the close association of the most intense scintillation with auro-ral breakups and bright auroauro-ral arcs. Figure 8 shows a se-ries of meridian scans (a keogram) of the auroral emission as a function of latitude and UT. In general, the scintillation coincided with auroral brightenings although some scintilla-tion persisted even after the aurora moved southward after 08:30 UT.
[image:8.595.312.545.64.185.2]Fig. 9. Phase scintillation proxy index DPR (crosses in colour) for elevations above 30◦,H component of the ground magnetic field and the riometer absorption observed in Yellowknife. Auroral intensity from an approximately 1-km wide pixel in the zenith in relative units is shown in logarithmic scale (green line).
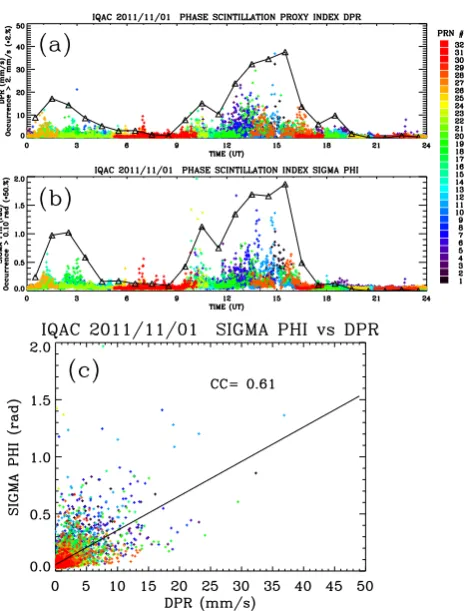
Fig. 10. (a) The proxy DPR index and (b) the 60-s phase scintilla-tionσ8 for Iqaluit on 1 November 2011. The hourly percentage occurrence of both indices exceeding given threshold values are shown by triangles using a scale with a maximum of 100 % as in-dicated by scale factors. (c) Scatter plotσ8versus DPR showing a moderate correlation between the two indices.
zenith (green line). It can be seen that the cosmic noise ab-sorption (in dB) observed by riometers at 30 MHz is a good proxy for precipitating energetic electron fluxes and the au-roral emission. The auau-roral intensity from an approximately 1-km wide pixel in the zenith in relative units is shown us-ing logarithmic scale. The quasi-periodic fluctuations of
ri-ometer absorption after 18:00 UT were caused by daytime ionospheric structure imposed by travelling ionospheric dis-turbances (TIDs) focusing and defocusing the 30 MHz radio waves. Since TIDs are relatively smooth ionospheric struc-tures only very small DPR enhancements between 1 and 2 mm s−1were observed during this time.
4 A comparison betweenσ8and DPR indices
Figure 10a and b show the 60-s values of DPR andσ8, re-spectively, obtained for the CHAIN GPS receiver in Iqaluit on 1 November 2011. The scatter plot (Fig. 10c) shows that individual values ofσ8are moderately correlated with DPR (correlation coefficient of 0.61) and the occurrence of phase scintillation in time and PRN number is generally well rep-resented by the DPR proxy index (Fig. 10a). Also, the oc-currence of DPR>2 mm s−1as a function of magnetic lat-itude and MLT (Fig. 6c) is qualitatively very similar to the occurrence ofσ8>0.1 radians (Fig. 6b). Matching thresh-olds still need to be determined from a larger data sample. The occurrence maps for both indices clearly show the high-est occurrence in the cusp and the polar cap for all days. The scintillation was the strongest in the cusp and the TOI that extended across the polar cap from the dayside to nightside auroral oval on 1 November. Because the ionospheric con-vection pattern strongly depends on the IMFBy(Ruohoniemi and Greenwald, 1996), the orientation of the TOI is also de-termined by theBypolarity. As shown in Fig. 6, TOI is tilted towards pre-noon hours for most of the days (IMFBy>0) except on 29 and 31 October (IMFBy<0).
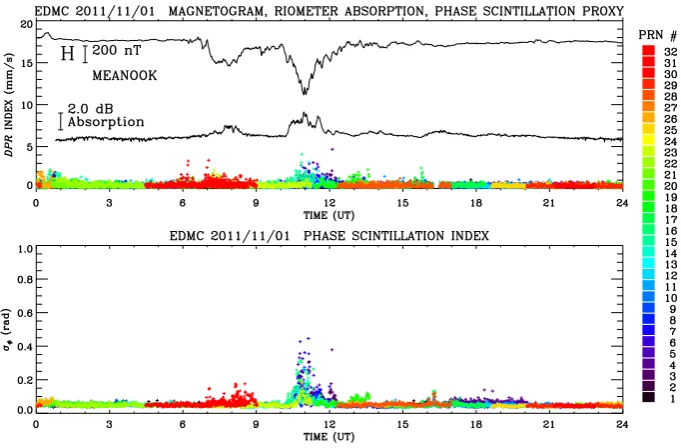
[image:9.595.52.286.238.544.2]Fig. 11. The proxy DPR index and phase scintillationσ8 index obtained for elevations above 30◦ from GPS receiver in Ministik Lake (EDMC) on 1 November 2011. Superposed in the top panel are the riometer absorption and theHcomponent of the ground magnetic field measured at Meanook.
Fig. 12. SuperDARN convection and potential map at 07:04 UT showing the SAPS. The CHAIN stations (red dots) and IGS stations (black dots) with IPPs forσ8>0.1 radians (open circles) and/or DPR>2 mm s−1(crosses) are superposed.
(Prikryl et al., 2011), and where the assumption of IPP alti-tude of 350 km is more appropriate.
At sub-auroral latitudes, scintillation indices are usually not expected to reach high values. However, the southern-most station of Ministik Lake (EDMC) is suitably located to observe scintillation associated with SAPS. On 1 Novem-ber, a moderate SAPS was observed by the mid-latitude
Su-perDARN radars (Fig. 3) just south of EDMC receiver that observedσ8 values exceeding 0.4 radians. A band of weak scintillation occurrence was mapped (Fig. 6b) adjacent to the radar backscatter from fast drifting F-region irregulari-ties (Fig. 6e) just outside of the equatorward border of auro-ral oval. A couple of 1-Hz GPS receivers around the EDMC region also observed weak enhancements of DPR.
Figure 11 shows the phase scintillationσ8 and DPR in-dex obtained for elevations above 30◦from EDMC GPS re-ceiver on 1 November 2011. Weak phase scintillation as-sociated with SAPS was observed at the poleward edge of mid-latitude trough (Fig. 3) between 06:00 to 14:00 UT. In general,σ8 and DPR were correlated, although there were instances of weak scintillation indicated by DPR that were not observed inσ8(∼06:10 UT), and instances of low val-ues of σ8 that when DPR was enhanced (∼08:08 UT), as can be seen in Fig. 11. The observed scintillation coin-cided with intervals of perturbed magnetic fieldH compo-nent and riometer absorption monitored at Meanook (north of Edmonton). At 07:04 UT, the SuperDARN convection map (Fig. 12) showed SAPS with convection velocities exceeding 500 m s−1over Edmonton. At this time, the EDMC GPS re-ceiver observed a weak phase scintillation event for PRN 32. Both the phase scintillation index σ8 and its proxy DPR index (Fig. 11) exceeded the thresholds of 0.1 radians and 2 mm s−1, respectively.
[image:10.595.49.284.349.551.2]validate the application of the DPR proxy index. The latter could then be used to extend phase scintillation climatology for years before CHAIN operation, as well as include other geographical regions, but is not valid for the case of strong scintillation. If the scintillation proxy index is obtained for the previous solar cycle it could be used to further refine and validate techniques of probabilistic forecasting of phase scin-tillation (Prikryl et al., 2012).
5 Conclusions
Moderate-to-strong phase scintillation was observed at high latitudes during the impacts of two interplanetary coro-nal mass ejections that resulted in a moderate geomagnetic storm. The scintillation occurrence that was mapped as a function of magnetic latitude and magnetic local time was most intense in the cusp and the polar cap. It coincided with a dense tongue of ionisation (TOI) drawn across the polar cap by intense ionospheric convection, exceeding 1500 m s−1at times. The occurrence maps of phase scintillationσ8and its proxy index DPR above given threshold values were simi-lar, thus testing an application of the DPR proxy index to assess the presence of phase scintillation when and where specialised high-rate scintillation receivers are not available. The scintillation was associated with regions of decameter F-region irregularities within TOI and polar cap patches ob-served by PolarDARN radars and CADI ionosondes. The sub-auroral polarisation stream (SAPS) that was observed with the MSI radars was associated with weak phase scin-tillation, which mapped along the equatorward border of the auroral oval. The auroral scintillation represented by a proxy index was observed during auroral breakups and was likely caused by E-region electron density irregularities produced by energetic particle precipitation.
Acknowledgements. Infrastructure funding for CHAIN was pro-vided by the Canada Foundation for Innovation and the New Brunswick Innovation Foundation. CHAIN and CGSM operation is conducted in collaboration with the Canadian Space Agency (CSA). The magnetometer and riometer operation and data pro-cessing was supported by the Geomagnetic Laboratory, Natural Re-sources Canada. The operation of the SuperDARN radars in the Northern Hemisphere is supported by the funding agencies of the US, Canada, Japan, UK and France. The funding for the opera-tion of PolarDARN radars was provided by the Natural Sciences and Engineering Research Council of Canada (NSERC) and CSA. The authors from Virginia Tech thank the National Science Foun-dation for support under grants AGS-0838219 and AGS-0946900. The authors from MIT Haystack also thank the National Science Foundation for support under grant ATM-0856093. EGT acknowl-edges support provided by the Virginia Space Grant Consortium under a graduate research fellowship. The operation of the Super-DARN radars in the Northern Hemisphere is supported by the fund-ing agencies of US, Canada, UK, France and Japan. International GNSS Service (IGS) and its contributing organisations are thanked
for 1-Hz GPS data. The solar wind data were obtained from God-dard Space Flight Center Space Physics Data Facility OMNIWeb (http://omniweb.gsfc.nasa.gov/).
Topical Editor K. Hosokawa thanks P. J. Cilliers and one anony-mous referee for their help in evaluating this paper.
References
Basu, S., Basu, S., MacKenzie, E., and Whitney, H. E.: Morphology of phase and intensity scintillations in the auroral oval and polar cap, Radio Sci., 20, 347–356, doi:10.1029/RS020i003p00347, 1985.
Beach, T. L. and Kintner P. M.: Simultaneous Global Positioning System observations of equatorial scintillations and total electron content fluctuations, J. Geophys. Res., 104, 22553–22565, 1999. B´eniguel, Y., Adam, J.-P., Jakowski, N., Noack, T., Wilken, V., Valette, J.-J., Cueto, M., Bourdillon, A., LassudrieDuch-esne, P., and Arbesser-Rastburg, B.: Analysis of scintillation recorded during the PRIS measurement campaign, Radio Sci., 44, RS0A30, doi:10.1029/2008RS004090, 2009.
Chisham, G., Lester, M., Milan, S. E., Freeman, M. P., Bristow, W. A., Grocott, A., McWilliams, K. A., Ruohoniemi, J. M., Yeoman, T. K., Dyson, P. L., Greenwald, R. A., Kikuchi, T., Pinnock, M., Rash, J. P. S., Sato, N., Sofko, G. J., Villain J.-P., and Walker, A. D. M.: A decade of the Super Dual Auroral Radar Network (Su-perDARN): Scientific achievements, new techniques and future directions, Survey Geophys., 28, 33–109, doi:10.1007/s10712-007-9017-8, 2007.
Clausen, L. B. N., Baker, J. B. H., Ruohoniemi, J. M., Greenwald, R. A., Thomas, E. G., Shepherd, S. G., Talaat, E. R., Bristow, W. A., Zheng, Y., Coster, A. J., and Sazykin, S.: Large-scale obser-vations of a subauroral polarization stream by midlatitude Super-DARN radars: Instantaneous longitudinal velocity variations, J. Geophys. Res., 117, A05306, doi:10.1029/2011JA017232, 2012. Dandekar, B. S. and Groves, K. M.: Using ionospheric scintillation observations for studying the morphology of equatorial ionospheric bubbles, Radio Sci., 39, RS3010, doi:10.1029/2003RS003020, 2004.
Donovan, E., Trondsen, T., Cogger, L., and Jackel, B.: Auro-ral imaging within the Canadian CANOPUS and NORSTAR projects, Sodankyl¨a Geophysical Observatory Publications, 92, 109–112, 2003.
Du, J., Caruana, J., Wilkinson, P., Thomas, R., and Cervera, M.: Determination of Equatorial Ionospheric Scintillation S4 by Dual Frequency GPS, Beacon Satellite Symposium, 2001.
Evans, D. S. and Greer, M. S.: Polar orbiting environmental satellite space environment monitor 2: Instrument description and archive data documentation, Tech. Memo., OAR SEC-93, NOAA, Boul-der, CO, 2000.
Feldstein, Y. I. and Starkov, G. V.: Dynamics of auroral belt and polar geomagnetic disturbances, Planet. Space Sci., 15, 209–230, 1967.
Foster, J. C. and Burke, W. J.: SAPS: A new categorization for sub-auroral electric fields, Eos Trans. AGU, 83, 393–394, doi:10.1029/2002EO000289, 2002.
S. C., Pokhotelov, D., Hamza, A. M., Mann, I. R., Milling, D. K., Kale, Z. C., Chadwick, R., Kelly, T., Danskin, D. W., and Carrano, C. S.: Canadian High Arctic Ionospheric Network (CHAIN), Radio Sci., 44, RS0A03, doi:10.1029/2008RS004046, 2009.
Kintner, P. M., Ledvina, B. M., and de Paula, E. R.: GPS and ionospheric scintillations, Space Weather, 5, S09003, doi:10.1029/2006SW000260, 2007.
Kunduri, B. S. R., Baker, J. B. H., Ruohoniemi, J. M., Clausen, L. B. N., Grocott, A., Thomas, E. G., Freeman, M. P., and Ta-laat, E. R.: An examination of inter-hemispheric conjugacy in a sub-auroral polarisation stream, J. Geophys. Res., 117, A08225, doi:10.1029/2012JA017784, 2012.
Liu, W. W.: Canadian space environment program and international living with a star, Adv. Space Res., 35, 51–60, 2005.
Pi, X., Mannucci, A. J., Lindqwister, U. J., and Ho, C. M.: Monitor-ing of global ionospheric irregularities usMonitor-ing the worldwide GPS network, Geophys. Res. Lett., 24, 2283–2286, 1997.
Prikryl, P., Jayachandran, P. T., Mushini, S. C., Pokhotelov, D., MacDougall, J. W., Donovan, E., Spanswick, E., and St.-Maurice, J.-P.: GPS TEC, scintillation and cycle slips observed at high latitudes during solar minimum, Ann. Geophys., 28, 1307– 1316, doi:10.5194/angeo-28-1307-2010, 2010.
Prikryl, P., Jayachandran, P. T., Mushini, S. C., and Chadwick, R.: Climatology of GPS phase scintillation and HF radar backscatter for the high-latitude ionosphere under solar minimum conditions, Ann. Geophys., 29, 377–392, doi:10.5194/angeo-29-377-2011, 2011.
Prikryl, P., Jayachandran, P. T., Mushini, S. C., and Richard-son, I. G.: Toward the probabilistic forecasting of high-latitude GPS phase scintillation, Space Weather, 10, S08005, doi:10.1029/2012SW000800, 2012.
Rideout, W. and Coster, A.: Automated GPS processing for global total electron content data, GPS Solutions, 10, 219–228, 2006. Rino, C. L.: A power law phase screen model for ionospheric
scintillation 2. Strong scatter, Radio Sci., 14, 1147–1155, doi:10.1029/RS014i006p01147, 1979.
Ruohoniemi, J. M. and Baker, K. B.: Large-scale imaging of high-latitude convection with Super Dual Auroral Radar Network HF radar observations, J. Geophys. Res., 103, 20797–20811, 1998. Ruohoniemi, J. M. and Greenwald, R. A.: Statistical
pat-terns of high-latitude convection obtained from Goose Bay HF radar observations, J. Geophys. Res., 101, 21743–21763, doi:10.1029/96JA01584, 1996.
Spogli, L., Alfonsi, L., De Franceschi, G., Romano, V., Aquino, M. H. O., and Dodson, A.: Climatology of GPS ionospheric scintil-lations over high and mid-latitude European regions, Ann. Geo-phys., 27, 3429–3437, doi:10.5194/angeo-27-3429-2009, 2009. Thomas, E. G., Baker, J. B. H., Ruohoniemi, J. M., Clausen,
L. B. N., Coster, A. J., Foster, J. C., and Erickson P. J.: Di-rect observations of the role of convection electric field in the formation of a polar tongue of ionization from storm en-hanced density, J. Geophys. Res. Space Physics, 118, 1180– 1189, doi:10.1002/jgra.50116, 2013.
Van Dierendonck, A. J. and Arbesser-Rastburg, B.: Measuring iono-spheric scintillation in the equatorial region over Africa, includ-ing measurements from SBAS geostationary satellite signals, Proceeding of ION GNSS 17th technical meeting of the satellite division, Long Beach, CA, 316, 2004.