University of Warwick institutional repository: http://go.warwick.ac.uk/wrap
This paper is made available online in accordance with
publisher policies. Please scroll down to view the document
itself. Please refer to the repository record for this item and our
policy information available from the repository home page for
further information.
To see the final version of this paper please visit the publisher’s website.
Access to the published version may require a subscription.
Author(s): G. Anzolin, D. de Martino, J.-M. Bonnet-Bidaud, M.
Mouchet, G. Matt, K. Mukai, B. T. Gänsicke
Article Title: Two new intermediate polars with a soft X-ray component
Year of publication: 2008
Link to published article:
http://dx.doi.org/10.1051/0004-6361:200810402
Publisher statement: © ESO 2008. G. Anzolin et al. (2008). Two new
intermediate polars with a soft X-ray component. Astronomy &
DOI:10.1051/0004-6361:200810402
c
ESO 2008
Astrophysics
&
Two new intermediate polars with a soft X-ray component
G. Anzolin
1,2, D. de Martino
2, J.-M. Bonnet-Bidaud
3, M. Mouchet
4, B. T. Gänsicke
5, G. Matt
6, and K. Mukai
71 Dipartimento di Astronomia, Università di Padova, vicolo dell’Osservatorio 3, 35122 Padova, Italy
e-mail:[email protected]
2 INAF – Osservatorio Astronomico di Capodimonte, salita Moiariello 16, 80131 Napoli, Italy
e-mail:[email protected]
3 Service d’Astrophysique, DSM/DAPNIA/SAp CE Saclay, 91191 Gif-sur-Yvette, France
e-mail:[email protected]
4 Laboratoire Astroparticule et Cosmologie, Université Paris 7, 10 rue Alice Domon et Léonie Duquet, 75005 Paris; LUTH,
Observatoire de Paris, Section de Meudon, 5 place Jules Janssen, 92195 Meudon, France e-mail:[email protected]
5 Department of Physics, University of Warwick, Coventry CV4 7AL, UK
e-mail:[email protected]
6 Dipartimento di Fisica, Università degli Studi Roma Tre, via della Vasca Navale 84, 00146 Roma, Italy
e-mail:[email protected]
7 CRESST and X-Ray Astrophysics Laboratory, NASA Goddard Space Flight Center, Greenbelt, MD 20771, USA; Department of
Physics, University of Maryland, Baltimore County, 1000 Hilltop Circle, Baltimore, MD 21250, USA e-mail:[email protected]
Received 17 June 2008/Accepted 30 July 2008
ABSTRACT
Aims.We analyze the first X-ray observations with XMM-Newton of 1RXS J070407.9+262501 and 1RXS 180340.0+401214, in order to characterize their broad-band temporal and spectral properties, also in the UV/optical domain, and to confirm them as intermediate polars.
Methods.For both objects, we performed a timing analysis of the X-ray and UV/optical light curves to detect the white dwarf spin pulsations and study their energy dependence. For 1RXS 180340.0+401214 we also analyzed optical spectroscopic data to determine the orbital period. X-ray spectra were analyzed in the 0.2–10.0 keV range to characterize the emission properties of both sources. Results.We find that the X-ray light curves of both systems are energy dependent and are dominated, below 3–5 keV, by strong pulsations at the white dwarf rotational periods (480 s for 1RXS J070407.9+262501 and 1520.5 s for 1RXS 180340.0+401214). In 1RXS 180340.0+401214 we also detect an X-ray beat variability at 1697 s which, together with our new optical spectroscopy, favours an orbital period of 4.4 h that is longer than previously estimated. Both systems show complex spectra with a hard (temperature up to 40 keV) optically thin and a soft (kT ∼85–100 eV) optically thick components heavily absorbed by material partially covering the X-ray sources.
Conclusions.Our observations confirm the two systems as intermediate polars and also add them as new members of the growing group of “soft” systems which show the presence of a soft X-ray blackbody component. Differences in the temperatures of the blackbodies are qualitatively explained in terms of reprocessing over different sizes of the white dwarf spot. We suggest that systems showing cooler soft X-ray blackbody components also possess white dwarfs irradiated by cyclotron radiation.
Key words.stars: binaries: close – stars: individual: 1RXS J070407.9+262501 – stars: individual: 1RXS 180340.0+401214 – stars: novae, cataclysmic variables – X-rays: stars – accretion, accretion disks
1. Introduction
Intermediate polars (IPs) are a subclass of magnetic cataclysmic variables (CVs) in which the rotational periodPω of the white dwarf (WD) is not synchronized with the orbital periodPΩ of the binary system (Pω PΩ). The detection of a modulation at the WD spin period in the X-ray regime represents a signature of magnetic accretion. The material lost from the secondary star generally passes through a disc and is channelled onto the mag-netic polar regions of the WD where a strong shock develops (Aizu 1973). Hard X-ray radiation is emitted by the hot post-shock gas that cools via thermal bremsstrahlung while it set-tles onto the WD surface. Because of the highly asynchronous
Based on observations obtained with XMM-Newton, an ESA
sci-ence mission with instruments and contributions directly funded by ESA Member States and NASA, and with the Observatoire de Haute Provence (CNRS), France.
WD rotation and of the lack of detectable polarized emission in the optical and near-IR in most systems, IPs were believed to possess weakly magnetized WDs (B ∼0.1−10 MG, Warner 1995). A distinct soft (kT ∼20−50 eV) X-ray blackbody emis-sion was discovered by theROSATsatellite in a handful of IPs (Mason et al. 1992;Haberl et al. 1994;Haberl & Motch 1995; Burwitz et al. 1996), some of them also showing polarized op-tical radiation indicating field strengths up to 20–30 MG (e.g. Piirola et al. 1993,2008). This spectral component resembles that observed in the X-ray spectra of polars, the other subclass of magnetic CVs, that instead possess synchronously rotating and strongly magnetized (B∼10−230 MG) WDs.
Our current understanding of the origin of soft X-ray emis-sion and energy balance in polars has greatly improved since the early model ofLamb & Masters(1979). It has become evident that the soft and hard X-ray emissions in at least these systems are largely decoupled (seeBeuermann 1999,2004), most of the
soft X-rays arising from accretion of dense blobs (“blobby accre-tion”) which penetrate deep in the WD atmosphere. Irradiation of the WD atmospheric polar regions by hard X-rays and cy-clotron radiation emitted in a stand-offshock has been recently discussed byKönig et al.(2006), yelding to the conclusion that most of the reprocessed light appears in the far-UV rather than in the soft X-rays.
The similarity with the polars raised the question on whether the “soft IPs” are the “true” progenitors of low-field polars (see alsoNorton et al. 2004). However, very recently a soft and rather absorbed X-ray component is being found in a growing num-ber of IPs (Haberl et al. 2002;de Martino et al. 2004,2006a,b, 2008;Evans & Hellier 2007;Staude et al. 2008). Whether all IPs possess such a component and whether it balances the primary emission from the post-shock flow is a new aspect that deserves investigation.
Furthermore, in recent years the number of candidate mem-bers of the IP group has grown quite rapidly (Woudt & Warner 2004; Gänsicke et al. 2005) almost doubling the number of previously known systems as well as enlarging the range of asynchronism. While this could suggest an evolution towards synchronism (Norton et al. 2004), the confirmation of new candidates is essential to understand the evolutionary link be-tween IPs and polars.
1RXS J070407.9+262501 (hereafter RX J0704) was listed in the ROSAT All-Sky Survey Source Catalogue (RASS,Voges et al. 1999) as a faint X-ray source, with a count rate of 0.19 cts s−1in the 0.1–2.4 keV PSPC range and ROSAT hardness ratios1HR1=−0.40 and HR2= +0.55 that suggested the pres-ence of a soft component in the X-ray spectrum. RX J0704 was then identified as a CV byGänsicke et al.(2005) and proposed to be an IP from the detection of optical photometric and spec-troscopic periodicities at 480.71 s and∼250 min, respectively. The short period variability was ascribed to the spin period of the WD, while the other was identified as the orbital period of the binary system. The optical light curve folded at the putative WD rotational period was double peaked, suggesting the pres-ence of two equally contributing accreting poles. However, no other X-ray observation was performed on this source in order to study its X-ray properties and hence to confirm its member-ship of the IP class.
1RXS 180340.0+401214 (hereafter RX J1803) was also dis-covered in the RASS as a faint (PSPC count rate 0.18 cts s−1) source with a very soft X-ray spectrum (HR1 = −0.18 and HR2 = −0.02). Later, it was also identified as an IP candidate byGänsicke et al.(2005) from its optical photometric variability at a 1520.5 s period that was interpreted as the rotational period of the accreting WD. A spectroscopic period of 160.2 min was inferred from the analysis of radial velocity variations in the Hα
emission line wings and identified as the binary orbital period, thus placing this CV in the 2–3 h period gap. The two periods would then indicate a system with a weak degree of asynchro-nism. Also for this source no further X-ray observations were available.
In this work we report XMM-Newton observations of RX J0704 and RX1803 aiming at determining for the first time their X-ray variability as well as their X-ray broad-band spectral properties. For RX J1803 we further complement the
1 ROSAT hardness ratios 1 and 2 are defined as HR1 = (0.40−2.40)−(0.07−0.40)
(0.07−2.40) and HR2=
(1.00−2.40)−(0.40−1.00)
(0.40−2.40) , where (A−B) is the
raw count rate in theA−Benergy range expressed in keV (Motch et al. 1996).
XMM-Newton data with optical spectroscopy acquired at the Observatoire de Haute Provence (OHP, France).
2. The observations and data reduction
2.1. The XMM-Newton observations of RX J0704
RX J0704 was observed with the XMM-Newton observatory (Jansen et al. 2001) on October 4, 2006 (OBSID: 0401650101) with the EPIC-pn (Strüder et al. 2001) and MOS (Turner et al. 2001) cameras operating in full frame mode with the medium fil-ter for total exposure times of 10.2 ks and 12.2 ks, respectively. The RGS instruments (den Herder et al. 2001) were operated in spectroscopy mode for an exposure time of 13.9 ks. No useful data were collected with the OM (Mason et al. 2001). Due to a failure of the XMM-Newton mission operation centre system, the exposure was interrupted. RX J0704 was then observed again on March 23, 2007 (OBSID: 0401650301) with the same instru-ment configurations. The OM was operated in fast imaging mode using the UVM2 filter that covers the ultraviolet spectral range 2000–2800 Å. The total exposures were 8.1 ks for EPIC-pn, 9.6 ks for the MOS, 9.9 ks for the RGS and 6.2 ks for the OM. A summary of the observations is reported in Table1. All the raw data have been reprocessed using the standard pipeline pro-cess included in the SAS 7.0 package. EPIC light curves and spectra were extracted using a circular region of 30centred on the source. The same aperture radius was used to extract back-ground light curves and spectra on the same CCD chip of the target. To improve S/N, we selected up to double pixel events with zero quality flag for the pn data, while for the EPIC-MOS cameras we increased the selection level up to quadruple pixel events.
The EPIC data of October 2006 were characterized by a very low and rather constant background level (0.014 cts s−1and 0.002 cts s−1for EPIC-pn and MOS respectively). In order to ob-tain sufficient S/N ratios and useχ2statistics in the spectral anal-ysis, the average EPIC spectra were rebinned to obtain 20 counts in each spectral bin. The photon redistribution matrix and the ancillary region file were created by using the SAS tasksrmfgen
andarfgen. The RGS1 and RGS2 first order spectra are too faint to allow a reliable analysis and, therefore, are not presented in this work.
The March 2007 X-ray data were instead severely plagued by high background radiation for more than half of the duration of the observation. We then windowed the EPIC data to exclude those epochs of high (>0.5 cts s−1) background count rate, leav-ing us with the initial 2.9 ks of useful data, thus losleav-ing∼70% of the whole observation. The extracted EPIC light curves and average spectra were obtained using the same procedure as de-scribed before. Also in this case the RGS data did not provide an useful spectrum. The OM-UVM2 background subtracted light curve binned in 20 s intervals was obtained with the task om-fchain. The average count rate was 0.7 cts s−1, corresponding to an instrumental magnitude UVM2=16.2 and to an average flux of 1.5×10⁻¹⁵erg cm−2s−1Å−1in the 2000–2800 Å band. For a comparison, the continuum flux of the optical spectrum obtained byGänsicke et al.(2005) is∼2.2×10⁻¹⁵ erg cm−2 s−1 Å−1 at 3800 Å.
2.2. The XMM-Newton observations of RX J1803
RX J1803 was observed on August 31, 2007
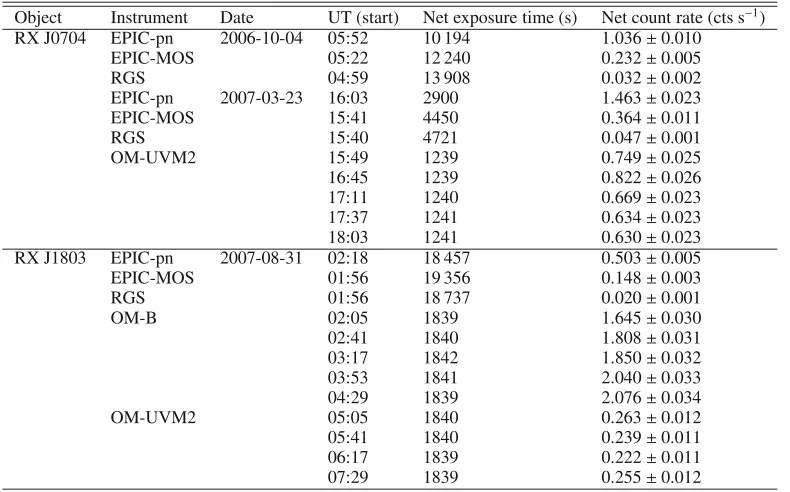
Table 1.Summary of the XMM-Newton observations of RX J0704 and RX J1803.
Object Instrument Date UT (start) Net exposure time (s) Net count rate (cts s−1)
RX J0704 EPIC-pn 2006-10-04 05:52 10 194 1.036±0.010 EPIC-MOS 05:22 12 240 0.232±0.005
RGS 04:59 13 908 0.032±0.002
EPIC-pn 2007-03-23 16:03 2900 1.463±0.023 EPIC-MOS 15:41 4450 0.364±0.011
RGS 15:40 4721 0.047±0.001
OM-UVM2 15:49 1239 0.749±0.025
16:45 1239 0.822±0.026 17:11 1240 0.669±0.023 17:37 1241 0.634±0.023 18:03 1241 0.630±0.023 RX J1803 EPIC-pn 2007-08-31 02:18 18 457 0.503±0.005 EPIC-MOS 01:56 19 356 0.148±0.003
RGS 01:56 18 737 0.020±0.001
OM-B 02:05 1839 1.645±0.030
02:41 1840 1.808±0.031 03:17 1842 1.850±0.032 03:53 1841 2.040±0.033 04:29 1839 2.076±0.034
OM-UVM2 05:05 1840 0.263±0.012
05:41 1840 0.239±0.011 06:17 1839 0.222±0.011 07:29 1839 0.255±0.012
full frame mode and with the thin filter. The total exposure times were 20.0 ks and 21.7 ks for the EPIC-pn and MOS cameras, respectively. Of the two RGS instruments, only RGS1 could acquire data for 21.9 ks, while RGS2 was blocked in a “set-up” mode during the observation. The OM was operated in fast imaging mode using sequentially the UVM2 and B filters, the latter covering the spectral range 3900–4900 Å, for 9.2 ks each (see Table1). The EPIC data were reprocessed and, then, filtered to avoid a flare event that occurred during the initial∼2000 s of the observation. Light curves and spectra were extracted using a radius of 30centered on the source. We also applied similar pixel selection levels as done before for the EPIC-pn and MOS cameras and rebinned the spectra to obtain 25 counts per bin. Also for this source, the RGS1 first order spectrum was too faint to allow useful analysis. Due to a failure in theomfchainroutine of SAS 7.0, OM data were reprocessed at the MSSL using new, yet unreleased, routines. Unfortunately, there was still a processing problem in one of the exposures with the UVM2 filter that cannot be solved. However, we obtained OM-B and OM-UVM2 background subtracted light curve binned in 10 s intervals. The average count rates were 1.88 cts s−1 in the
Bband and 0.24 cts s−1 in theUVM2band. The corresponding instrumental magnitude were B = 18.6 and UVM2 = 17.3,
while the average fluxes were 2.4×10⁻¹⁶erg cm−2s−1Å−1and 5.2×10⁻¹⁶erg cm−2s−1Å−1, respectively.
Heliocentric corrections were applied to the EPIC and OM data of both sources.
2.3. OHP spectroscopy of RX J1803
RX J1803 was observed at the OHP during two nights on June 29 and July 1, 2006 for 4.3 h and 4.22 h, respectively. Long slit spectra were obtained with the Carelec spectrograph (Lemaitre et al. 1990) placed at the Cassegrain focus of the 193 cm tele-scope and using a CCD EEV (2048×1024 pixels) detector with 13.5μm pixel size. A 133 Å/mm grating was used, with a slit width of 2, leading to a wavelength coverage of 3600–7200 Å
at a FWHM resolution of ∼5.7 Å. All exposure times were set at 1520 s, corresponding to the known optical pulsation, to smear any effect from the spin variability. The observations were performed in nearly photometric conditions with seeing typically ranging from 2.5 to 3. We obtained 9 spectra of
RX J1803 each night. Standard reduction was performed with the ESO-MIDAS package, including cosmic rays removal, bias subtraction, flat-field correction and wavelength calibration. The wavelength calibration was checked on sky lines and all radial velocity measurements have been corrected from the small in-strumental shifts measured on the O
i
5577 Å line and from the Earth motion. Times have been converted in the heliocentric sys-tem. Flux calibration has been performed using the standard stars BD+28 4211 and BD+33 2642.3. Analysis and results
3.1. RX J0704
We have analysed the X-ray and UV XMM-Newton data of RX J0704 to search for variability at the optical period as well as to study its broad band spectral properties.
3.1.1. The X-ray variability
Fig. 1.Power spectra of the October 2006 EPIC-pn data of RX J0704 in selected energy ranges.From bottom to top: 0.2–15.0 keV, 0.2–0.5 keV, 0.5–2.0 keV, 2.0–10.0 keV. The spin (ω) frequency, its harmonics and the orbital frequency (Ω) are marked with vertical dotted lines.
curves by using a composite function with up to six sinusoids to account for all the detected harmonics. We let the fundamental frequencyωfree to vary, while the other five frequencies were constrained to be integer multiple values ofω, i.e. 2ω, 3ω, 4ω, 5ωand 8ω. In this way, we foundω=179.88±0.06 day−1for EPIC-pn, 179.7±0.3 day−1for MOS1 and 179.85±0.15 day−1 for MOS2. Because of the higher accuracy of the EPIC-pn data, we adoptPω = 480.3±0.2 s. This value is consistent within
3σwith the optical photometric determination ofGänsicke et al. (2005) and hence can be safely ascribed to the WD rotational period.
Figure2 shows the full band EPIC-pn light curves of both epochs folded at the spin period. The light curves appear very complex and are dominated by two features: a dip, that we ar-bitrarily placed at phase zero, and a bump at phase∼0.15. The dip represents a fiducial marker of the spin pulsation. We hence derive the following times of the dip: HJD=2 454 012.74140(7) for October 2006 and HJD = 2 454 183.17362(5) for March 2007. The spin pulse is more structured in March 2007, espe-cially in the phase range 0.15−0.5. The dip and bump appear to be less defined, while an additional peak can be recognized at φ ∼ 0.4. This latter could also be present in the October 2006 data, but with much lower amplitude.
[image:5.595.49.297.75.330.2]The Fourier analysis was also performed on the October 2006 EPIC-pn light curves extracted with the same 20 s bin-ning time in selected energy bands: 0.2–0.5 keV, 0.5–2.0 keV and 2.0–10.0 keV (see Fig.1). While no sign of variability can be detected above 2.0 keV, significant peaks are evident in the soft band periodograms, where the spin frequency and its first three harmonics are clearly detected. The October 2006 folded light curves are shown in Fig.3. The dip feature is clearly observed below 2 keV but the bump appears only below 0.5 keV. The March 2007 energy dependent light curves confirm the general behaviour observed in October 2006, with no sign of variability above 2 keV and a dip whose depth increases at lower energies.
Fig. 2.Light curves of RX J0704 folded at the 480 s spin period using the times of the dip quoted in the text.Top and central panels: full-band (0.2–15.0 keV) EPIC-pn light curves for October 2006 and March 2007.
Bottom panel: the OM-UVM2 spin pulsation of March 2007 detrended
from the low frequency variability (see text for details).
Fig. 3. RX J0704 data of October 2006. Top panels: EPIC-pn light curves in selected energy ranges folded at the 480 s spin period using the time of the dip quoted in the text.Bottom panel: EPIC-pn hardness ratio in the soft bands.
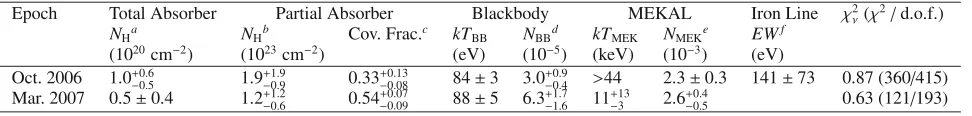
[image:5.595.316.566.396.649.2]Table 2.Spectral parameters of the best-fit model to the EPIC-pn and combined MOS average spectra of RX J0704. Errors indicate the 90% con-fidence level of the relevant parameter. Metal abundance is kept fixed at the solar value (see text).
Epoch Total Absorber Partial Absorber Blackbody MEKAL Iron Line χ2
ν(χ2/d.o.f.)
NHa NHb Cov. Frac.c kTBB NBBd kTMEK NMEKe EWf
(1020cm−2) (1023cm−2) (eV) (10−5) (keV) (10−3) (eV)
Oct. 2006 1.0+0.6
−0.5 1.9+ 1.9
−0.9 0.33+ 0.13
−0.08 84±3 3.0+ 0.9
−0.4 >44 2.3±0.3 141±73 0.87 (360/415)
Mar. 2007 0.5±0.4 1.2+1.2
−0.6 0.54+ 0.07
−0.09 88±5 6.3+ 1.7 −1.6 11+
13 −3 2.6+
0.4
−0.5 0.63 (121/193)
a Column density of the total absorber.b Column density of the partial absorber.c Covering fraction of the partial absorber.d Normalization
constant of the BBODY model.eNormalization constant of the MEKAL model.f Equivalent width of the 6.4 keV iron line.
in phase (Δφ∼0.1), therefore the regions responsible for these features should have a very small extension.
In the lower panel of Fig.3 we also plot the hardness ratio defined as the ratio between the 0.5–2.0 keV and 0.2–0.5 keV count rates (the hardness ratio obtained with the other energy bands does not provide useful information). The count rate ratio of the soft bands is double-humped showing a hardening during the dip as well as atφ ∼0.3−0.5 that corresponds to the “flat” part of the spin pulse. This clearly reflects the presence of the soft bump and the dip.
3.1.2. The UV light curve
The March 2007 OM-UVM2 light curve shows hints of a quasi-sinusoidal modulation on the order of few hours. However, this cannot be quantified because of the short duration of the obser-vation. To better study the short term variability we removed the long term variations from the UV light curve using a third or-der polynomial and folded the residual at the X-ray spin period with the epoch of the dip found for March 2007. As shown in the lower panel of Fig.2, the pulsation is quasi-sinusoidal. A sinu-soidal fit gives the maximum at phase 0.22±0.03, hence partially overlapping the X-ray bump and the additional peak atφ ∼0.4 observed at that epoch, and a modulation fraction of 12±5% (defined as 2A/fave, whereAis the amplitude of the fitted sinu-soid and fave is the average count rate). We also recall that the white light optical pulsation observed byGänsicke et al.(2005) was instead found to be double-humped.
3.1.3. Spectral properties of RX J0704
The October 2006 (Fig.4) and March 2007 average EPIC-pn and combined MOS spectra were analyzed with the XSPEC 12 pack-age in the range 0.3–10.0 keV. A simple model consisting of an absorbed optically thin plasma MEKAL with solar abundances does not adequately fit the spectra. For October 2006 data, a zero-width Gaussian centered at 6.4 keV is also required, al-though the fit is still poor (χ2
ν = 8.8). Both October 2006 and
March 2007 spectra show an excess of counts below 1 keV and the addition of a blackbody (kTBB∼80 eV) drastically improves the fits (χ2
ν = 0.97 and 0.70, respectively). For the October
2006 spectrum, the temperature of the optically thin plasma is unconstrained (kTMEK > 44 keV), while for the March 2007 spectrum it iskTMEK =11 keV. However, a multi-temperature plasma, expected to be present in the post-shock region, does not improve the fit quality. If the abundance is left free to vary, it assumes an unrealistic valueAZ = 1.7 for the October 2006 data, while for the March 2007 spectrum we obtainAZ = 0.6, but still within errors compatible with solar abundances. We therefore fix AZ to the solar value. The fits further improve by including an additional dense absorber covering the source
Fig. 4. The October 2006 EPIC-pn spectrum of RX J0704 is shown with the best fit model discussed in the text and parameters reported in Table2(for the sake of simplicity, we do not plot the combined MOS spectrum). Each spectral component that contributes to the best-fit model is shown separately, for clarity.The bottom panelshows the residuals expressed in terms ofσ.
by∼40%, as detailed in Table2. The inclusion of a denser ab-sorber is justified by a F-test at significance level of 99.9%. The low column density of the total absorber, when compared with the total galactic absorption in the direction of the source (NH,gal = 8.15×1020 cm−2, Dickey & Lockman 1990), sug-gests a likely interstellar origin. On the other hand, the dense absorber should be confined within the binary system and likely due to pre-shock material as suggested by the energy depen-dence of the spin light curve. No major differences are found in the spectral parameters between the October 2006 and March 2007 data (see Table2), except for the lack of detectable iron 6.4 keV line in the March 2007 low S/N spectrum and a signif-icant change in the normalization of the blackbody component, which increases by a factor of two in March 2007. This change could explain the increase in the source flux observed between the two epochs (FOct.
0.2−10.0 keV = 4.2 ×10⁻¹² erg cm−2 s−1 and
FMar0.2−.10.0 keV=5.3×10⁻¹²erg cm−2s−1, respectively).
[image:6.595.297.545.208.460.2]Table 3.Spectral parameters obtained from fitting the October 2006 phase-resolved EPIC-pn spectra of RX J0704 extracted in the phase intervals quoted in the text with the model shown in Table2.
Parameters Dip Bump Flat
F0.2−10.0 keV 2.71 5.15 4.13
(10−12erg cm−2s−1)
NH(1023cm−2) 2.1−+10..38 1.3+
1.8
−0.7 2.7+ 1.1 −0.7
Cov. Frac. 0.73±0.04 0.48+0.06
−0.07 0.44±0.20
kTBB(eV) 84+−1110 82±4 85±2
NBB(10−5) 3.3−+01..08 7.7+
1.3
−1.0 3.6±0.2 χ2
ν(χ2/d.o.f.) 1.15 (26/23) 1.03 (63/61) 1.00 (297/298)
unpulsed above 2 keV, we used the best-fit model of October 2006 keeping fixed the MEKAL parameters to the values found for the average spectrum. We also fixed the column density of total absorber as this is not expected to vary along the spin cy-cle. The Gaussian component used to account for the iron line at 6.4 keV is not required to fit the spectra extracted arount the dip and the bump because of the poor S/N ratio. Unfortunately, with our data many spectral parameters are badly constrained, as shown in Table3. Anyhow, we find a substantial change in the covering fraction of the partial absorber between the flat portion of the pulse and both the dip and the bump. The values of the normalization of the blackbody component found in the flat part and in the dip are consistent, within the errors, but there is an evident increase in the bump. Hence, it is conceivable that the spin pulse of RX J0704 is due to an increase in the local absorp-tion (dip feature) and to an increase in the projected area of the blackbody component (bump).
3.2. RX J1803
Similarly to RX J0704, the XMM-Newton data were also an-alyzed to search for periodicities in the X-ray, UV and opti-cal ranges. The spectroscopy acquired at OHP was analyzed to search for variability in the radial velocities of Balmer lines.
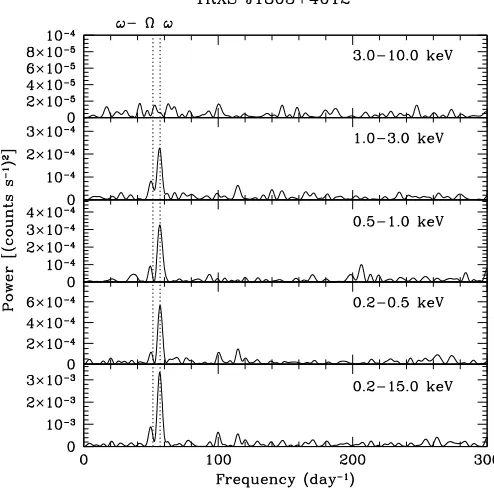
3.2.1. The X-ray periodicities in RX J1803
[image:7.595.46.301.118.207.2]The EPIC-pn light curve (EPIC-MOS light curves were too noisy to provide useful information) was extracted in the full energy range of the camera with a resolution of 20 s and Fourier analyzed. The power spectra in the 0.2–15.0 keV range, reported in Fig.5, show the presence of a strong peak at 56.6 day−1and an additional weaker peak at 49.8 day−1. A sinusoidal fit composed with one single frequency gives then a period of 1528 ± 6 s. This is fairly consistent with the highly accurate optical period of 1520.510±0.066 s determined byGänsicke et al.(2005), al-lowing us to confirm it as the true spin period of the WD. The residual light curve when fitted with a second sinusoid gives a period of 1697±22 s. If this frequency represents the sideband ω−Ω(commonly named as the beat), using either the X-ray period or the optical period we derive an orbital frequency of 5.64±0.69 day−1or 5.91±0.66 day−1, respectively. This gives an orbital period of 4.25±0.52 h or 4.06±0.45 h which does not match either the orbital period of 2.67 h determined byGänsicke et al.(2005), or 2PΩ. As it will be shown below, the orbital pe-riod is likely 4.4 h, hence longer than previously determined. The detection of X-ray variability at the spin and beat frequen-cies (with different amplitudes) is also observed in other IPs (see Norton et al. 1992a,b,1997). In RX J1803, the ratio of power be-tween spin and beat frequencies is∼3.8, implying that the beat
Fig. 5.Power spectra of the EPIC-pn light curve of RX J1803 in selected energy ranges.From bottom to top: 0.2–15.0 keV, 0.2–0.5 keV, 0.5– 1.0 keV, 1.0–3.0 keV and 3.0–10.0 keV. The spin (ω) as determined by optical photometry and the orbital sideband (ω−Ω) as determined by our spectroscopy (see text) are marked with vertical dotted lines.
modulation has an amplitude about twice lower than that of the spin.
Light curves of the EPIC-pn were also extracted in different energy ranges with a binning time of 20 s and Fourier analyzed, as also shown in Fig.5. The spin variability is clearly detected below 3 keV, as well as the beat frequency. The ratio of power between spin and beat peaks is∼4.8 in the 0.2–0.5 keV,∼3.6 in the 0.5–1.0 keV and∼2.8 in the 1.0–3.0 keV, suggesting that the variabilities at the two frequencies do not have the same energy dependence. Because of the higher accuracy of the optical period determination, we folded the spin light curves at the 1520.5 s pe-riod (Fig.6) using the time of maximum obtained from a sinu-soidal fit with fixed frequency: HJD = 2 454 343.6124(4). The folded light curves are quasi-sinusoidal with a dip atφ ∼ 0.8 which is more evident in the softest 0.2–0.5 keV band. The pulse amplitude (see Sect.3.1.2) is 72±8% in the 0.2–0.5 keV range, 57±7% in the 0.5–1.0 keV and 46±6% in the 1.0–3.0 keV band, indicating a strong energy dependence especially below 1 keV. The hardness ratios in the three bands however do not substan-tially vary along the spin cycle, indicating that the spin pulse is dominated by aspect angle variations.
The beat variability suggests that the shape of the spin pul-sation is variable along the binary period. The XMM-Newton observation spans about 5.6 h, likely covering more than one orbital period. We then extracted the spin light curve in six intervals each sampling∼3000 s (i.e. about two spin cycles). While amplitudes are rather constant within errors, the spin pulse changes phase with time (see Fig.7). Altough we cannot estab-lish whether this variability is periodic, the presence of the beat variability suggests it might be the case.
3.2.2. The UV and optical light of RX J1803
Fig. 6.The spin pulse of RX J1803 in selected energy ranges of the EPIC-pn and in theBandUVM2bands. All the light curves are folded at the 1520.5 s optical spin period using the time of maximum quoted in the text.
Fig. 7.Analysis of the X-ray spin pulse of RX J1803 in the range 0.2– 3.0 keV.Upper panel: the time dependence of the phase of the spin maximum.Lower panel: the time dependence of spin amplitudes.
[image:8.595.30.280.72.328.2]variability. Count rates steadily increase by a factor of∼1.4 dur-ing the 2.6 h of observation with theBfilter. This could reflect an orbital dependence, suggesting, as found in the X-ray data, that the orbital period is longer than previously estimated (Gänsicke et al. 2005). We then removed the long term trend in theB-band light curve using a third order polynomial. The folded spin light curves in the two bands are shown in Fig. 6. Although very noisy, they appear to be different: in the UV no modulation is
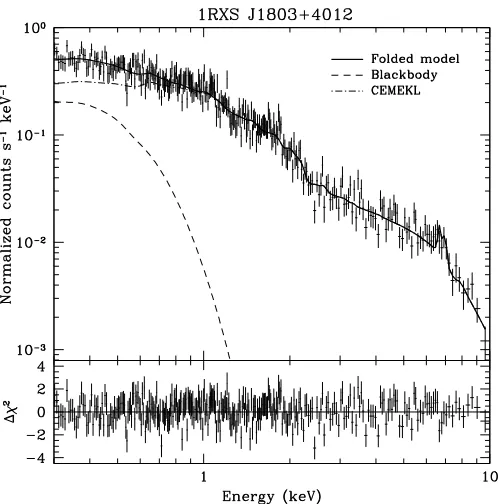
Fig. 8.The EPIC-pn spectrum of RX J1803 fitted with Model B dis-cussed in the text (see Table 4). The combined MOS spectrum, also used in the fit, is not shown. Each spectral component that contributes to the best-fit model is shown separately. The bottom panel reports the residuals expressed in terms ofσ.
apparent within errors, while the Bband light curve is quasi-sinusoidal, with an amplitude of 30±10%. TheBband pulse is single peaked, as also detected byGänsicke et al.(2005), and is broadly consistent in phase with the X-ray pulse.
3.2.3. The X-ray spectrum of RX J1803
The EPIC-pn (Fig. 8) and combined MOS spectra averaged over the whole observation were fitted using a model consti-tuted by an absorbed MEKAL with solar abundances. This sim-ple model does not satisfactorily fit the spectrum (χ2
ν = 2.2).
A slight improvement is achieved by using a multi-temperature plasma CEMEKL (χ2
ν=1.95) withkTmax ∼25 keV and power-law slope α fixed at unity. In both cases, there is an excess of counts below 0.5 keV and above 5 keV, but the hydrogen column density of the total absorber drops to zero, thus indi-cating that this component is not required. As a comparison, the total galactic absorption in the direction of RX J1803 is
NH,gal =3.4×1020cm−2 (Dickey & Lockman 1990). Leaving metal abundance free, the fit still remains unsatisfactorily high (χ2
ν = 1.4) giving sub-solar abundances AZ = 0.2. A great improvement (χ2
ν = 0.91) of the fit is found with a
compos-ite model (Model A in Table4) consisting of a blackbody and the multi-temperature plasma, which decreases the excess of counts at low energies. The blackbody temperature is found at
kTBB ∼ 100 eV. A further improvement is found by adding a partial covering (40%) dense (NH =2.8×1023cm−2) absorber (Model B in Table4). The presence of this component is signif-icant at the 98.6% level with the F-test. Here we note that the metal abundance of the optically thin plasma is still sub-solar (AZ =0.4) and that the slope of the power-law emissivity func-tion was fixed to unity, because when left free it assumed the valueα =0.67 but consistent with unity within errors. A sim-ilar quality fit (χ2
[image:8.595.30.282.383.635.2]Table 4.Spectral parameters of the models used to fit the EPIC-pn and combined MOS average spectra of RX J1803, as described in the text. Errors indicate the 90% confidence level of the relevant parameter.
Partial Absorber Blackbody Optically thin plasmaa χ2
ν(χ2/d.o.f.)
NHb Cov. Frac.c kTBB NBBd AZe kT1 N1f kT2g N2h
(1023cm−2) (eV) (10−6) (keV) (10−3) (keV) (10−3)
A 98±8 2.3±0.2 1.2+0.4
−0.3 40+
10
−8 1.61+ 0.09
−0.07 0.91 (448/495)
B 3+3
−1 0.4±0.2 95+ 10
−9 3.3+ 1.4
−0.6 0.4+ 0.3
−0.2 21+
8 −7 2.8+
0.8
−0.7 0.89 (437/493)
C 5+5
−2 0.5+ 0.3
−0.2 104±10 4.2+ 6.0
−1.3 0.2+ 0.2
−0.1 1.0±0.2 0.3+ 1.0 −0.2 12+
27 −3 1.6+
2.6
−0.7 0.89 (436/491)
aThe optically thin plasma is represented by a CEMEKL (Models A and B) with fixed slopeα=1 or by two MEKALs (Model C).b Column
density of the partial absorber.cCovering fraction of the partial absorber.d Normalization constant of the BBODY model.eMetal abundance. f Normalization constant of the first MEKAL model (only for Model C).g In Models A and B this is the maximum temperature of CEMEKL
[image:9.595.340.537.251.449.2]model.hNormalization constant of the CEMEKL (Models A and B) or the second MEKAL model (Model C).
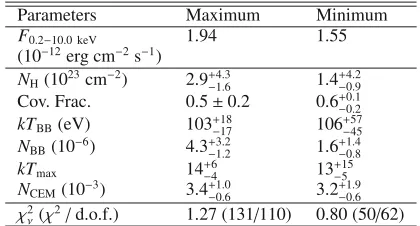
Table 5. Best-fit spectral parameters of the phase-resolved EPIC-pn spectra of RX J1803 extracted in the phase intervals quoted in the text. Model B shown in Table4has been used.
Parameters Maximum Minimum
F0.2−10.0 keV 1.94 1.55
(10−12erg cm−2s−1)
NH(1023cm−2) 2.9−+41..36 1.4+
4.2 −0.9
Cov. Frac. 0.5±0.2 0.6+0.1 −0.2
kTBB(eV) 103+−1817 106+
57 −45
NBB(10−6) 4.3−+13..22 1.6+
1.4 −0.8
kTmax 14+−64 13+
15 −5
NCEM(10−3) 3.4−+01..06 3.2+
1.9 −0.6 χ2
ν(χ2/d.o.f.) 1.27 (131/110) 0.80 (50/62)
MEKAL components instead of the CEMEKL, supporting the idea that the optically thin plasma is not isothermal. The param-eters of the partial absorber and the blackbody are consistent with that of Model B, but badly constrained. The temperatures of the two MEKAL components are 1 keV and 12 keV, the lat-ter being consistent within errors with the maximum tempera-ture of the multi-temperatempera-ture plasma found in Model B. The low temperature plasma is instead required to fit a shallow bump lo-cated aroud 1 keV and ascribed to a complex of spectral lines likely dominated by a strong O
viii
line at 19 Å. Unfortunately, we cannot inspect the RGS because of the lack of data from RGS2. The observed X-ray flux in the 0.2–10.0 keV range isF0.2−10.0 keV = 1.84×10⁻¹² erg cm−2 s−1. A comparison with the observation carried out during RASS shows that RX J1803 was about 1.5 times brighter in the soft ROSAT band during the XMM-Newton observation. In 2007 the source is also less soft than when detected during RASS, since the ROSAT hardness ratios would have been HR1 =−0.09 and HR2 = +0.12, sug-gesting that the soft X-ray component was less prominent in the XMM-Newton observation than during RASS.
We also performed a phase-resolved analysis of the EPIC-pn spectrum extracted around the pulse maximum (φ=0.85−1.15) and minimum (φ=0.35−0.65), in order to investigate the mech-anism responsible for the pulsation. Model B shown in Table4 was used, keeping the metal abundance fixed to the value ob-tained for the average spectrum and fixing the power-law in-dexα = 1. The parameters of the CEMEKL component are very similar in both fits and are completely consistent with the value found in the average spectrum. This was expected since we do not observe any variabilty above 3 keV. Given quoted er-rors, the main variations arise in the normalization of the black-body component, which increases at the spin maximum by a factor of 2.7 with only a weak evidence that this occurs in the
Fig. 9.Power spectrum of the Hα radial velocities. The best value is
found atPΩ ∼ 5.45 day−1 (∼4.40 h). Secondary maxima are 2 day aliases.
partial absorber column density. The lack of a significant vari-ability in the hardness ratios suggests that the X-ray spin pulse in RX J1803 is likely dominated by changes in the projected area of the blackbody component. It is interesting to note that the ra-tio between the spin and the beat amplitudes is larger at lower energies, which could suggest a much lower contribution of the reprocessed soft X-ray component to the beat variability.
3.2.4. The spectroscopic period of RX J1803
The mean optical spectrum of RX J1803 was found similar to that already reported byGänsicke et al.(2005) and is typical of magnetic CVs with strong emission lines of the Balmer se-ries, He
ii
(4686 Å) and Hei
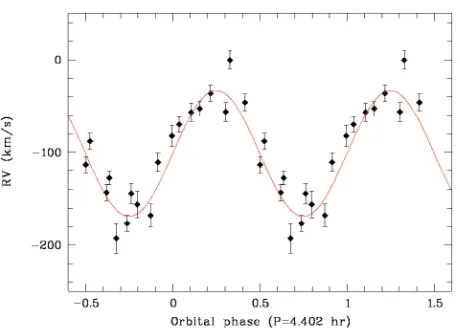
(4471, 5875, 6678 and 7065 Å), superimposed on a relatively blue continuum. The radial veloc-ities for the main lines were measured using a single Gaussian least square fit procedure and periodicities were searched using a Fourier analysis. The power spectrum for the strongest Hαlinegives the most accurate period determination (see Fig.9). The maximum power is seen at 5.45±0.27 day−1 with secondary peaks which are 1 and 2 days aliases, corresponding to the night separations. The characteristics of the radial velocity line modu-lation were further determined from aχ2sine fit. The minimum χ2 corresponds to a period of P
[image:9.595.69.279.282.395.2]Fig. 10.Radial velocities of the Hαline folded with the orbital period
PΩ=4.402 h. The best sine fit is also shown (line).
parameters. The orbital ephemeris for RX J1803 is determined asTΩ =HJD 2 453 917.361(20)+0.18342(57) E, whereTΩis the predicted heliocentric time of the blue-to-red radial velocity transition.
The radial velocities of the Hαline, folded at the above best
orbital ephemeris, are shown in Fig.10and the parameters of the corresponding best sine fits for the strongest emission lines are given in Table6. Though the 4.40 h period is the most sig-nificant, we cannot exclude the 2 day aliases at 4.029±0.014 h and 4.846±0.014 h. These observations therefore do not con-firm the period gap value 2.670 ± 0.008 h previously reported byGänsicke et al.(2005). We note however that a large scat-ter is visible in their Fig. 22 showing the radial velocities of Hα wings folded at the 2.67 h period and that these are only
marginally represented by a sinusoidal fit at their period. A sig-nificant distortion of the line profiles may have been introduced by the 600 s and 1800 s exposures used, not commensurate with the spin value. Using the 4.40 h value for the orbital period and the optical spin value (1520.51 s), theω−Ωandω+Ωbeat peri-ods are predicted at 1690.7±8.4 s and 1393.4±6.9 s, respectively. The XMM beat value of 1697±22 s is therefore consistent with the above orbital period.
4. Discussion
The X-ray analyses of RX J0704 and RX J1803 reveal strong pulses at the optical periods previously identified byGänsicke et al.(2005) that now can be interpreted as the true rotational pe-riods of the accreting WDs and hence confirming these 2 CVs as IPs. This increases the current roster of confirmed IPs to 31 sys-tems2. Both sources show pulsations that are strongly energy de-pendent in the soft X-ray portion of the spectrum. RX J0704 and RX J1803 also show common spectral properties characterized by a hard and a soft emission component. The latter property adds these two systems to the small but growing group of “soft IPs”. Now we discuss their pulse properties and spectral charac-teristics highlighting their common aspects.
4.1. RX J0704
The 480 s spin pulsation observed below 2 keV is highly struc-tured with a strong dip feature and a bump, while no modulation 2 For a comprehensive list of IPs see alsohttp://asd.gsfc.nasa.
gov/Koji.Mukai/iphome/iphome.html
Table 6.Parameters of the orbital modulation of the emission line radial velocities. Errors are at the 1σconfidence level.
Lines γ(km s−1) K(km s−1) Phasea
Hα −94.6±4.9 69.2±6.8 0.0 (fixed)
Hβ −70.3±6.4 72.2±8.7 0.02±0.13
Hγ −39.3±9.1 37.9±12.6 −0.01±0.15 aPhase of the blue-to-red zero crossing.
is detectable at higher energies. The spin pulse is very similar to that observed in PQ Gem (de Martino et al. 2004; Evans et al. 2006), which also shows a marked dip that preceeds the spin maximum. The dip in both sources is due to an increase of absorption from an intervening column along the line of sight. While for PQ Gem the geometry of the system and its accre-tion flow is rather well determined (Potter et al. 1997), that in RX J0704 has still to be established. Notwithstanding this, the strong similarity of the pulse may suggest that also in RX J0704 the dip could result from the obscuration of the magnetic pole produced by the accretion flow along field lines (curtain,Rosen et al. 1988) which preceeds the pole itself. In this configuration, the material couples at large distances and travels out of the or-bital plane producing large absorption effects. At later phases, when the curtain moves away from the line of sight, the X-rays are less absorbed and the WD area of the accreting pole is still at its maximum visibility. This is also corroborated by the vari-ability seen at UV wavelengths, where the maximum is observed in correspondence with the X-ray maximum. RX J0704 has been observed in a previous epoch to show a double-sine optical mod-ulation (Gänsicke et al. 2005), thus indicating that both poles are active at some epochs. To have both of them come into view the magnetic dipole should be relatively inclined (m≤i, wheremis the magnetic colatitude andiis the binary inclination). Eclipses are not observed in RX J0704, implyingi <∼70◦. Furthermore, the lack of modulation in the hard X-rays suggests that either the accretion shock does not pass behind the limb of the WD or there are two poles equally contributing to the hard X-rays. This last is favoured in the framework of two visible poles. Wether ma-terial couples at large radii, producing very localized absorbing structures, need to be explored with further observations such as phase resolved spectroscopy and multi-band photometry.
The spectral analysis confirms the presence of a blackbody-like soft X-ray component which strongly dominates the pulse below 0.5 keV. This component is relatively hot and should originate in a relatively small area of the WD polar cap. In fact, the normalization constants of the blackbody in both the epochs of observation imply an emission area that is in the range 4−7×10¹² d800 pc2 cm23. The bolometric flux of the blackbody is FBB = 2.6−5.6 ×10⁻¹² erg cm−2 s−1. On the other hand, the optically thin emission has a bolometric flux 4.6–1.4 times larger than that of the soft component in the two observations. Therefore, to obtain an estimate of the mass accretion rate, we need to include both components. Here we note that the UV flux is modulated at the spin period by 12% and, when dereddened by EB−V = 0.015 (as derived from the hydrogen column
den-sity of the total absorber,Ryter et al. 1975), is about three or-ders of magnitude higher than the extrapolated blackbody flux 3 For RX J0704 and RX J1803 we adopt lower limits to their distances
of 800 pc and 500 pc, respectively. These are obtained using the 2MASS
[image:10.595.320.521.108.153.2]in that range. Hence, the accretion luminosity is estimated as
Laccr >∼LBB+Lhard+LUV =1.1×1033 d800 pc2 erg s−1. The up-per temup-perature value of the optically thin component of 24 keV provides a lower limit to the shock temperature, which in turn would give a WD mass of 0.52M. We then assume a canonical WD mass value of 0.6 M WD and derive an accretion rate of ∼1016d2
800 pcg s−
1. At a distance of 800 pc it is lower by one or-der of magnitude than the 2.6×10¹⁷g s−1expected for its orbital period (Warner 1995).
Norton et al.(1999) proposed that fast rotators like V709 Cas (Pω=313 s), YY Dra (Pω=529 s) and V405 Aur (Pω=545 s)
possess weakly magnetized WDs. RX J0704, with its short 480 s spin period, joins these fast rotators. Its magnetic moment could be estimated assuming that the WD is accreting from a disc. The strong spin variability indicates that accretion is disc-fed (Norton 1993). Hence, the condition for disc formation and truncation at the magnetospheric radius implies thatRmag ≈ Rco, where the corotation radius is the radius at which the magnetic field ro-tates with the same Keplerian frequency of the inner edge ot the accretion disc. These are defined asRco =
GMWDP2ω/4π2 1/3
andRmag = 5.5×10⁸(MWD/M)1/7R−92/7L33−2/7μ430/7 cm, where
R9 is the WD radius in units of 109 cm, L33 is the lumi-nosity in units of 1033 erg s−1, and μ
30 is the WD magnetic moment in units of 1030 G cm3. For a 0.6 M WD, we find μ ∼ 1.0×1032 d
800 pc G cm3. The spin-to-orbit period ratio of RX J0704 isPω/PΩ∼0.032, thus it is a relatively highly asyn-chronous system which poses the question of whether this sys-tem is spinning at equilibrium. Spin equilibria have been com-puted byNorton et al.(2004) for systems with a fixed mass ratio
q = 0.5 and accreting at the secular value for their orbital
pe-riods. ForPω/PΩ = 0.03 and an orbital period of 4.2 h, it is predicted that equilibrium is reached for a magnetic moment of μeq ∼5×1032 G cm3. While this could suggest that RX J0704 is not spinning at equilibrium, this issue remains open until the distance and the mass ratio remain undetermined.
4.2. RX J1803
The X-ray timing analysis of RX J1803 has revealed the pres-ence of a strong pulsation, with an amplitude of 54%, at the pre-viously identified optical period, which confirms this system as an IP. We also detect a weaker modulation (by a factor of∼2) at a period of 1697±22 s that we interpret as the beat period. This is consistent with the value obtained using the optical pho-tometric spin period and our new spectroscopic orbital period, i.e. 1681.88±0.56 s. Hence, both our new spectroscopy and X-ray data show that the binary period is much larger than pre-viously determined (Gänsicke et al. 2005). With the new 4.4 h orbital period, RX J1803 is outside the orbital period gap and its spin-to-orbit period ratio lowers toPω/PΩ∼0.096, which is well within the range found for most systems (seeNorton et al. 2004).
X-ray pulsations at the beat frequency occur when the ac-cretion stream is directly channelled to the magnetic poles of the WD, without passing through the disc (Wynn & King 1992). However, the detection of both spin and beat periodicites sug-gests an hybrid accretion mode, i.e. occurring simultaneously via a disc and disc-overflow (Hellier 1995). The proportion between the two accretion mechanisms can be inferred from the relative amplitudes of the corresponding X-ray variabilities. Disc-overflow was also theoretically predicted byArmitage & Livio(1998). To date, only the IP V2400 Oph is known to be a
pure stream-fed accretor. A few other systems (such as FO Aqr, AO Psc, TX Col) have shown both spin and beat variabilities, with different amplitudes. RX J1803 thus joins these few sys-tems with disc accretion representing∼66% of the total flow.
The X-ray spin pulse below 3 keV is single peaked and energy dependent, while no detectable modulation is found at higher energies. Both hardness ratios in the soft bands and spec-tral analysis show that the spin pulse is likely dominated by as-pect variations rather than photo-electric absorption. We also find changes of the phase of pulse maximum on a timescale of hours, commensurable with the orbital period. The X-ray beat variability does not appear to possess the same spectral dependence of the spin, although it is also observed below 3 keV. The spectrum of RX J1803 is well described by an op-tically thin multi-temperature plasma with maximum tempera-turekTmax ∼ 30−40 keV which can be regarded as the shock temperature. A blackbody component at 95 eV also contributes to the soft portion of the spectrum by 27% of the total observed flux below 1 keV. Both components are absorbed by a dense (NH = 3×1023 cm−2) local material covering ∼40% of the X-ray emitting region. If the latter is mostly related to the over-flowing material, this could explain the different energy depen-dence of the beat and spin variabilities. The blackbody emission is also relatively hot, with a very small area on the WD pole (∼1.0×10¹¹ d2
500 pc cm2). Its bolometric flux is FBB = 2.9× 10⁻¹³erg cm−2s−1which results to be 14 times smaller than that of the optically thin component. To evaluate the accretion lumi-nosity we include both hard and soft X-ray components, as well as the modulated flux in the UV/optical bands. However, the UV range does not show a modulation. We therefore include only the
Bband modulated flux of 7.3×10⁻¹⁴erg cm−2s−1, corresponding to a luminosity 2.2×1030d2
500 pcerg s−1. The accretion luminosity is thenLaccr>∼Lhard+LBB+LB=1.3×1032d2500 pcerg s−1. To es-timate the mass accretion rate we use a WD mass inferred from the shock temperature of 30–40 keV: MWD ∼ 0.61−0.76M. This gives an accretion rate ˙M>∼0.8−1×10¹⁵d2
500 pcg s−1. If the source is indeed at 500 pc, this value is low and much smaller than the secular value predicted for its 4.4 h orbital period, i.e. 3×10¹⁷g s−1(Warner 1995). Although this is a lower limit to the accretion rate and unless most of the accretion luminosity is not emitted at high energies, RX J1803 seems to be a soft IP with a low accretion rate.
The ratio between the spin and orbital period is 0.096, which is very close to the typical value of 0.1 for IPs and suggests that RX J1803 is spinning close to equilibrium. The dominance of the spin pulsation also indicates that RX J1803 accretes pre-dominantly via a disc. As done in Sect.4.1, the condition for disc truncation atRmaggives a lower limit for the magnetic mo-mentμ∼1.3×1032d
500 pcG cm3using the ˙Mand the WD mass derived for this object. FollowingNorton et al.(2004), the mag-netic moment predicted for a system in spin equilibrium with
Pω/PΩ=0.096 andPΩ=4.4 h isμ=2×1033G cm3. Further observations to constrain the multicolour variability as well as the distance of this system are needed to draw firm conclusions on the mass accretion rate and the magnetic moment of this system.
4.3. Soft X-ray IPs: an emerging new class?
Table 7. Blackbody temperatures and softness ratios (see text) of 13 “soft IPs”, as derived from spectral fits available in literature. For some objects different values are reported as different models were ap-plied and/or different spectral data were used.
Object kTBB Softness ratio Reference
(eV) Fsoft/4Fhard
UU Col 50 0.043 1
73 0.011 2
PQ Gem 56 0.1 3
48 0.031 2
NY Lup 86 0.114 4
104 0.026 2
1RXS J2133+5107 96 0.208 5 1RXS J1730-0559 91 0.218 6
V2400 Oph 103 0.181 3
117 0.009 2
V405 Aur 73 0.2 3
65 0.211 2
GK Per 62 0.048 2
EX Hya 31 0.101 2
WX Pyx 82 0.02 2
MU Cam (2005) 59 0.125 7 MU Cam (2006) 54 0.166 7 RX J0704 (Oct. 2006) 84 0.053 This work RX J0704 (Mar. 2007) 88 0.172 This work
RX J1803 95 0.019 This work
References are (1) de Martino et al. (2006a); (2) Evans & Hellier
(2007); (3) de Martino et al. (2004); (4) Haberl et al. (2002); (5)de Martino et al.(2006b); (6)de Martino et al.(2008); (7)Staude et al.(2008).
V405 Aur and UU Col (Mason et al. 1992;Haberl et al. 1994; Motch et al. 1996; Burwitz et al. 1996). Such a component was also recognized in a few other systems observed with BeppoSAX (V2400 Oph,de Martino et al. 2004) and with the high sensitive XMM-Newton data (NY Lup,Haberl et al. 2002; 1RXS J2133.7+5107,de Martino et al. 2006b; 1RXS J173021.5-055933, de Martino et al. 2008; 1RXS J062518.2+733433, Staude et al. 2008). A systematic search for this component in the XMM-Newton archival data has further added three systems EX Hya, GK Per and WX Pyx (Evans & Hellier 2007). The cur-rent roster of soft X-ray IPs amounts to thirteen systems, which is now a statistically significative sample, comprising 42% of all the confirmed IPs. Therefore, “soft IPs” seem to represent a well defined class among IPs. This makes the soft X-ray emission not a sole characteristics of polar systems which deserves an expla-nation. Moreover, the properties of the soft X-ray component in IPs still have to be defined. With thirteen systems, this is now possible. We compiled Table7, a listing of the blackbody tem-peratures and softness ratios (defined as the bolometric flux ratio
[image:12.595.39.272.126.353.2]Fsoft/4Fhard, seeRamsay & Cropper 2004) as derived from spec-tral analyses available in literature. Despite the great spread due to different models applied and/or different spectral data, there is clear evidence that the soft X-ray blackbody in IPs covers a wide range of temperatures (30–100 eV), that is much wider than in the polar systems (see also Fig.11). In most cases the tempera-tures are high and larger than those found in the polars with only a few systems falling in the same range. These hot blackbodies could arise from small cores of the accretion spots onto the WD poles. As already noted inde Martino et al. (2008), although the emitting areas are subject of great uncertainties, mostly due to the distance, systems showing hot blackbodies like NY Lup, 1RXS J173021.5-055933, RX J0704 and RX J1803 have frac-tional areas f <∼10−5−10−6which are two-three orders of mag-nitude lower than those found in IPs with cooler blackbodies
Fig. 11.The softness ratio of polars (filled triangles) and of “soft IPs” (other symbols) versus blackbody temperature. Values for polars are taken fromRamsay & Cropper(2004), while those for IPs from Table7.
such as PQ Gem (James et al. 2002). Since the inferred black-body temperature is an average value over the heated spot, the wide range of temperatures might reflect accretion spots of dif-ferent sizes.
Strong evidence is found in most polars that the soft X-ray component arises in the WD photosphere primarly due to the heating by accretion of dense blobs (Kuijpers & Pringle 1982; Woelk & Beuermann 1996;Beuermann 1999,2004), with most of the reprocessed primary (hard X-rays and cyclotron) radia-tions mainly emitted in the far-UV (König et al. 2006). As seen in Fig.11, the softness ratio of IPs is generally smaller than that observed in the polars and, as already noted byEvans & Hellier (2007), this indicates that blobby accretion does not occur in IPs. We further stress that the presence of a disc in these sys-tems indeed makes this accretion mode very unlikely. Most IPs also have softness ratios below 0.25, lower than that predicted by the standard modelLrepr ≈0.5
Lbrem+Lcyc
(Lamb & Masters 1979), suggesting that the soft X-ray emission does not fully ac-count for the whole reprocessing.
Beamed cyclotron radiation originates in the higher parts of the post-shock region and, thus, can heat large spots. Bremsstrahlung is instead irradiated isotropically from the dense post-shock regions closer to the WD surface and hence irradi-ates smaller areas. Therefore we might expect that for higher magnetic field IPs, cyclotron cooling is not totally negligible and therefore these systems would have larger accretion spots with respect to other IPs with lower magnetic fields. This in turn would imply that higher field IPs are expected to show on aver-age lower blackbody temperatures than the low field IPs. A test to this hypothesis would then require a systematic search for po-larized radiation in the soft IPs and, in particular, over a wide range of wavelengths from visual to IR.
The detailed and recent study on reprocessed radiation in po-lars byKönig et al.(2006) relies on the clear evidence of a large irradiated spot on the WD surface in AM Her that mainly emits in the far-UV, implying that most of the soft X-rays do not enter in the energy balance. For IPs, there is still a great uncertainty in whether the UV modulated flux comes from the irradiated WD pole or from the inner regions of the curtain or both (e.g. de Martino et al. 1999;de Martino et al. 2006a,2008;Eisenbart et al. 2002;Evans et al. 2006). Detailed far-UV/UV coverage to identify the heated WD surface in IPs would be highly desirable to assess the energy balance in these systems.
5. Conclusions
XMM-Newton observation of RX J0704 and RX J1803 con-firm these CVs as true members of the IP class. Both systems are dominated by strong pulsations at the WD rotational peri-ods which dominate the soft portion of their spectrum, i.e. be-low 3–5 keV. With Pω = 480 s, RX J0704 joins the group
of fast rotators and possess a relatively high degree of asyn-chronism (Pω/PΩ = 0.04). RX J1803 is, instead, a slow rota-torPω =1520.5 s. From our new optical spectroscopy and the
X-ray data of this system we infer an orbital period of 4.4 h, that is longer than previously determined. This gives a spin-to-orbit period ratio of∼0.1, typical for IPs.
The detection of strong spin pulses indicate that accretion occurs preferentially via a disc in both systems. However, while RX J0704 only shows X-ray variability at the spin period, RX J1803 also displays a weak variability at the orbital sideband (ω−Ω), implying that accretion also occurs via disc-overflow.
Their X-ray spectra are compatible with composite emission consisting of an optically thin component (∼11−25 keV), which in RX J1803 is better described by a multi-temperature plasma, reaching values up to 30–40 keV, as well as by blackbody emis-sion with a relatively high temperature (85–100 eV) heavily ab-sorbed by dense material partially covering the X-ray source. This adds these two systems to the growing group of “soft IPs”, which indicates that the presence of a soft blackbody compo-nent is not solely a characteristic of the polars. However, a ma-jor difference is in the temperatures of the blackbodies in the IPs which cover a wider range than that observed in the polar sys-tems. We qualitatively try to explain the differences in terms of reprocessing over different sizes of the WD spot. We suggest that IPs showing cooler soft X-ray blackbody components also pos-sess WDs irradiated by cyclotron radiation. A further systematic observational approach addressing the detection of polarized op-tical/IR emission in IPs is highly desiderable.
Acknowledgements. We acknowledge the XMM-Newton SOC and MSSL staff for help in the reprocessing of the OM data. Prof. A. Bianchini is gratefully
acknowledged for useful discussion. D.d.M. and G.A. acknowledge financial support from ASI under contract ASI/INAF I/023/05/06 and from INAF under contract PRIN-INAF 2007 N.17.
References
Aizu, K. 1973, Prog. Theor. Phys., 49, 1184 Armitage, P. J., & Livio, M. 1998, ApJ, 493, 898
Beuermann, K. 1999, in Highlights in X-ray Astronomy, ed. B. Aschenbach, & M. J. Freyberg, 410
Beuermann, K. 2004, in Magnetic Cataclysmic Variables, ed. S. Vrielmann, & M. Cropper, IAU Colloq., 190, ASP Conf. Ser., 315, 187
Buckley, D. A. H., Sekiguchi, K., Motch, C., et al. 1995, MNRAS, 275, 1028 Burwitz, V., Reinsch, K., Beuermann, K., & Thomas, H.-C. 1996, A&A, 310,
L25
de Martino, D., Silvotti, R., Buckley, D. A. H., et al. 1999, A&A, 350, 517 de Martino, D., Matt, G., Belloni, T., Haberl, F., & Mukai, K. 2004, A&A, 415,
1009
de Martino, D., Matt, G., Mukai, K., et al. 2006a, A&A, 454, 287
de Martino, D., Matt, G., Mukai, K., et al. 2006b, in The X-ray Universe 2005, ed. A. Wilson, ESA SP, 604, 261
de Martino, D., Matt, G., Mukai, K., et al. 2008, A&A, 481, 149
den Herder, J. W., Brinkman, A. C., Kahn, S. M., et al. 2001, A&A, 365, L7 Dickey, J. M., & Lockman, F. J. 1990, ARA&A, 28, 215
Eisenbart, S., Beuermann, K., Reisch, K., & Gänsicke, B. T. 2002, A&A, 382, 984
Evans, P. A., & Hellier, C. 2007, ApJ, 663, 1277
Evans, P. A., Hellier, C., & Ramsay, G. 2006, MNRAS, 369, 1229 Gänsicke, B. T., Marsh, T. R., Edge, A., et al. 2005, MNRAS, 361, 141 Haberl, F., & Motch, C. 1995, A&A, 297, L37
Haberl, F., Throstensen, J. R., Motch, C., et al. 1994, A&A, 291, 171 Haberl, F., Motch, C., & Zickgraf, F.-J. 2002, A&A, 387, 201
Hellier, C. 1995, in Magnetic Cataclysmic Variables, ed. D. A. H. Buckley, & B. Warner, ASP Conf. Ser., 85, 185
James, C. H., Ramsay, G., Cropper, M. C., & Branduardi-Raymont, G. 2002, MNRAS, 336, 550
Jansen, F., Lumb, D., Altieri, B., et al. 2001, A&A, 365, L1
Katajainen, S., Butters, O. W., Norton, A. J., Lehto, H. J., & Piirola, V. 2007, A&A, 475, 1011
Knigge, C. 2006, MNRAS, 373, 484
König, M., Beuermann, K., & Gänsicke, B. T. 2006, A&A, 449, 1129 Kuijpers, J., & Pringle, J. E. 1982, A&A, 114, L4
Lamb, D. Q., & Masters, A. R. 1979, ApJ, 234, L117
Lemaitre, G., Kohler, D., Lacroix, D., Meunier, J. P., & Vin, A. 1990, A&A, 228, 546
Mason, K. O. 1997, MNRAS, 285, 493
Mason, K. O., Watson, M. G., Ponman, T. J., et al. 1992, MNRAS, 258, 749 Mason, K. O., Breeveld, A., Much, R., et al. 2001, A&A, 365, L36 Motch, C., Haberl, F., Guillout, P., et al. 1996, A&A, 307, 459 Norton, A. J. 1993, MNRAS, 265, 316
Norton, A. J., McHardy, I. M., Lehto, H. J., & Watson, M. G. 1992a, MNRAS, 258, 697
Norton, A. J., Watson, M. G., King, A. R., Lehto, H. J., & McHardy, I. M. 1992b, MNRAS, 254, 705
Norton, A. J., Hellier, C., Beardmore, A. P., et al. 1997, MNRAS, 289, 362 Norton, A. J., Beardmore, A. P., Allan, A., & Hellier, C. 1999, A&A, 347, 203 Norton, A. J., Wynn, G. A., & Somerscales, R. V. 2004, ApJ, 614, 349 Piirola, V., Hakala, P., & Coyne, G. V. 1993, ApJ, 410, L107 Piirola, V., Vornanen, T., Berdyugin, A., & Coyne, G. V. 2008
[arXiv:0805.4289]
Potter, S. B., Cropper, M., Mason, K. O., Hough, J. H., & Bailey, J. A. 1997, MNRAS, 285, 82
Ramsay, G., & Cropper, M. 2004, MNRAS, 347, 497
Rosen, S. R., Mason, K. O., & Cordova, F. A. 1988, MNRAS, 231, 549 Ryter, C., Cesarsky, C. J., & Audouze, J. 1975, ApJ, 198, 103 Shakhovskoj, N. M., & Kolesnikov, S. V. 1997, IAU Circ., 6760, 2 Staude, A., Schwope, A. D., Schwarz, R., et al. 2008 [arXiv:0806.0793] Strüder, L., Briel, U., Dennerl, K., et al. 2001, A&A, 365, L18
Turner, M. J. L., Abbey, A., Arnaud, M., et al. 2001, A&A, 365, L27 Voges, W., Aschenbach, B., Boller, T., et al. 1999, A&A, 349, 389
Warner, B. 1995, Cataclysmic variable stars (Cambridge: Cambridge University Press)
Woelk, U., & Beuermann, K. 1996, A&A, 306, 232