Internship Report
3D Printing - Depowdering techniques
Zuhair Siddiqui - s1705180
January 20, 2017
Prepared for: Dr Ir. Maurice Limpens
TNO Dep. EFAM 5612 AH Eindhoven The Netherlands
De Rondom 1 5612 AP Eindhoven P.O. Box 6235 5600 HE Eindhoven The Netherlands
www.tno.nl
T +31 88 866 50 00 F +31 88 866 88 19 TNO report
| Final report
Date 20 January 2017
Author(s) Zuhair Siddiqui
Copy no No. of copies
Number of pages 53 (incl. appendices) Number of
appendices
2
Sponsor
Project name WP3.34 Post processing Project number 060.12510/01.03.03
All rights reserved.
No part of this publication may be reproduced and/or published by print, photoprint, microfilm or any other means without the previous written consent of TNO.
In case this report was drafted on instructions, the rights and obligations of contracting parties are subject to either the General Terms and Conditions for commissions to TNO, or the relevant agreement concluded between the contracting parties. Submitting the report for inspection to parties who have a direct interest is permitted.
© 2017 TNO
Acknowledgment
I would like to first express my gratitude to TNO for allowing me to do an internship at the Equip-ment for Additive Manufacturing (EFAM) division and allowing me to make use of the knowledge and resources.
I would like to thank Dr. ir. Maurice Limpens for his never-ending support during the internship. I would like to also thank Dr. ir. Erwin Meinders for giving me the chance to be part of EFAM and also Elma Janssen for her support in the beginning during the security clearance. The review and feedback received from the peers also aided in successful completion of the project.
Preface
Contents
Acknowledgment i
Preface ii
1 Executive Summary 1
2 Introduction 3
3 Powder Flow 6
3.1 Aluminum Pixel (AlSi10Mg) . . . 6
3.2 Results . . . 9
3.3 Conclusion . . . 10
4 Cleaning Techniques 13 4.1 Depowdering Techniques . . . 14
4.1.1 Laser Shockwave Cleaning . . . 14
4.2 Electromagnetism . . . 15
4.3 Chemical flushing . . . 16
4.4 Vibrations and gravity . . . 17
4.5 Ultrasonic Cleaning . . . 17
4.6 Final selection of cleaning technique . . . 18
5 Ultrasonic cleaning 21 5.1 Ultrasonic cleaning of the samples . . . 22
5.2 Experimental Procedure . . . 26
5.3 Results from ultrasonic cleaning . . . 27
5.3.1 Stainless steel cooling jackets . . . 27
5.3.2 Aluminum alloy pixel (AlSi10Mg) . . . 30
5.3.3 Stainless steel pipe fitting . . . 31
5.3.4 Stainless steel metal plate A15 and A16 . . . 32
5.4 Equipment for Imaging . . . 35
5.4.1 Light Microscopy . . . 35
5.4.2 Scanning Electron Microscope . . . 35
5.4.3 Acoustic Imaging . . . 36
5.5 Measuring angle of repose . . . 38
5.5.1 Angle Of Repose . . . 38
6 Discussion and Conclusion 39
7 Recommendations 40
References 41
8 Appendice 42
Appendix A Equipment Used 42
List of Figures
1 SLM . . . 3
2 Complex 3D printed manifold . . . 4
3 Aluminum Pixel (AlSi10Mg). . . 6
4 Section view of Aluminum Pixel (AlSi10Mg) with internal features. . . 7
5 Experimental Setup for Powder flow . . . 8
6 Percentage powder removed over the angle orientation. . . 9
7 Depiction of Aluminum pixel at1200. . . 10
8 Depiction of Aluminum pixel at1800. . . . 11
9 Laser Shockwave Cleaning . . . 14
10 Electromagnestism Schematics . . . 15
11 Electromagnetic field Schematics . . . 16
12 Ultrasonic Cleaning Shematics . . . 18
13 Decision Parameters . . . 19
14 Summary of Cleaning techniques . . . 20
15 Acoustic frequency scale and selected applications . . . 21
16 Bransonic Ultrasound bath . . . 22
17 Modified Ultrasonic Bath . . . 23
18 Stainless steel cooling jacket . . . 24
19 Aluminum alloy pixel AlSi10Mg . . . 24
20 Stainless steel pipe fitting . . . 24
21 Stainless steel plate A15 . . . 25
22 Conventional hex nut . . . 25
23 Conventional stainless steel metal plate . . . 25
24 Conventional stainless steel bolt nut . . . 25
25 Stainless steel cooling jacket schematics . . . 28
26 Removed powder over bubble . . . 30
27 Powder removed . . . 30
28 Cross-section view of Aluminum pixel . . . 31
29 Ultrasonic cleaning results . . . 34
30 Optical Light Microscope . . . 35
31 Quanta 600 Scanning Electron Microscopy . . . 36
32 Sonix ECHOTM . . . . 36
33 SEM of powder . . . 37
34 SEM of stainless steel cooling jacket . . . 37
35 SEM of stainless steel cooling jacket and A15 . . . 38
36 Measuring the height . . . 38
List of Tables
1 Summary of occupancy of the sample volume . . . 7
2 Summary of the powder flow via respective methods . . . 11
3 Ultrasonic cleaning of stainless steel cooling Jacket . . . 28
4 Ultrasonic cleaning of conventional stainless steel Hex nut . . . 29
5 Ultrasonic cleaning of conventional metal stainless steel plate . . . 29
6 Ultrasonic cleaning of conventional stainless steel bolt nut . . . 29
7 Ultrasonic cleaning of Aluminum pixel (AlSi10Mg) . . . 31
8 Ultrasonic cleaning of stainless steel pipe fitting . . . 32
9 Ultrasonic cleaning of metal stainless steel A15 . . . 32
10 Ultrasonic cleaning of metal stainless steel A16 . . . 33
A.1 Mettler Toledo XS 104 Specs . . . 42
A.2 Mettler Toledo AE 160 Specs . . . 42
A.3 Haraeus T6120 Oven . . . 42
A.4 Bransonic Ultrasound RK 255 H . . . 43
A.5 Sonix Echo . . . 43
List of acronyms
CAD Computer-Aided Design
CCW Counterclockwise Direction
CW Clockwise Direction
LSC Laser Shockwave Cleaning
NDT Non-Destructive Testing
SEM Scanning Electron Microscopy
1
Executive Summary
Additive manufacturing is a technology that has broken conventional manufacturing barriers. Sim-ple to comSim-plex structures such as a screw or a mechanical turbine, can be simply drafted in
Computer-Aided Design (CAD) and ultimately be ”printed” for functional use. The freedom to print any complex shape favors additive manufacturing over conventional methods of manufacturing. Current additive manufacturing allows the possibilities for: Organ printing, electronics, food, metal,
ceramics and plastics printing.
In the Selective Laser Melting (SLM), the structure is built or printed through spherical particles of powder that typically lie in the micron-sized range. The laser sinters (melts) the powder together to form a final shape. Naturally, not all the powder is used to print the structure, but instead used
as a base or support for the next successive layer during the printing process. Thus, once the printing process is complete, the powder present within the structure becomes part of the inter-nal structure. These small particles can clog small precise orifices, channels’ and any opening
within the structure. This would defeat the purpose, for instance, the functionality of a printed heat exchanger which has loose internal powder, in terms of fluid flow and heat exchange. There-fore, there is a need to have a completely powder-free internal structure, from the manufacturing
perspective and the clientele requirement.
The main aim of this report is to determine how to efficiently remove excess powder from a 3D printed structure. To do this, experiments are first conducted to see if the loose powder would completely flow out of a structure at different orientations. The results of the experiments are then
compared with the Simulation model developed by Maurice Limpens. The experiment was not able to depowder the structure completely whereas in the simulation the structure completely de-powders. The main differences (namely interlocking, frictional forces and free flow of the powder)
between experimental and simulated results are due to the fact that the latter assumes an ideal behavior of powder flow.
Since the initial goal of depowdering was not successfully met with previous experiments, cur-rent available techniques for complete cleaning are then investigated. These techniques are (but
not limited to): Laser Shockwaves Cleaning, Ultrasound, Gravity and Vibrations, and Electro-magnetism. Ultrasound was chosen as the mode for cleaning, since among all the available techniques ultrasound shows promising evidence of cleaning. The results from the cleaning
ex-periment does in fact prove complete cleaning of the structure. Ultrasounds may require long cleaning hours (more than 24 hours) before the structure is completely clean. Different cleaning combinations and sequences (for instance, extreme manual tapping and shaking of the
struc-ture followed by water flushing ultimately placed under ultrasounds) drastically reduce the time required under ultrasounds. Within the scope of this report, the depowdering of 3D printed metals
is prioritized.
Furthermore experiments should be conducted with various geometries and different material
interlocking and friction) while experiments can be improved by adding excitation effects to see how it influences the powder flow. With regards to complete cleaning, other cleaning techniques
can be investigated to see how they compare with ultrasounds. Additional understanding on how each respective structure (build geometry, type of metal, shapes) behave under the influence of ultrasound waves is needed. Last but not the least, freshly 3D printed structures should be used
2
Introduction
Technological advancements in additive manufacturing have allowed the freedom to create shapes and structures that were not possible before by conventional methods such as casting, milling and injection molding to name a few. Using additive manufacturing techniques, structures with
com-plex internal geometries with thin walls and/or hidden channels can be created for use. Currently there are different industries involved in 3D printing such as: plastics, ceramics, food, and elec-tronics, biomedical and metal.
During Selective Laser Melting (SLM) powder is added to the powder bed during the additive
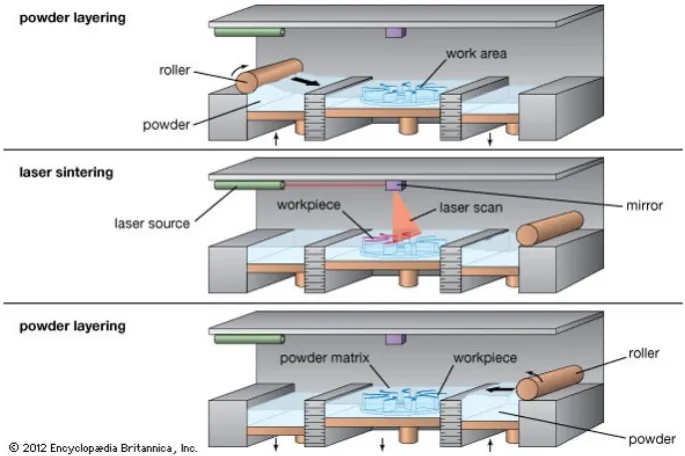
manufacturing to build a 3D structure. A roller spreads a layer of powder in the powder bed. A high powered laser then melts user defined regions of the powder bed to form the desired structure. The roller then reapplies fresh layer of powder over the previous printed layer. The process is
repeated until the print-job is complete. The process is depicted in Figure 1. Naturally there is loose unused powder inside the empty spaces of the product at the end of the manufacturing process. Primarily, this powder is used as support during the build for the successive print layers.
[image:12.595.140.483.382.610.2]This powder must be removed before the structure becomes usable.
Figure 1: Depiction of steps in Sinter Laser Melting (SLM) (Britannica, 2017).
The main aim of this report is to investigate whether such 3D printed structure can be successfully depowdered to achieve a usable product. Conventional methods of cleaning a 3D printed struc-ture during the post-processing involve blowing compressed/vacuum dry air, chemical flushing or
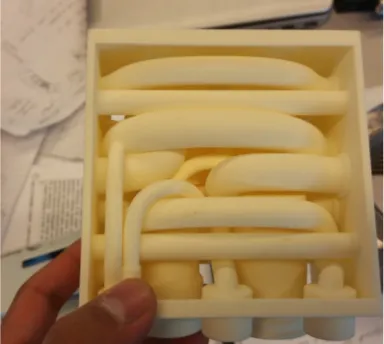
simply brushing off the excess powder. The challenge arises when you have geometry that has internal minuscule openings or channels that have internal dimensions in the range of millimeters to micrometers, in various shapes where manual cleaning is not possible. Such an example can
Figure 2: 3D printed manifold with complex channels
Compared to conventional manufacturing methods, additive manufacturing requires additional
post processing before the final product is functional. Post processing requires additional time. Ideally cleaning techniques that do not exceed the production time is desired. At the same time, there is high demand on cleanliness for specific products (heat exchangers) by certain customers,
thus accentuates the need for depowdering.
This is done first by checking whether a structure can simply be depowdered by subjecting it under different orientations. At TNO, a simulated model for depowdering a structure under different orientations is being developed by Maurice Limpens. The results of the simulation are going to be
validated with experimental results.
Secondly, existing powder removal or cleaning techniques are studied to determine the efficient method for complete depowdering/cleaning of the structure. There are numerous possibilities for removal of powder, namely Laser Shockwave Cleaning (LSC), ultrasound cleaning, and powder
removal under the influence of gravity and vibrations. Each technique is unique in its application. The respective cleaning techniques require extensive knowledge and expertise on the working principles of cleaning and the dynamics of powder removal. Out of the possibilities mentioned,
the technique with high evidence of potential for cleaning is selected since all the techniques cannot be investigated in the duration of the internship.
As far as the scope of this internship is concerned, the depowdering techniques investigated are primarily focused on metals that are used in Selective Laser Melting (SLM), such as Stainless
Steel (LPW-316), Aluminum alloys (AlSi10Mg) and Titanium alloys (Ti-6Al-4V).
Ideally, freshly 3D printed samples should be used for checking the level of cleanliness achievable from the ultrasound waves. TNO does not produce or manufacture 3D printed metal samples. Rather the metal material parts and samples are delivered by external manufacturer specializing
in 3D printing, namely NLR1 and ASML2. Requesting new single customized complex samples
from NLR is too expensive unless ordered in batches. Moreover it would take roughly about a month to receive a sample. Regardless, the available printed samples will be used for the
3
Powder Flow
This chapter describes the first approach to depowdering a structure at different orientations.
At TNO, a simulation model is being developed by Maurice Limpens to determine whether a filled structure could be depowdered or cleaned. A simple experiment is devised where a metal sample is subjected to different orientations. The simulation results are then compared with the
experimental results.
3.1
Aluminum Pixel (AlSi10Mg)
Before the experiment is setup, it is important to discuss the features of the Aluminum Pixel
(AlSi10Mg). First of all, one is tempted to assume the internal geometry of the sample to be symmetrical in nature. However this is not true. The section view of Aluminum pixel can be seen in Figure 4. The Aluminum pixel is primarily to be used as cooling channel. The arrows embedded
[image:15.595.229.383.432.618.2]on the Aluminum pixel (as seen in Figure 3) denote the direction of the flow of any fluid, i.e. the right channel is the entrance and the left channel is the exit. The inlet channel is relatively larger than the exit channel where orifices are present. This can be seen in Figure 4.
Figure 3: Aluminum Pixel (AlSi10Mg).
Secondly, since the sample is going to be filled manually with powder it is important to know how
much powder volume can be filled. According to the CAD file of the Aluminum pixel the internal volume of the structure should be roughly around 8,3c m3. To confirm that the pixel will also have
the exact volume, the sample is filled with water. The volume is found to be 8,1c m3. However, the maximum volume fill by stainless steel powder is around 4.5c m3which is roughly 54% volume fill
Figure 4: Section view of Aluminum Pixel (AlSi10Mg) with internal features.
Last but not the least, the sample itself has complex shape and internal thin walls at an angle. These regions are marked by dash circle in the Figure 4. The simulation calculated the results based on a fully filled Aluminum pixel where it could be seen that the sample can be completely
depowdered under orientations. The experiments are then conducted to validate if the same phenomenon is reproducible in real-life scenario. The summary of the occupancy of the volume fill in sample is given in Table 1.
Table 1: Summary of occupancy of the sample volume
Sample fill in: Volume(c m3)
Simulation 8,3
Water 8,1
Powder 4,5
Experimental Setup
A simple experiment is devised where a metal sample (AlSi10Mg) is rotated at around a fixed axis at different orientations in both Counterclockwise Direction (CCW) and Clockwise Direction (CW).
The experimental setup can be seen in Figure 5. The plane of reference is provided for ease of interpretation of angle orientations. The arrows in the Figure represent orientation direction, CCW and CW respectively.
Prior to experiments, it was expected that the Aluminum pixel sample will have 100% fill, which
the sample, sample with 100% volume fill is not achievable.
Figure 5: From Left to right: Experiment setup with Aluminum Pixel (AlSi10Mg), CCW direction
reference and CW direction reference.
The Aluminum pixel is initially weighed in Mettler Toledo scale. After filling the sample with stain-less steel powder, it is reweighed. The difference between the weights gives us the amount of powder that has been filled within the sample. It is then carefully mounted on a lab-made setup
against a protractor3, as can be seen in the Figure 5. It is manually rotated from00to3600with
100 intervals, first in the CCW direction, and then the experiment is repeated for CW direction.
The powder that flows out at every interval of the Aluminum pixel orientation is collected in a cir-cular aluminum lab pan placed in the bottom of the setup. At each interval, the Aluminum lab pan is weighed. The difference between each successive interval provides indication on how much
powder flows out at the respective angle orientation. It is noted that CCW direction loses powder differently than in CW direction.
Simulation
In the simulation being developed by Maurice Limpens, the .STL file of Aluminum pixel is sliced in cubic voxel of 250µm x 250µm x250µm. The Aluminum pixel is then orientated at100intervals,
first in the CCW direction and then it is repeated for CW direction. The simulation checks if the
powder can flow out under respective orientations, and can only flow when there is next empty voxel available for the powder to occupy the voxel space. In the simulation, the Aluminum pixel has 100% powder fill. In the simulation the powder flow is assumed to be ideal where the effects
of friction, interlocking and free flow of powder flow are not considered. The roughness of the wall of the sample is also different in the simulation compared to the 3D printed sample.
3.2
Results
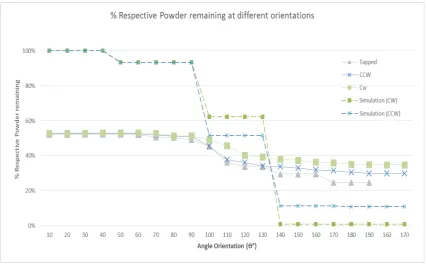
The results from the experiment are interesting. Although the Aluminum pixel sample does not completely empty, it still emptied 18% and 23% of the total powder-in (53%) in the CW direction and in the CCW direction respectively. This was observed when the sample isonly rotated and
no external excitation is applied. An experiment was also done where tapping4 is applied on the sample during the experiment. The depowdering is promoted by tapping. The percentage of stainless steel powder remaining within the sample at each angle interval is tabulated and
[image:18.595.99.527.257.521.2]graphed in Table 2 and Figure 6 respectively.
Figure 6: Percentage powder removed over the angle orientation.
In Figure 6, ”Tapped” refers to gentle striking of the sample, CCW and CW refers to
Counterclock-wise direction and ClockCounterclock-wise direction, respectively. The experimental results are represented by solid lines whereas the simulated results are represented by dashed lines. The Aluminum pixel sample could only be filled upto 53% (for CCW and CW) and 52% (tapped) compared to 100% in
the simulation.
The most percentage of powder that flows out of the sample is observed betweenθ= 1200 and
θ = 1400 where 9%, 10% and 13% of accumulative powder in that angle range flows out in the
CW, CCW and tapped experiment respectively.
The difference between the percentage of powder flow in CCW and CW direction can be explained
due to the internal geometry of the sample. Powder will accumulate in the marked regions in the
4Tapping refers to gentle strike on the sample till the point where no powder flowed out the sample at the respective
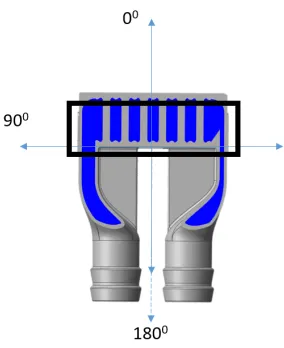
Figure 7. During the experiments, it was seen that the powder flows out from the above channel compared to the bottom channel regardless of CCW or CW direction. Upon visual inspection,
accumulated powder (rathole formation) could be seen in the bottom channel which could be the reason of flow resistance. It is interesting to note that the sample does not loose powder as much compared to other angle orientations when it is at θ = 1800, since one would expect the most depowdering to occur at this angle. At the corresponding angleθ= 1800, the powder accumulates
in the flat plate (box in Figure 8) and thus resists flow. This is also true for the simulated results at this angle. The effect of tapping was also checked to see how the powder flow out is influenced.
It was observed that tapping promotes depowdering because tapping reduces the resistance of powder flow.
The difference between the experimental and simulated results is that simulation considers the ideal flow behavior of the powder. The friction forces between the powder and the wall are
ne-glected which explains the continuous flow compared to discrete flow in the simulation. Inter-locking of powder is observed in the experiments which is not considered in the simulation. The validation was not successful since the experimental model only allowed 54% of the powder fill
[image:19.595.101.528.391.620.2]compared to the simulated results (100% powder fill). Furthermore, the roughness in the simula-tion is “virtual” and thus the effects of roughness are prominent in the experiment.
Figure 7: Depiction of Aluminum pixel at1200.
3.3
Conclusion
Figure 8: Depiction of Aluminum pixel at1800.
Table 2: Summary of the powder flow via respective methods
Method %Powder Fill %Powder remaining %Depowdered
Tapped 52% 25% 27%
CCW 53% 30% 23%
CW 53% 35% 18%
Simulation CW 100% 1% 99%
Simulation CCW 100% 11% 89%
almost depowdered. The main aim to completely depowder the sample has not been achieved
via this method. The reasons have been stated in the Results section (3.2).
Since the simulation model is still under development, additional parameters such as interlocking, friction forces and roughness of the sample under investigation could be implemented to simulate real-flow behaviour of the powder. As observed by results of tapping in the experiment, the
ef-fects of excitation could also be incorporated in the simulation model. The current sample under investigation has not been freshly printed. This meant the sample under investigation was almost powder free to certain extent and required re-filling. Due to the complex geometry of the
sam-ple, it could not be filled with 100% powder. Thus, fresh 3D printed samples that have not been post-processed should be tested to see the effects of powder flow under different orientations. Moreover, samples with more complexity, different shapes and sizes should be experimented
with and simultaneously compared with simulation model. Mechanical properties of the current powders being used in SLM could also be implemented.
The experiment for powder flow has been lab-made and is thus not an ideal way to experiment. During the experiment, there is friction when rotating the setup which also provides misleading
can be greatly improved by using better fixtures and using frictionless rotational mechanism, such as bearings.
Having said this, the main goal of this internship had not been achieved until this point, i.e.
4
Cleaning Techniques
Of all the possible ways to depowder or clean a sample, few cleaning techniques (namely Laser
shockwave cleaning (LSC), Ultrasounds, vibrations) are going to be explored. These techniques have been studied in depth and relevant literature is available explaining the underlying principles and dynamics of particle removal. A brief description on such techniques that have been explored
for depowdering during the course of this internship are provided in this part of the chapter, along with an additional possible cleaning technique that could be used but is limited in terms of available knowledge (Electromagnetism).
While there are many possibilities to depowder or clean a sample, not all the techniques were
studied in depth during the course of internship. Instead, the technique which has the most potential and has shown evidence of cleaning will be prioritized. The main decision factors for choosing the relevant cleaning techniques were the particle size to be removed, availability of
cleaning equipment, and has shown previous potential for cleaning for the respective particles under study.
An industry specializing in SLM production need to guarantee the final product is internally empty and clean. Certain industries such as electronic industries are constantly looking for efficient
ways to remove small particles (typically in the range of nanometers) from their products, for e.g., Si wafers. Minute particles of dust or other contaminants could affect the performance of the chip (Dunbaret al. (2007), Lammerset al.(2008)). Conventional cleaning techniques such as
wet cleaning, chemical cleaning, megasonics andCO2 cleaning are unable to meet the current
cleaning regulations and requirements of microindustries as they advance and produce much smaller (submicron and nanometers(Dunbaret al.(2007)) structures and samples.
Not enough data or information is present on the removal of particle from the surface of 3D printed
structures. As this internship primarily focuses on depowdering of metal structures produced by SLM, previous principles and data on particle removal for thin plates will be taken as a guideline to understand the particle removal behavior as under microscopic level. The particles can be viewed
as attached to a thin metal plate. The following techniques for particle removal are:
• Laser Shockwave Cleaning (LSC)
• Electromagnetism
• Chemical Flushing
• Vibrations and gravity
• Ultrasounds
4.1
Depowdering Techniques
4.1.1 Laser Shockwave Cleaning
One of the techniques for particle removal is via shockwaves produced by Lasers. The particles
are removed through a fast moving shockwave, which is generated via laser induced breakdown (LIB) of air. This happens when air is exposed to very intense electromagnetic wave, where the light of high energy pulse is focused in a very small volume. The Figure 9 shows the schematic
drawing of particle removal by laser breakdown.
Figure 9: ”Laser Shockwave Cleaning (LSC). The focused laser pulse creates small plasma above the contaminated surface. The plasma expands at such a high rate that it generates a shockwave.
The shockwave is used to remove the particles from the contaminated surface.” (Source: Master Thesis, Laser Shockwave cleaning, Technical University Eindhoven Lammerset al.(2008)).
Before each cleaning process, plasma is created every time at the focal point of the lens. This plasma results from air being ionized when the intense electromagnetic field of the laser starts the laser Induced Breakdown (LIB) of air. The LIB during the LSC process generates a highly
pres-surized air bubble which expands at supersonic velocity. A shock front is created which “sweeps” away the air in its wake. A spherically expanding shockwave is created by LIB by focusing the laser pulse at the focal point of convex lens. Given the nature of high pressurized air bubble that
is created during the process, there could be thermo-mechanical damage risk and heat radiation effects on the structure. However, this is minimized by using appropriate height above the surface at which the LIB is created, also known as the gap distance. Dunbaret al.(2007)
It should be mentioned that LSC has been performed on Si-wafers, more precisely on thin flat
plates with particles in the submicron and/or nanosized particles. There is limited experimental data available on micron-sized particles. The process is limited by the fact that LIB cannot be produced at low laser pulse energies. The LSC process has been done for Extreme Ultraviolet
(EUV) lithography where the particles to be removed are in nanometer range.
within the structure is out of the question as this can do serious damage to the structure. At this stage, it is not also possible to control the position of the plasma. The propagating waves
generally loose energy as they travel over the distance, and thus focusing particles in dead zones or long channels will be a challenge.
4.2
Electromagnetism
As of yet, there exists no data on cleaning by electromagnetism. Electromagnetism allows the possibility for creating an electromagnetic field and forces such that magnetic levitation can oc-cur. Levitation could be one of the methods for transporting loose particles out of the geometry.
Unfortunately, no simulation or experimental data is available to defend the cleaning effectiveness of this method. A simple model, however, could be constructed for a particle resting in electro-magnetic field. Since these forces are either repulsive or attractive in nature, these forces could
be manipulated such that they could transport loose particles in the electromagnetic field, either via levitation or external flowing fluid through the structure. Magnetic levitation already exists and forces in play are well understood.
Figure 10: Schematic representation of metal subjected to Lorentz, electromagnetic induction to levitate the object.
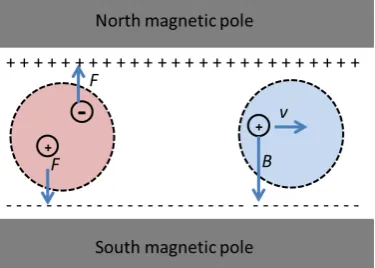
To visualize the setup, the schematics can be seen in Figure 10 and 11. Basically, a magnetic
lev-itation system such as depicted in Figure 10 having electromagnets will generate Lorentz forces. In the Figure 11, the entire region between the magnets have electromagnetic fields, however, to create an impression of how the electrical and magnetic forces act on the particle are shown
under colored regions where red expresses the electrical force whereas the blue region denotes the magnetic field.
Microscopically, the particles have electrostatic and electrical double layer as two adhesion forces. Primarily, these forces would need to be overcome for modeling particle removal behavior. Due
Figure 11: Schematic representation of individual particles subjected to electromagnetic field. For ease of visualization, red denotes electric field, whereas blue denotes the magnetic field. It should
be noted that the entire region within the magnets is under electromagnetic field.
was taken into consideration.
According to Dr. van Beurden, extensive experiment set up (Electromagnetic setup) is required
to perform cleaning experiments. Since the sample structure and the powder are of the same material, the structure and powder will have the same electrical charge and magnetic polarities under the electrical field and magnetic field respectively due to electromagnetic induction. Thus
manipulating such forces for reverse polarity or having a force at a specific point with in the sample structure is a challenge at the moment. Also, due to inverse square law, the energy density of the wave decreases inversely as the square of the distance from the source. Furthermore, the
electromagnetic field will have equal strength over the entire global region.
4.3
Chemical flushing
This technique makes use of chemical agents rather than an external equipment, as compared
to the cleaning techniques mentioned above. Instead of creating external forces (shockwaves or levitation), chemical agents that are widely used in industry for flushing purposes could be
applicable for the cleaning study. Since broad materials (metal, plastics, ceramics etc.) can be now be printed by 3D printing, not all the materials would be suitable for cleaning with chemicals, as they may either react violently or become victim to corrosion.
Extensive research would be required and there is no guarantee that the structure would remove
the powder. If the structure with an empty structure is densely packed with powder, the clean-ing agent may not be able to penetrate through these channels and might get deposited itself. Furthermore, quick test with water flushing through the 3D printed structure shows that the 3D
printed metals absorb water to certain extent. This could mean the same phenomenon could happen for such chemicals. A chemical agent could be made such that it is non-corrosive, has relatively low boiling point similar to Acetone such that it will not accumulate inside the channel
gravi-tational forces are in favor. The advantage compared to other techniques presented so far is that it does not require large external setup. This technique could be investigated, however, majority
of the cleaning chemicals pose an environmental hazard and extreme caution needs to be taken during the cleaning process. There is no such ”one” chemical agent that could be used for all materials. To gather this information would mean long hours of experimentations and determining
the types of chemicals specific for specific materials would require extensive trial and error. This is not possible during the course of internship, and thus this technique will not be considered at this time of study.
4.4
Vibrations and gravity
External vibrations enforced on the structure could also lead to detachment of particles from the vibrating surface. The vibrating surface should be oriented such that the gravitational forces
promote the powder removal. Similar technique to remove a particle from the surface has been discussed in Chapter 3, however this technique additionally uses external vibrations for particle removal. The effects of ”tapping” already shows promise for promoting particle removal.
Particle removal thus could also be done through vibration. Orientation of the structure plays a
crucial role at which maximum powder is removed from the structure. This is also what is found during the experiments and simulations.
While vibrations and gravity do remove particles, the results were not successful at this point. Extensive testing and experimentation for removal of particles via vibrations would be required for
the respective samples under study. Also, prior knowledge of materials properties is required to know the natural frequency of each and every sample structure. This requires extensive research. Regardless, a small experiment was done to validate the Gravity and vibration Model Simulation.
4.5
Ultrasonic Cleaning
Ultrasonic cleaning is extensively used for industrial cleaning applications. Ultrasonic waves are produced through transducers when an electrical field is applied to piezoelectric crystals. The
crystals vibrate and produce sound waves as a result of mechanical distortion caused by the electric field. Frequencies between 20 kHz and 1 THz can be produced depending on the
Figure 12: Schematic representation of metal submersed in water in a beaker held by a clamp.
Figure 12 represents the schematic view of ultrasound cleaning. The ultrasonic cleaning tech-nique for particle removal depends on mechanisms of acoustic cavitation and chemical solvation.
Cavitation forces can have undesirable effects on the structure being cleaned, and are generally hard to control whereas solvents are environmentally hazardous. According to Qi & Brereton, water is a great solvent and can be applied where low cavitation thresholds are desired. The
cleaning force is the shock waves produced by micro-cavity. These cavities or vacuum bubbles range from 50 to 150µm. As mentioned before, the particles of our interest are well under this range, furthermore the Ultrasound bath available for testing operates at ideal frequency range
(f=40 kHz) for particle removal Visser (1995, Table 5.1).
The cleaning parameters are primarily dependent on cavitation intensity. Cavitation depends on the frequency and amplitude of the radiating wave. It also depends on the mechanical properties of the acoustic medium, and the rheological properties of the liquid under turbulent and laminar
flow.
When the structure is submersed under water and exposed to ultrasounds, the particles sus-pended in the liquid oscillate and experience acceleration. What makes ultrasonic cleaning at-tractive is the ability to remove particles out of small pores and crevices (Visser, 1995, page
221). Thus, Ultrasounds look like the prime method for depowdering. In spite of being the favor-able choice for cleaning, other methods are still considered before making a final decision on the mode of cleaning.
4.6
Final selection of cleaning technique
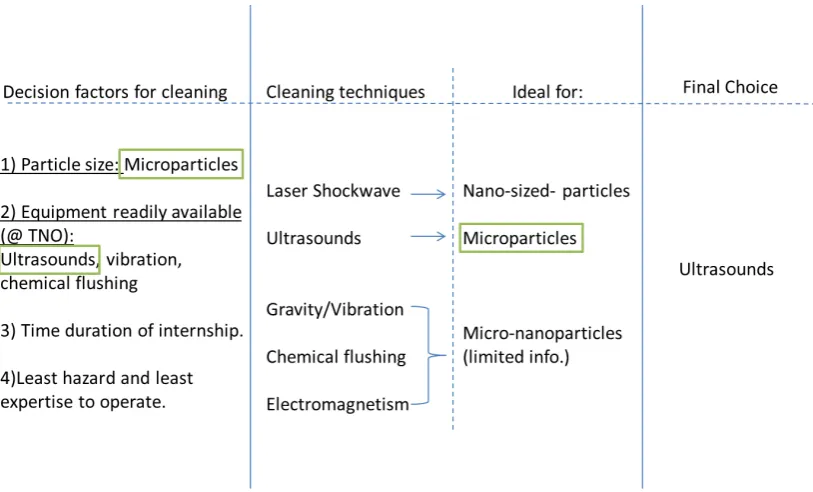
The main focus of this report is to find the efficiency of the method chosen for depowdering. A table with the benefits, limitations, risks and possible effects on structure have been tabulated
making. As is summarized in the decision table, the main factor that influenced the decision for cleaning technique was the size of particles to be cleaned. Of all the techniques mentioned
in the table, Ultrasound and the respective equipment are readily available at TNO for testing, whereas the rest of the cleaning techniques require additional times on making the setup. Since the particles in micron-sized range are investigated, time limitations and requirement for high
[image:28.595.105.512.226.472.2]degree of cleanliness of complex structures with internal channels. As a result ultrasonic cleaning is the selected choice for cleaning.
Vibrations and gravity
- Least expertise required
- Particle removal by excitation - Not much equipment needed - Ease of use
- Vibration will detach particles
visual and internal inspection - Need to know the ideal orientation
- Need to know natural frequencies of all available material
-If vibrations = resonance frequency, structure will be heavily affected
- Structural damage and mechanical failure if fnatural = fresonance
Frequency generator
Laser shockwaves
- Improved properties of dense material
- No thermal stresses induced
- Energy density could be varied to target different sized particles
- Longer cleaning process (2 - 3 runs)
-Waves may not propagate into the tubes
- Skilled operator
- Small gap distance (LIP and substrate) could induce thermo-mechanical effects (d<1mm) - Selection of wavelength
- Focuses removal of particles 100 – 200 nm
- Overheating, structure damage, internal damage
- Laser Irradiation
- Microstructure: Extensive plastic deformation @ Pshcokwave >> Yeild strength
- Hardness: Increased Hardness on the surface
- Tensile Strength: Increased - Residual Stresses: Compressive yet uniform throughout the radius of laser shocked region
- Fatigue: Significantly improved life-cycle
- Q-Switched Nd:YAG laser - Argon gas - Protection gear
(Electro)Magnetism
-Individual or cluster of powder could be controlled at the same time
- Creating Maglev may be challenge
- No previous knowledge
- Entire structure and powder being equally electromagnetically induced
- Powder stuck in deadzones will be stuck to the internal wall
- Entire structure being magnetised. - Increased adhesion
- Electromagnets - AC coils
Ultrasonic
- Ideal for micron sized particles
- Different frequencies target different particle sizes
- Demi water enhances particle removal (Environment
friendly)
- Reflection from acoustically “hard”,
- Can remove micron sized particles (0,1, 1, 10 micron) - Long cleaning times
- Selection of solvent for respective material
- Chemical reaction between solvent and material
- Wrong intensities could damage the
structure (more cavitation) - Ultrasound set-up
Chemical flush - Non-corrosive
- Low Boiling point
- Evaporates at RTP
- Toxic
- Contamination - Health risks - Flammable
- Proper ventilation needed
- Possible contamination and
[image:29.595.111.720.85.489.2]corrosion - Acetone solution
Figure 14: Summary of all discussed cleaning techniques with pros and cons.
5
Ultrasonic cleaning
As can be seen in Figure 15 ultrasounds have different applications specific to different frequen-cies. The required frequency range for ultrasonic cleaning application is 20-40 kHz. Such an ultrasonic bath is available within TNO. In addition, there were already 3D printed samples that
vary from simple geometries to complex geometries. Ultrasonic cleaning is then performed on these samples.
Figure 15: Acoustic frequency scale and selected applications
During ultrasonic cleaning, the most important phenomenon for particle removal is cavitation. As
the ultrasonic waves propagate through the water medium in the bath, compression and rarefac-tion of the medium molecules occurs. This results in implosion of cavitararefac-tion bubbles. The collaps-ing micro-bubbles could reach high localized temperatures and pressures ((Mittal & Jaiswal, 2015,
page 207)) which are able to produce high shear energy waves and turbulence in the cavitation zone. Also, the cavitation bubble size is inversely proportional to the frequency.
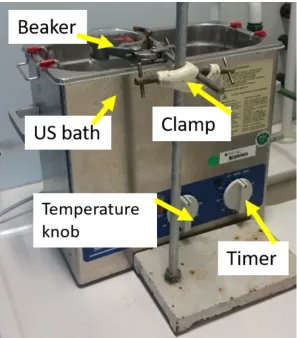
The apparatus was placed under a lab fume hood due to safety regulations. The airflow inside the fume hood is faster than the outside room. Under faster airflow, the rate of evaporation of water
increases compared to natural airflow in the room. During long operation of ultrasound (more than 2 hours) the temperature of the water in the ultrasound bath can reach high temperatures. Higher temperatures also promotes the rate of evaporation and thus the water in the bath decreases. If
the amount of water in the bath is lower than the recommended level fill, the cleaning performance will be reduced. Therefore, more water had to be added to the bath every hour to ensure the water remains at the optimum level during operations.
During cleaning experiments, each respective sample is placed in a demineralized water solution
Figure 16: Bransonic Ultrasound bath
can pass through the glass beaker without losing its energy and is thus used to prevent damage
and fouling of the water bath and tank.
To account for the limitation of functionality of the equipment during required long hours of cleaning (beyond office hours), the experiment was modified where two water bottles are added upside down to the setup. The bottle accounts for any evaporation losses occurring in the bath and
the glass beaker respectively, during the operation by simultaneously maintaining the water at minimum operating level at all times. The set up can be seen in Figure 17.
5.1
Ultrasonic cleaning of the samples
Ideally, freshly 3D printed samples should be used for checking the level of cleanliness achievable from the ultrasound waves. TNO does not produce or manufacture 3D printed metal samples. Rather the metal material parts and samples are delivered by external manufacturer specializing
in 3D printing, namely NLR5 and ASML6. Requesting new single customized complex samples
Figure 17: Ultrasonic cleaning setup for 24 hours with 1 bottle for beaker and 1 bottle for bath
from NLR is too expensive unless ordered in batches. Moreover it would take roughly about a month to receive a sample. Thus, the available printed samples will be used for testing. The
samples have been previously cleaned via compressed air or chemical flushing.
A total of six different 3D printed metal samples available within TNO were used for cleaning
exper-iments. In the beginning, the cleaning experiment was first done on a stainless steel cooling jacket (Figure18). As the internship progressed, new samples became available and were received one
after another. The second cleaning experiment was done on an aluminum alloy (AlSi10Mg) pixel (Figure 19), followed by ultrasonic cleaning of a stainless steel pipe fitting (Figure 20), concluded by cleaning of 2 stainless steel plates (designated A15 and A16 for ease of identification)(Figure
Figure 18: Stainless steel cooling jacket
Figure 19: Aluminum alloy pixel AlSi10Mg
[image:33.595.236.374.330.495.2]Figure 21: Stainless steel plate A15
Figure 22: Conventional hex nut
Figure 23: Conventional stainless steel metal plate
[image:34.595.227.398.444.565.2] [image:34.595.226.397.600.710.2]5.2
Experimental Procedure
Before doing the cleaning experiment, the samples were placed in preheated oven at1500C for a
minimum of ten minutes. The temperature of the oven is selected to reach an ideal environment that will ensure there is no moisture content within the test samples under the given time frame.
Since the changes in weight will give an indication on the amount of powder removed(cleaned) from the samples under ultrasound cleaning, the samples were weighed to know the initial weight (Wo).
When the first series of experiments were done, only the stainless steel cooling jacket sample was
available for immediate testing. Naturally, the first cleaning experiment was done on the stainless steel cooling jacket sample. For this sample only, stainless steel powder (readily available within TNO) is first filled in to the sample. Prime reason for filling the sample with powder is to emulate a
freshly printed filled sample. The sample is reweighed (Wsp) and the amount of powder (Wpow d er) that is present within the sample is now known. The weight of the powder inside the sample is calculated by Equation 5.1
Wpow d er =Wsp−Wo (5.1)
whereWpow d er is the weight of stainless steel powder in the sample, Wsp is the weight of the sample with powder andWois the initial weight of the sample without powder.
The sample is then placed in the glass beaker submerged in the ultrasound bath for different time
duration and the cleaning experiments can begin. The sample is reweighed after each cleaning cycle; the drop in weight indicates how much powder has been removed after each cleaning cycle. The sample was also visually inspected for damages after every cleaning cycle.
As the cleaning experiments on the cooling jacket sample progressed, the results from initial
cleaning of the stainless cooling jacket sample were not promising. After few consecutive series of cleaning experiment on the sample, the weight of the cooling jacket surpassed its initial weight (Wo). The sample continued to show indefinite weight loss. The time to cleaning hours could
not be determined. Unfortunately the results are unreliable and cannot provide a good indication of cleaning via ultrasounds. Thus, a series of cleaning tests were then performed on conven-tional mass produced stainless steel samples to see whether the same phenomena is observed.
These samples did not lose any weight under ultrasound cleaning and thus it was concluded that the cooling jacket sample is faulty. To confirm this theory, the stainless steel cooling jacket was tested under microscope where large voids are seen in the surface of the sample. The other 3D
printed samples (Aluminum pixel, stainless steel pipe fitting and steel plates [A15, A16]) were then received in the order stated.
It was brought to attention that Al pixel and ASML pipe fitting have been previously cleaned via air and/or chemical flushing. To test whether these samples were in fact clean, no additional powder
are simple solid metal plates, stainless steel powder was not used for filling the sample.
The latter samples performed well under the cleaning experiments. The samples (apart from stainless steel cooling jacket) did reach a limit to which they could be depowdered. The cleaning
limit was reached when there was no subsequent weight drop of samples from its predecessor weight. To confirm the limit, a final cleaning experiment is done for each sample where the final weights of the sample after cleaning experiments are compared to its former weight just before
the final instant of cleaning experiment. No net difference in weights concludes the experiment and thus the limit to which a sample can be cleaned. The results of each respective sample are presented in the following section of the report.
5.3
Results from ultrasonic cleaning
The cleaning results through the use of ultrasounds did in fact show promising results. These are tabulated below for each respective sample. The observations made during the cleaning
experiments are also discussed briefly.
5.3.1 Stainless steel cooling jackets
The first cleaning experiment was performed on the stainless steel cooling jacket sample. The initial weight of the sample before the experiment is Wo = 80,6773g. Stainless steel powder (LPW316L) was used to fill the sample, where theWsp = 80,8424g. As can be seen from Table
3, the first column shows the number of cleaning cycles required to depowder, the second and the third column represent the subsequent weight changes as a result of cleaning under certain duration. The difference of the weight is calculated to know how much powder is removed from a
sample at each instance of cleaning. At cleaning cycleC2, the weight of the sample was found to
be lower than initial weight (80,6599g<80,6773 g).
During the cleaning experiment, it was noted that the stainless steel cooling jacket samples con-tinued to show weight loss after prolonged cleaning. There are two speculations for weight loss:
1) There is still powder inside the sample, 2) Corrosion. Due to the geometry of the sample, the first assumption could be over-ruled since there are no dead spaces present within the sample. The sample can be seen with inter-connecting simple straight inlet and outlet holes, depicted in
Figure 25. As can be seen, the sample has no complex internal chambers or dead spaces. To confirm the latter speculation, conventionally produced stainless steel pieces were experimented
with ultrasounds. With the cleaning experiment, it could be concluded that there is no weight loss by corrosion. To understand the reason for weight drop, the sample has been then inspected via microscope to check the sample properties of the structure. It was found that the sample had poor
density packing and consisted of large voids and cracks. It was also discovered that the sample had been printed at the stage where little was known about SLM in terms of structure integrity.
Table 3: Ultrasonic cleaning of stainless steel cooling Jacket
Clean Initial Weight Duration Difference
Cycle (C) weight(g) After cleaning (g) (g)
0 80,8424 N/A N/A 0
C0 80,8424 80,6979 10 minutes 0,1445
C1 80,6979 80,6886 15 minutes 0,0093
C2 80,6886 80,6599 30 minutes 0,0287
C3 80,6599 80,6531 1 hour 0,0068
C4 80,6531 80,6503 1 hour 0,0028
C5 80,6503 80,6487 1 hour 0,0016
C6 80,6487 80,6457 10 hours 0,0030
C7 80,6457 80,6421 30 minutes 0,0036
C8 80,6421 80,6403 1.50 hours 0,0018
C9 80,6403 80,6341 24 hours 0,0062
C10 80,6341 80,6196 24 hours 0,0145
Total Duration Net Difference
64 hours 0,2228(g)
.
Figure 25: Internal view(Represented by blue color) of the stainless steel cooling jacket
be seen in Table 4 till 6 where no apparent weight loss is observed regardless of varying the
Table 4: Ultrasonic cleaning of conventional stainless steel Hex nut
Clean Initial Weight Duration Difference
Cycle (C) weight (g) after cleaning (g) (g)
C0 3,9549 3,9549 15 minutes 0
C1 3,9549 3,9549 20 hours 0
Total Duration Net Difference
20.25 hours 0 (g)
Table 5: Ultrasonic cleaning of conventional metal stainless steel plate
Clean Initial Weight Duration Difference
Cycle (C) weight (g) after cleaning (g) (g)
C0 74,6335 74,6316 2 hours 0,0019
C1 74,6316 74,6316 4 hours 0
C2 74,6316 74,6316 2 hours 0
Total Duration Net Difference
6 hours 0,0042(g)
There seems to be some weight loss in the case of the metal stainless steel plate. This is ex-plained by the fact that there were holes drilled in the metal plate. These have not been deburred
to great accuracy, and hence particles were lost as a result. As can be seen from the results, after first cleaning cycle, it does not lose further weight.
Table 6: Ultrasonic cleaning of conventional stainless steel bolt nut
Clean Initial Weight Duration Difference
Cycle (C) weight (g) after cleaning (g) (g)
C0 19,552 19,552 15 minutes 0
C1 19,552 19,552 4 hours 0
C2 19,552 19,552 2 hours 0
Total Duration Net Difference
6.25 hours 0,0000(g)
During the cleaning experiments, it could be observed that there were two ways on how the powder that was removed behaved under the water. It should be noted that stainless steel (ρss =
7.99g/c m3) has higher density than water (ρ
w ater = 1g/c m3). Regardless, a small amount of powder was seen to float on the surface of the water. This powder is rather ”loose” in nature, and some powder (packed) could be seen resting on the bottom of the beaker. This can be explained by surface tension of the water. Packed powder at the bottom has higher packing compared to
they have been shown in Figure 26 and 27.
Figure 26: Removed powder over bubble
Figure 27: Powder removed
5.3.2 Aluminum alloy pixel (AlSi10Mg)
The above sample did not give indication of the cleaning efficiency via ultrasounds. Thus, the next sample with better material properties was needed to conclude whether ultrasounds is indeed
an effective method for cleaning. For this, the next sample received was the Aluminum pixel. The Aluminum pixel has been designed by TNO but printed at NLR. So far this is one of the
most complex sample compared to other samples under study. This pixel has internal fins and has orifices of less than 1 mm in diameter. The section view is given in Figure 28 to show the complexity of the shape.
When the Aluminum pixel was handed, it was mentioned that this sample was previously ”cleaned”.
To confirm this statement, the cleaning experiment was performed on the sample as it was re-ceived. Moreover the fact that it has been cleaned before, made it a prime sample for cleaning under ultrasounds since technically it should not lose weight. The initial weight of the sample is
Wo= 26,5959g. The results of cleaning are tabulated in Table 7.
As can be seen from the Table 7, the sample did lose weight and does have a limit to which it can
[image:39.595.226.398.267.450.2]Figure 28: Cross-section view of Aluminum pixel
Table 7: Ultrasonic cleaning of Aluminum pixel (AlSi10Mg)
Clean Initial Weight Duration Difference
Cycle (C) weight (g) after cleaning (g) (g)
C0 26,5959 26,5487 1 hour 0,0472
C1 26,5487 26,5481 1.50 hour 0,0006
C2 26,5481 26,5214 22 hours 0,0267
C3 26,5214 26,5178 2 hours 0,0036
C4 26,5178 26,5178 2 hours 0,0000
Total Duration Net Difference
28,5 hours 0,0781(g)
cycles. Considering the time required for cleaning, the particles were removed at 2,9 mg/hour for a total of 26,5 hours. The sample is placed for another 2 hours (C4) as a final test and no further
decrease is noticeable. This means that the sample is powder free and should not have internal blockages during its function.
5.3.3 Stainless steel pipe fitting
Obtaining successful result from one sample is not enough. Hence, additional experimentation is required. The next sample received for cleaning experiment was the stainless steel pipe fitting
Table 8: Ultrasonic cleaning of stainless steel pipe fitting
Clean Initial Weight Duration Difference
Cycle (C) weight (g) after cleaning (g) (g)
C0 49,8167 49,8153 1 hour 0,0014
C1 49,8153 49,8149 1.50 hour 0,0004
C2 49,8149 49,8149 2 hour 0,000
C3 49,8149 49,8149 5 hour 0,000
Total Duration Net Difference
9.5 hours 0,0018(g)
Unexpectedly the sample did lose particles. A total of 1,8 mg of sample particles was found to have been lost from the sample before it comes to limit where no further decrease is seen. The limit point can be observed in third cleaning cycle (C2). Two additional cleaning cycles of 2 hours
and 5 hours each were further conducted to see whether additional particles are lost or not. No net difference in the weight concluded that no further particle removal is possible. The sample lost a total 0.72mg/hour in about 2.5 hours of cleaning. Regardless of being cleaned previously
prior to ultrasonic cleaning, the sample still lose weight. These were relatively removed with ease within a total of 2.5 hours. The sample is now clean.
5.3.4 Stainless steel metal plate A15 and A16
Discussing the findings of the Stainless Steel Cooling jacket with the supervisor, two individual 3D printed metal plate samples (designated A15 and A16) were then given and placed under
ultrasound baths. The two experiments differ in the operating temperature conditions: A15 was cleaned at ambient conditions whereas A16 is cleaned at600C. These metal plate samples have
better mechanical properties compared to the stainless steel cooling jacket sample. The results
from cleaning A15 are given in Table 9.
Table 9: Ultrasonic cleaning of metal stainless steel A15
Clean Initial Weight Duration Difference
Cycle (C) weight (g) after cleaning (g) (g)
C0 17,7546 17,7538 2 hours 0,0008
C1 17,7538 17,7527 6 hours 0,0011
C2 17,7527 17,7520 6 hours 0,0007
C3 17,7520 17,7512 7,5 hours 0,0008
C4 17,7512 17,7509 7 hours 0,0003
C5 17,7509 17,7509 6 hours 0
Total Duration Net Difference
Even though complex samples were aimed for cleaning, this sample still gives good insight in to the cleaning. The stainless steel metals A15 and A16 are identical in nature and the results
(compared to stainless steel jacket) are much more promising as can be seen in the Table 9 & 10. The only difference was changing temperature settings to see how it is influenced by temperature changes. Generally, higher temperatures promote the efficiency of cleaning due to
higher cavitation intensity, and heat eliminates entrapped air in the water.
Table 10: Ultrasonic cleaning of metal stainless steel A16
Clean Initial Weight Duration Difference
Cycle (C) weight (g) after cleaning (g) (g)
C0 17,7406 17,7388 5,5 hours 0,0018
C1 17,7388 17,7384 5 hours 0,0004
C2 17,7384 17,7367 6 hours 0,0017
C3 17,7367 17,7364 7 hours 0,0003
C4 17,7366 17,7366 4 hours 0
Total Duration Net Difference
27,5 hours 0,0042(g)
As can be seen from the Table 9, the sample A15 loses a total of 3,7 mg at a total cumulative cleaning time of 28,5 hours, or the particles are removed at 0,13 mg/hour, whereas from the Table 10 the sample lost a total of 4,2 mg at a total cumulative cleaning time of 23,5 hours, or the
particles are removed at 0,17 mg/hour.
Regardless of both samples being identically the same, the first metal plate sample (A15) was placed under normal operating conditions for cleaning(no heat addition via temperature knob (Tbath = 00C)). The second metal plate sample (A16) was cleaned at Tbath = 600C. This was done to see whether additional heat improves the efficiency of cleaning. It can be seen that the total cleaning time for A16 has been reduced by5hours.
It can be thus concluded that ultrasound does in fact promote particle removal. Higher tempera-tures reduce the cleaning time. No damage to the sample can be seen. The individual samples
have also been tested for 24 hours during one instance of cleaning cycle. Apart from discoloration of Aluminum pixel (AlSi10Mg), there was no apparent damage to the sample. Furthermore, tests have been done on conventionally produced metal samples to use it as a benchmark and check
for corrosion.
Figure 29: Total time and amount of particles removed per sample
In Figure 29, the amount of powder removed is represented by horizontal pattern bars whereas the the vertical pattern bars represent the total time it takes to clean the samples. In addition, the 3D printed samples have been graphed first followed by conventionally manufactured samples.the
3D printed samples have been graphed first followed by conventionally manufactured samples.
It must be mentioned that even though the conventional manufactured samples did not lose weight, it simply projects how long it had been under ultrasound exposure. From Figure 29, it can be seen that A15 took the longest time to clean. Comparing A15 with A16, it took 6 hours
less to clean. This is due to the fact that A16 was cleaned at higher temperature. The least amount of hours taken to clean was by stainless steel pipe fitting. The Aluminum pixel lost the most weight. More complex the shape is, the more difficult it is to depowder. It can be concluded
that the samples have been cleaned to great degree. However, it must be stated again that these samples are not freshly printed. Tests still need to be done with freshly printed metal parts to compare how the freshly printed structures perform.
Care should be exercised when the experiments are performed. According to material safety
data sheet (MSDS) of stainless steel powder from the manufacturer, stainless steel powder is considered hazardous material that can pose serious risk to life. Furthermore, if the water is not regulated in the ultrasound bath, the experiment will run at infinite time until it either becomes
non-operational or causes serious damage in its surroundings. To account for this, the experiment was conducted in Fume hood at all times, and 24 hour setup was devised.
that even after exposing it to more than 30 hours of accumulative cleaning, it still lost weight. This was a concern since the sample is quite simple in design, having no internal dead spaces. To
understand the reason, the sample was studied at the microscopic level. It was found that the structure is full of voids, cracks and the packing density is extremely poor. Thus, the particles that were loosely attached with the internal wall, could have easily become detached during the
cleaning process. This material was then replaced with ”state-of-the-art” printed stainless steel metal plate, and the results proved to be better in outcome.
5.4
Equipment for Imaging
To investigate the materials at microscopic level, light microscopy, SEM imaging and acoustic imaging were done. The equipment is available in TNO. The analysis provided great insight into material properties.
5.4.1 Light Microscopy
The Light Microscope at TNO, as can be seen in the Figure 30 uses a system of lenses and
visible light to produce magnified images of small samples. Olympus KL 1500LCD acts as the light source for the microscope. Images under the microscope can be magnified from 8x-56x.
[image:44.595.372.505.433.566.2](a) SZX7 Zoom Stereo Microscope (b) Olympus KL 1500LCD Light Source
Figure 30: Optical Light Microscope
5.4.2 Scanning Electron Microscope
Another equipment available at TNO is the Quanta 600 Scanning Electron Microscopy (SEM). The instrument requires an expert to operate for which help of Margo Segers was taken. The
Figure 31: Quanta 600 Scanning Electron Microscopy
5.4.3 Acoustic Imaging
Material inspection can also be done on layer-by-layer level by a far more advanced and robust
microscope instrument, the Sonic ECHOTMscanning acoustic microscope. The instrument also
requires an expert to operate, and help of Dr. Fischer was taken. The microscope can provide
great in-depth properties of the material.
[image:45.595.256.367.431.577.2]Stainless steel powder was inspected using the SEM magnified images by 1000x. This can be seen in Figure 33 where the powder is spherical in nature.
Figure 33: Scanning Electron Microscopy of stainless steel 316L powder 1000x magnification
The SEM image of stainless steel jacket can be seen in Figure 34. From the image it can be seen that the particles are not sintered well to each other. Gaps and voids can be seen and it appears
that the particles are on top of each other rather than besides each other. Since the particles can be clearly designated, it means the original particle grains were not completely molten during the 3D printing. This can be seen in Figure 34. Thus it can be explained why the sample kept loosing
powder. The powders that appear to be on top of each other must be loosely adhered and hence are relatively easy to remove under ultrasonic cleaning.
Figure 34: SEM of stainless steel cooling jacket 250x magnification
Compared to the stainless steel plate (A15), the particles can be seen better adhered to the
surface. The packing density is good and minimum voids are observed. This can be seen in Figures 35a and 35b. It can also be seen that the particles are much better molten and layered within the sample of A15 compared to prominent visible particles in the stainless steel cooling
A15 is the fact that it was manufactured when research on ideal conditions for well sintered 3D samples during printing was ongoing.
[image:47.595.111.516.149.331.2](a) 1000x magnification of cooling jacket (b) 1000x magnification of A15 metal plate
Figure 35: SEM of stainless steel cooling jacket and A15
5.5
Measuring angle of repose
5.5.1 Angle Of Repose
Angle of repose is the angle at which the powder rests at a steep angle and is at stable condition where no slipping occurs. Stainless steel powder is poured from a beaker to the filter where the
powder flows steadily in large volumes. The angle of repose is calculated from Equation 5.2.
tanΘ0=hei ght
r ad i us (5.2)
where the height is the height of the cone of powder and the radius refers to half the diameter of the cone. The height of the cone is measured Such experiment indicates that the powder is stable
at angle 250.
[image:47.595.205.419.621.723.2]