Original citation:
Birrell, Stewart A. and Young, Mark S. (2009) Smart driving aids and their effects on driving performance and driver distraction. In: 1st International Conference on Driver Distraction and Inattention, Gothenburg, Sweden, 28-29 Sep 2009 pp. 1-16.
Permanent WRAP url:
http://wrap.warwick.ac.uk/53205
Copyright and reuse:
The Warwick Research Archive Portal (WRAP) makes this work of researchers of the University of Warwick available open access under the following conditions. Copyright © and all moral rights to the version of the paper presented here belong to the individual author(s) and/or other copyright owners. To the extent reasonable and practicable the material made available in WRAP has been checked for eligibility before being made available.
Copies of full items can be used for personal research or study, educational, or not-for-profit purposes without prior permission or charge. Provided that the authors, title and full bibliographic details are credited, a hyperlink and/or URL is given for the original metadata page and the content is not changed in any way.
A note on versions:
The version presented in WRAP is the published version or, version of record, and may be cited as it appears here.
SMART DRIVING AIDS AND THEIR EFFECTS ON DRIVING
PERFORMANCE AND DRIVER DISTRACTION
Stewart A Birrell
1*, Mark S Young
21
Human Centred Design Institute, School of Engineering and Design, Brunel University, Uxbridge,
Middlesex, UB8 3PH, UK. [email protected]. +44 (0)1895 267178.
2
Brunel University, UK
ABSTRACT
In-vehicle information systems have been shown to increase driver workload and cause distraction; both of which are causal factors for accidents. This simulator study evaluates the impact that two designs for a smart driving aid and scenario complexity have on workload, distraction and driving performance. Results showed that real-time delivery of smart driving information did not increase driver workload or adversely effect driver distraction, while having the effect of decreasing mean driving speed in both the simple and complex driving scenarios. Subjective workload was shown to increase with task difficulty, as well as revealing important differences between the two interface designs.
INTRODUCTION
Background
Modern vehicles contain an increasing amount of instrumentation, as a combined consequence of factors including the motivations of vehicle manufacturers, advances in technology and consumer demand. However, this added information available to the driver raises significant ergonomic concerns for driver mental workload, distraction and ultimately driving task performance. In-vehicle information systems (IVIS) can distract the driver (see literature below), and distraction is a causal factor for accidents. Whilst the implementation of legislation designed to reduce driver distraction, namely the banning of hand held mobile phone use1, may help to tackle the symptoms of the problem, a more ergonomic approach would be to treat the cause by focusing on the appropriate design of in-vehicle systems.
Driver Distraction and Road Accidents
Although these analyses found little evidence of distraction from IVIS systems, this is likely due to the age of the database being interrogated (Stevens & Minton, 20013, used data from 1985 to 1995). As a reflection of this, only 3% of distraction-related accidents were due to mobile phone use. Nevertheless, as has been widely reported, there has been an increasing emphasis in recent times on the role that IVIS-related driver distraction plays in the number and severity of road accidents. This issue will only become more apparent with the increased number and sophistication of in-vehicle information systems available3.
IVIS and driver distraction
Mental workload is a particular issue with IVIS systems. Driver overload with an additional task or interface in the vehicle can adversely affect performance7,8, particularly if workload is already high (e.g., in urban driving9) or if the driver has a lower capacity to respond (e.g., in the elderly10). Studies have shown that while conducting a difficult cognitive task (such as maths addition), drivers spend less time looking at areas in the peripheries (such as mirrors and instruments) and instead focus on looking centrally ahead11. Even though time looking outside of the vehicle remained unchanged, these results suggested a change in drivers’ allocation of attention.
Whilst the presence of such a secondary task can increase the potential risk of an accident or incident, it is thought that other contributing factors also have to occur at the same time for the risk to manifest itself12. Contributing factors may include the presence of a junction, urban driving or unexpected events. Such factors can impair the reactions of a distracted or overloaded driver since their spare attentional capacity has been absorbed by the secondary task.
Figure 1 (taken from Angell et al, 200612, pp. xxviii) shows how these factors can combine to increase the risk of an accident occurring.
Figure 1 – Safety relevance of driver workload matrix (taken from Angell et al, 200612).
The Foot-LITE Project
[image:3.595.134.466.490.636.2]to embrace the ‘eco revolution’. As well as developments in low carbon vehicle technologies, more recently the market has seen a number of ‘green’ IVIS interfaces aimed at encouraging environmentally friendly driving. Meanwhile, safety concerns continue to drive progress with advanced driver assistance systems (ADAS), many of which include an additional interface to the driver. The proliferation of such systems and information overload in the car could pose a potential threat to driver distraction, resulting in the opposite effects to those desired.
The Foot-LITE project aims to bring some of this information together on a single, integrated interface, providing driver feedback and advice on aspects of safe and green driving style. Foot-LITEa represents a UK consortium of six commercial companies, three governmental/charity organisations, and three universities, funded jointly by the Technology Strategy Board, UK Department for Transport and the Engineering and Physical Sciences Research Council. The system ostensibly comprises two aspects: an on-line (i.e., in-car) interface providing real time feedback and advice on driving style, coupled with an off-line (post-drive) data logging system which can help to inform transport choices. Whilst there already exist some off-the-shelf, in-car monitoring systems which can provide information on fuel consumption or post event data recorders15,16,17,18, none of these as yet provide detailed feedback to the driver in real-time enabling them to refine their behaviour to actually improve driving efficiency and/or safety, which Foot-LITE aims to achieve. Moreover, Foot-LITE also aims to balance feedback on safe driving styles with eco-driving techniques, which may or may not be in conflict (see Young et al, 200819, for a discussion).
Although it might seem counterintuitive to use another potential distraction in an effort to improve safety, the statistics favour this approach. Mosedale et al (2004)2 showed that 2% of accidents were a result of driver distraction, whereas over 90% of accidents were as a direct result of poor driving or inappropriate driving behaviour. Clearly, though, the biggest challenge with any such system is to encourage positive behaviour change in drivers whilst avoiding the negative effects of driver distraction that the new interface could induce. The solution to this problem lies in the interface design.
Foot-LITE Interface Designs
In order to achieve the goals of changing driving style while avoiding negative effects of distraction or increased workload, the in-car interface in particular needs to be designed with the driver’s information requirements in mind. Two human machine interface (HMI) designs were conceived, both very different to each other, and both refined through a rapid prototyping study20, which led to the designs used in this study. Previous work conducted for the project established the principal information elements to increase fuel efficiency and safety, namely correct gear change, reducing unnecessary acceleration and braking events (related to fuel efficiency); and appropriate headway, lane position and lane deviation (related to safety). Both of the interface designs display these parameters, maintaining information equivalence across each – it is simply the format of presentation which varies.
The first interface design was generated based on principles of Ecological Interface Design (EID21), following the completion of a Cognitive Work Analysis (as reported by Birrell et al, 200822). EID is an approach to interface design that was introduced specifically for complex socio-technical, real-time, and dynamic systems. It has been applied successfully within a
number of work environments, including process control, nuclear, petrochemical, military and aviation domains21, and in a more theoretical manner within vehicle interface design23,24. Specifically relevant to the Foot-LITE project, EID offers to dynamically reflect the driving environment and integrate complex information onto a single, direct perception display. Hence all of the safety and eco-related parameters are shown on the screen at the same time, with all parameters changing in real-time depending on the driver’s inputs.
As an alternative to the EID concept, a more conventional dashboard-type interface (DB) has also been developed according to best practice in the human factors literature. Initially this was based on a vehicle instrument panel layout; the DB interface consists of a series of warning icons with corresponding textual information. The basic principles of the design are that only one parameter is shown to the driver at any one time, this being the parameter which was deemed to be the highest priority, the interface then ‘scrolls’ through the relevant warning icons. The DB design is intended to offer familiarity to drivers, being akin to standard instrument panels, warning messages and icons available in most vehicles.
Following the rapid prototyping study20, the refined EID and DB interfaces were subject to more rigorous testing in the Brunel University Driving Simulator. The primary aim of the study was to assess the impact that these smart driving aids may have on driving performance and driver distraction. Additional aims were to compare the efficacy of the smart driving aids and determine if they do foster the positive, and intended, changes in driving behaviours. The simulator testing represents a filtering stage in the Foot-LITE development process, to select one design to be taken forward to the next stage of user evaluation.
METHODOLOGY
Experimental Tools
Driving Simulator
The Brunel University Driving Simulator (BUDS) was used for this study. BUDS is a fixed-based immersive simulator with a 2006 Jaguar S-Type as the donor car. The driving simulator software is provided by STISim (Systems Technology Inc, Hawthorne, CA; Build 2.08.04), which has updated graphics hardware enabling a real-time, fully-textured, anti-aliased, 3-D graphical scene of the projected virtual world. The images are projected via three Toshiba TDP-T95 digital projectors onto three 2.5 m x 2.1 m (viewable area) screens at a resolution of 1280 x 1084 pixels, thus giving the forward facing scene plus the left and right peripheral scenes. In total from the driver’s seat the projection covers a 150˚ horizontal and 45˚ vertical field of view. Simulated images of the dashboard instrumentation as well as rear view and side mirrors are projected onto the viewing screens. The simulator is controlled by a Logitech multimedia driving unit (G25 Racing Wheel) consisting of steering wheel, gear lever and pedal block (including clutch pedal), fitted in the donor car as a UK-standard right-hand drive vehicle. The Logitech driving unit allows for simulation of manual or automatic transmission, with manual being used in the present study. The frame rate and data capture rate throughout the study were fixed at 30 Hz.
As the main aim of this study was to evaluate the potential effects on driver distraction and performance as a result of using a smart driving aid, an in-vehicle HMI was needed to present this information to the driver. To achieve this, a 7” colour screen (Dicoll Ltd Model W07T740-OFA3) was placed in the vehicle. This was located on the centre console to the left of the steering wheel to enable ease of viewing without blocking the drivers’ view of the road ahead. The screen was linked via cable to an additional PC which drove the HMI, and this PC in turn received a data stream from the simulator machines to feed the HMI. The HMI thus gave real-time feedback via either the EID or DB interfaces as described above.
Experimental Design
A 3 (interface design: Baseline, EID and DB) x 2 (driving cycle: Urban and extra-urban) within-subjects experimental design was utilised for this study. Dependent variables included objective and subjective metrics of driving performance and driver distraction and workload.
Driving Scenarios
Two different types of driving scenario were developed for this study, both based on the New European Drive Cycle (NEDC) against which standard emissions data are tested. The first scenario was an urban cycle which consisted of driving in a city environment with two 3 m wide lanes (including a 1.5 m wide lane for parked traffic on the left of the two driving lanes). The same setup was used for oncoming traffic on the right hand side of the road, with no barrier between the two directions of traffic. A series of eight traffic light controlled intersections were placed at specific locations, either with or without pedestrian crossings. The speed limit throughout was 30 mph. The scenario was 2.5 km from start to finish and took approximately 5 minutes to complete. In order to limit a learning effect of repeating the scenario two different versions were created. Both were based on the same physical road infrastructure (i.e. intersection locations and road layout), but traffic light sequences and divided attention events (see next section) were changed.
The second driving scenario was an extra-urban cycle consisting of a dual carriageway with varying speed limits. The road again consisted of two 3 m wide lanes on each side of the carriageway. In an effort to mirror the NEDC this scenario was again approximately 5 minutes long with the first 3 minutes at a speed limit of 40 mph, followed by 1 minute of driving at a speed limit of 60 mph, finishing with approximately 1 minute of national speed limit (i.e., 70 mph). Within the extra-urban cycle, the driving environment changed from a more urban setting (with shops, offices, bus stops, petrol stations etc. set back off the main road and a barrier separating the two directions of traffic) within the 40 mph section of the scenario, to a rural setting for the final higher speed sections of the scenario. This scenario was free from stop signs and traffic lights; however, other traffic of varying speeds was placed in the nearside (or left hand lane) for the driver to negotiate. The scenario was 6.3 km in length and took approximately 5 minutes to complete.
Secondary Task
during driving, as well as to evaluate distraction and workload caused by IVIS25,26. PDT has been shown to be a reliable measure of driver workload and is particularly suited to simulator testing. The basic premise of the PDT is that during times of increased driving mental workload, the driver will reduce the time spent looking in the peripheries of their vision. This includes the peripheries of their forward vision as well as scanning and monitoring of instrument panels and mirrors11,27. This current paper also suggests that when using an IVIS the PDT will give further estimations of (although not a replacement for) eyes off road time.
The STISim software conveniently provides a PDT event, comprising red symbols near the top corners of the central screen. When in the driving seat these symbols appear in the top left and right of the drivers’ peripheral vision. At 10 predefined times throughout the driving scenario these symbols changed from their default shape of a red diamond to a red triangle. The driver’s task was to respond as soon as they noticed the change by pressing a corresponding button on the steering wheel. The STISim software automatically recorded the response time and whether or not it was a correct response. If no response is made within 10 seconds, a ‘miss’ is recorded and the symbol reverts to its default. Again to limit the learning effect, two different sets of divided attention events were written for each driving cycle.
Measures of Driving Performance
Objective parameters of primary (i.e., driving) task performance were recorded automatically by the simulator software. For the purposes of this paper the following variables were used: Mean driving speed and lane position over the entire run; and number of errors/violations (includes speeding, crashes, running red lights etc). In addition, PDT variables of mean response time and number of correct response were also recorded and presented in this paper.
Two different questionnaires were used to rate participants’ subjective ratings of driving performance and workload; these were the NASA-Task Load Index (TLX28) and the Driver Activity Load Index (DALI29). The TLX is a widely accepted standard subjective workload measure and is considered to be very sensitive and reliable in comparison to other ratings scales30. It has also been used extensively in driving related research7,11,25,31. The specific version of the TLX questionnaire used in the current study uses the un-weighted sum of the subscales values, often called Raw TLX or RTLX30. The questionnaire asks participants to rate their perceived workload on six subscales: mental demand, physical demand, temporal demand, performance, effort and frustration. DALI is heavily based on the TLX and evaluates workload specifically during the driving task. It is less frequently used but more tailored for the evaluation of IVIS, with ratings for six factors (global attention demand, visual demand, auditory demand, stress, temporal demand and interference), each scored from zero to five (low to high). A mean value is then calculated for all six factors, resulting in the DALI rating.
Participants
Participants were paid a nominal fee for their involvement in the study. All participants experienced all conditions of the study in a within-subjects design.
Procedure
Each drive cycle was completed for each of the interfaces and the baseline condition, this totalled six experimental runs. In addition, participants were given a five-minute practice run in the simulator to get used to the controls and the PDT before the experimental trials began. The practice run consisted of a mixed driving route, encompassing city and dual carriageway, as well as intersections. At the end of this practice run, participants were offered chance to repeat it until they were comfortable with the controls and procedure. Once they were happy, the baseline conditions were completed, with the order of driving cycle randomised. The baseline conditions (i.e., without any HMI feedback) were always completed first in order to evaluate participants’ driving pre- and post-feedback, although the present paper does not report these performance data. The remaining HMI conditions were fully randomised both in terms of HMI design and driving cycle.
Before the interface conditions were completed, participants were given an introduction to the two HMI designs. This briefing was considered very important as it ensured that participants evaluated the scenarios and HMIs with some knowledge of what the displays were trying to convey. Rather than contaminating the study, it was felt that such briefings were essential in obtaining meaningful data, and were realistic in merely covering the kind of information which might be found in an instruction manual or supporting documentation for the Foot-LITE product.
At the end of each condition the participants were asked to complete the subjective questionnaires. The DALI questionnaire was only completed following the HMI experimental conditions, as it focuses on interference from the smart driving aid which was obviously not relevant for the baseline condition. The TLX questionnaire was completed after all conditions.
Data Analysis
The subjective measures of driving performance (TLX and DALI) were assessed using Friedman and Wilcoxon Signed Rank tests, while the driving data were assessed using a MANOVA and related pairwise comparisons. Statistical significance was accepted at p<0.05.
RESULTS
Table 1 – Mean data for primary task performance, secondary task and subjective measures (respectively) for all three experimental conditions and both driving scenarios.
Urban Extra-Urban
Base EID DB Base EID DB
Speed 18.8 17.1 16.9 46.8 41.8 43.5
Violations 6.29 6.46 4.63 5.50 4.62 3.88
Lane 17.7 18.5 18.1 14.7 15.2 14.8
Correct Resp 8.63 9.54 9.33 9.42 9.67 9.58
TLX 51.5 46.8 48.6 37.7 38.0 37.1
DALI - 2.45 2.74 - 2.21 2.17
The analyses identified differences between the three experimental conditions (baseline, EID and DB) as well as interactions within the driving cycles. The following section details results from the study, with Table 1 summarising the mean data.
Primary Task Performance
The parameters of primary task performance analysed in this study were mean driving speed and mean lane position over the entire length of the driving scenario, as well as the number of driving violations (which included speed exceedances, lane deviations, running red traffic lights, and crashes). A significant main effect was observed for the number of violations between the experimental conditions (F(2,68) = 3.96, p < 0.05), with the EID standing out as having the greatest number of traffic violations with an average of 6.5 (SD = 2.9) violations in the urban cycle, while the DB interface was associated with the fewest violations. The pairwise comparison between the EID and DB interfaces was also significant (p < 0.05). No difference was observed with traffic violation in the extra-urban cycle. Mean lane position not differ between any of the conditions in either driving cycles.
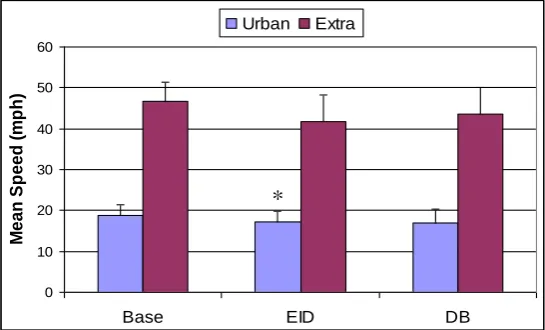
Mean driving speed in the urban cycle returned a significant main effect between the three interface conditions (F(2,68) = 3.11, p = 0.05). Whilst the pairwise comparisons revealed no significant differences,
[image:9.595.99.495.71.112.2]Figure 2 shows that mean driving speed with both interface designs was lower than that of the baseline condition. As with the urban cycle, mean driving speed in the extra-urban cycle also elicited a significant main effect between the conditions (F(2,68) = 4.31, p < 0.05). As shown in Figure 2, the smart driving feedback delivered by either the EID or DB interface resulted in a lower mean driving speed when compared to the baseline condition; this difference was significant when looking at the pairwise comparisons between EID and baseline conditions (p
< 0.05).
0 10 20 30 40 50 60
Base EID DB
M
e
a
n
S
p
e
e
d
(
m
p
h
)
Urban Extra
Figure 2 – Mean driving speed for each experimental condition in urban and extra-urban driving cycles. Asterisk indicates significant difference (p<0.05) between EID and
baseline conditions. Error bars represent standard deviation of the data.
[image:9.595.161.434.529.694.2]Secondary Task Performance
Measures of secondary task performance in this study were number of correct responses and mean response time on the PDT. Table 1 shows that the smart driving feedback conditions resulted in faster response times to the PDT when compared to the baseline condition in the urban cycle, although the analyses proved this difference was non-significant. However, a significant main effect was observed for the number of correct responses to the PDT (F(2,68) = 4.20, p < 0.05). The EID condition resulted in the greatest number of correct responses, averaging 9.5 (out of 10 divided attention events). Pairwise comparisons revealed that this difference was significant (p<0.05) when compared to baseline condition in the urban cycle.
Also shown in Table 1 the mean response time and number of correct responses to the PDT were all very similar between all three experimental conditions in the extra-urban cycle, with no significant main effects or pairwise comparisons being observed.
Subjective Measures
A series of questionnaires were used to measure subjective workload on the driver for each condition. The NASA-TLX was completed following all scenarios (baseline and interface), with DALI being completed only after the interface conditions for both driving cycles.
NASA-TLX
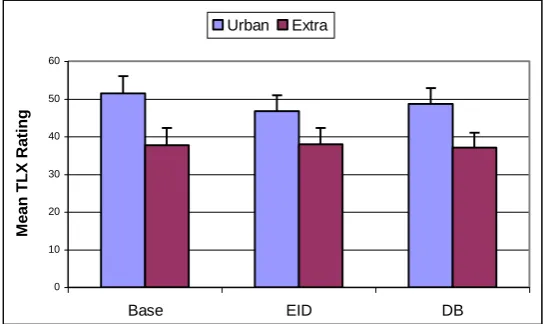
When considering the urban driving cycle, results from the TLX questionnaire showed a non-significant trend for participants to rate the baseline condition as higher workload than when using the smart driving aids, at 51.5 against 46.8 and 48.6 for EID and DB respectively ( Figure 3). TLX ratings for the extra-urban cycle showed no differences between any conditions. As may have been expected given the set up of the driving scenarios, the extra-urban cycle was rated significantly lower workload (p<0.05) compared to urban (
Figure 3).
0 10 20 30 40 50 60
Base EID DB
M
e
a
n
T
L
X
R
a
ti
n
g
Urban Extra
[image:10.595.161.433.544.706.2]DALI
DALI is more IVIS specific, with questions focusing on visual demand and interference of systems, in addition to some more standard ratings as covered in the TLX questionnaire. Results from this study show that participants rated the EID interface significantly lower workload (Z = -1.99, p < 0.05) than the DB interface design when driving the urban cycle. No difference was observed when comparing the two interfaces during the extra-urban cycle ( Figure 4). As with the TLX ratings, urban driving was rated as significantly lower (p < 0.05) than the extra-urban route.
0 1 2 3
EID DB
M
e
a
n
D
A
L
I
R
a
ti
n
g
Urban Extra
Figure 4 – Mean DALI rating given by participants for each experimental condition for both urban and extra-urban scenarios. Asterisk indicates significant (p<0.05) difference
between EID and DB condition. Error bars represent standard error.
DISCUSSION
Primary Task Performance
When considering the effect of the smart driving aids on driving performance, this study found that driving speed was significantly reduced across both urban and extra-urban driving scenarios when using either of the HMI options. A decrease in driving speed is generally a positive result, as it’s been linked to a decrease in the number and severity of accidents32,33,34, as well as increases in fuel economy. However, a decrease in driving speed has also been observed when drivers are engaged in a mobile phone conversation while driving35,36. This is considered to be a compensatory behaviour in an attempt to reduce workload, as well as to increase perceived safety margins36, and so could be indicative of increased distraction. It is unclear within the literature if these adaptations to mobile phone use are positive or not. Brookhuis et al (1991, pp. 315)37 recommended that drivers ‘…drive at moderate speed in the slower traffic lanes.’ Sudden or unexpected decreases in speed can be hazardous, however an overall reduction in driving speed should have a positive safety impact.
There are, of course, other more positive explanations for the reduction in driving speed – which are wholly consistent with the aims of Foot-LITE. The presence of a smart driving aid
[image:11.595.162.435.240.402.2]may have encouraged participants to reduce speed in an effort to facilitate safe and efficient driving. Further analysis of the data is necessary to determine the specific nature and causes behind the overall mean speed reduction observed.
Conversely, the absence of any differences in mean lane position could be interpreted positively (as an absence of distraction) or negatively (no positive effects of the smart driving aids). Given that both interfaces provided specific advice on lane discipline, further analyses of the data are necessary to determine whether baseline performance was already at ceiling.
The final measure of primary task performance was total number of violations over the entire run, including speed exceedances, lane departures, traffic light running and crashes. In the extra-urban condition there was a non-significant trend for the HMI feedback conditions to elicit a decrease in the number of violations occurring (see Table 1). All bar one of these violations were speed exceedances, with one lane departure occurring in the DB condition.
When considering violations in the urban cycle, an interesting issue arises which requires further attention and analysis. The EID condition resulted in significantly more violations compared to the DB condition, with the number of EID violations also being very slightly higher than the baseline condition. When looking at the type of violations that made up this increase we see that the EID condition resulted in 38% more speed exceedences than the DB condition (137 versus 99 for EID and DB respectively). This significant increase in speed violations was not reflected in the mean speed as there was only a difference of 0.17 mph over the entire run between the EID and DB interface conditions (Table 1). Further analysis of the data will allow us to review speed limit compliance, as STISim exports the absolute number of speed exceedences irrespective of the length (or percentage) of time spent over the speed limit. Thus it is possible that there were more – but shorter – violations in the EID condition, an outcome which may actually indicate greater compliance with the smart driving advice.
Secondary Task Performance
PDT performance, both in number of correct responses and mean response times, has been shown to be sensitive to changes in driver workload as well as distraction caused by the use of IVIS25,26. Deterioration in PDT performance, represented by either an increase in response time or decrease in correct responses, would indicate that the smart driving aids were adversely affecting driver attention. Results for the extra-urban driving scenario showed that no differences were observed between the baseline conditions and either of the smart driving aid conditions. Thus the presence of a smart driving aid giving real-time, pertinent and timely advice to the driver did not result in an increase in driver distraction for extra-urban driving.
Furthermore, since peripheral detection events were randomised there is unlikely to be a learning effect for event timings or locations between conditions.
The authors propose that the improvements in PDT performance with the smart driving feedback is a result of the changes in driving behaviour that smart driving is trying to effect - namely planning ahead, maintaining a consistent speed profile and adhering to posted speed limits. As already reported, the smart driving aids resulted in a decrease in mean driving speed over the entire scenario of between 10 and 12% when compared to the baseline condition. Such a decrease in driving speed may allow the driver more time to adapt to upcoming events (such as change in traffic light, car pulling out etc) which may ultimately be reflected in PDT performance. Another possible factor may be that participants were more attuned to visually scanning their driving environment as a direct result of having a visual display in the vehicle itself. Research has shown that when driving under higher mental workloads (as the urban cycle was compared to the extra-urban), driver vision tends to focus on the forward facing view and less on the peripheries11. The presence of the smart driving interfaces may have encouraged drivers to maintain wider visual scanning patterns inside and outside the car, facilitated by the observed decrease in driving speed, and thus increasing recognition of the peripheral detection events.
Subjective Measures
TLX
In the urban cycle, the EID condition resulted in the lowest TLX rating, closely followed by the DB, but no significant differences were observed between any of the conditions. Even an assessment of the individual TLX subscales did not reveal much within the urban cycle, other than that the highest rated factors across all experimental conditions were mental demand and effort - both of these being significantly higher (p < 0.05) than physical demand, which received the lowest rating.
Likewise, the mean ratings for TLX data from the extra-urban cycle for all three interface conditions were very similar. An interesting (though nonsignificant) observation emerged on ratings of own performance, which were around 9% worse when driving with the EID display compared to the DB display. Anecdotal evidence from the participants suggested that the large red warning displays on the EID interface made them feel they were driving poorly when compared to the more subtle indicators on the DB display. It was an original aim of the EID display to provide large, clear feedback at times when safety parameters were compromised. However, this observation suggests that careful considerations need to be made regarding drivers self rating of performance, since one of the key objectives of Foot-LITE was to provide positive, reinforcing advice and feedback. We do not want to decrease driving confidence unnecessarily or risk non-compliance.
(one small, one large). Other studies have also shown TLX ratings to differ significantly with increasing task complexity7,11. On the whole, then, the TLX data suggest that the EID and DB interfaces are comparable in terms of subjective workload.
DALI
DALI, on the other hand, did reveal some differences between the interfaces. DALI is based on the TLX but slightly shifts the focus of the questionnaire to be more driving specific and relevant to IVIS, with the inclusion of factors such as visual demand and interference. Given this focus, DALI was only completed following the smart driving feedback conditions and not the baseline condition. As with the TLX ratings no differences were observed between the conditions in the extra-urban driving scenario, with mean data again being very similar. However, when the data for the urban environment was analysed, the EID was rated significantly lower in workload demand compared to the DB display. The difference in the mean data equated to around a 12% reduction for the EID display. This difference was more marked when considering the factor of global attention demand, which was 17% higher in the DB condition. Previous research has shown differences with DALI ratings when using a mobile phone while driving38, more specifically the load index was significantly higher for auditory and interference factors when engaged in a mobile phone conversation.
In the presence of significant primary task demands during the urban scenario, it can be safely assumed that lower workload ratings for the EID interface suggest a preferred design. It is our interpretation that the dynamic and integrated EID design for real-time smart driving feedback produced the decrease in driver workload when compared to the more conventional, piecemeal icon and warning based display that was the DB.
SUMMARY AND CONCLUSIONS
Concern has been expressed in the literature that the use of IVIS can cause driver distraction and be detrimental to driving performance. Moreover, the proliferation of such systems on or coming to market means that such issues will continue to dominate research and policy. One way that distraction and workload can be minimised is by ergonomic design and rigorous testing of in-car interfaces.
Foot-LITE aims to give real-time, pertinent and tailored smart driving advice to the driver in the vehicle. Whilst this system will obviously result in another information display for the driver to interact with, the project’s objectives are to minimise any potential driver distraction through the development and testing of an ergonomically designed interface display. The study reported in the present paper is part of that process, where it has been demonstrated that the delivery of smart driving information did not increase driver workload (as measured by TLX), nor did it adversely affect driver distraction (assessed with the PDT). Conditions where smart driving feedback was given resulted in a decrease in mean driving speed in both an urban (or complex) and extra-urban (or simple) driving environment. Subjective workload further revealed valuable differences between the two interface designs being evaluated.
previous research, which generally implies that the use of IVIS increases workload and distraction, ultimately worsening driving performance. If the positive effects of Foot-LITE are borne out through the further testing and development planned in the rest of the project, it could show that IVIS systems do not necessarily have to increase workload or distraction, if they are designed appropriately. Positive and helpful information, such as that given to the driver by Foot-LITE, may actually improve driving performance while minimising workload and distraction. Moreover, the nature of the information display developed so far seems to actually improve attention and workload.
The next stage of the project is to validate these findings on the road using the University of Southampton’s instrumented vehicle, which is essential given the safety critical nature of in-vehicle feedback. Concurrently further studies will be run using BUDS to evaluate appropriate methods for delivering feedback in high and low mental workload situations, as well as an assessment of multimodal feedback – both auditory and haptic – to complement the visual display.
ACKNOWLEDGEMENTS
Foot-LITE is sponsored by the Technology Strategy Board, Engineering and Physical Sciences Research Council and the UK Department for Transport. Project partners include MIRA Ltd, Ricardo Ltd, TRW Connekt Ltd, HW Communications Ltd, Zettlex Ltd, Auto_txt Ltd, the Institute of Advanced Motorists, Hampshire County Council, Transport for London, Newcastle University and Southampton University. Specific thanks go to Eric Chan and Pavel Jelinek of Ricardo and Daniel Essafi of HW Comms for their HMI expertise.
REFERENCES
1
Young, K., Regan, M., Hammer, M. (2003). Driver distraction: A review of the literature. MUARC Report No 206, pp. 1-66. Monash University, Victoria, Australia.
2
Mosedale, J., Purdy, A., Clarkson, E. (2004). Contributory factors to road accidents. Transport Statistics: Road Safety, Department for Transport, London, UK,
3
Stevens, A., Minton, R. (2001). In-vehicle distraction and fatal accidents in England and Wales. Accident Analysis & Prevention, vol. 33, pp. 539-545.
4
Strutts, J., Reinfurt, D., Staplin, L., Rodgman, E. (2001). The role of driver distraction in traffic crashes. University of North Carolina Highway Safety Research Center, Chapel Hill, NC, May 2001.
5
Wang, J., Knipling, R.,Goodman, M. (1996). The role of driver inattention in crashes: New statistics from the 1995 crashworthiness data system. 40th Annual Advancement for
Automotive Medicine Conference, Vancouver, Canada, October, 1996.
6
Neyens, D., Boyle, L. (2007). The effect of distractions on the crash type of teenage drivers.
Accident Analysis & Prevention, vol. 39, pp. 206-212. 7
8
Donmez, B., Boyle, L., Lee, J. (2007). Safety implications of providing real-time feedback to distracted drivers. Accident Analysis & Prevention, vo. 39, pp. 581-590.
9
Liu, B.-S. and Lee, Y.-H. (2006) In-vehicle workload assessment: Effects of traffic situations and cellular telephone use. Journal of Safety Research, vol. 37, pp. 99-105.
10
May, A., Ross, T., Osman, Z. (2005). The design of next generation in-vehicle navigation systems for the older driver. Interacting with Computers, vol. 17, pp. 643-659.
11
Harbluk, J., Noy, Y., Trbovich, P., Eizenman, M. (2007). An on-road assessment of cognitive distraction: Impacts on drivers' visual behaviour and braking performance. Accident Analysis & Prevention, vol. 39, pp. 372-379.
12
Angell, L., Auflick, J., Austria, P., Kochhar, D., Tijerina, L., Biever, W., Diptiman, T., Hogsett, J., Kiger, S. (2006). Driver workload metrics project: Task 2 final report. Crash Avoidance Metrics Partnership (CAMP), Farmington Hills, MI, DOT HS 810 635.
13
EEA. (2007). Transport and environment: On the way to a new common transport policy. European Environment Agency Report, pp. 1-38.
14
ERSO. (2007). Annual Statistical Report 2006. European Road Safety Observatory, pp.1-64. 15
Arroyo, E., Sullivan, S., Selker, T., (2006). CarCoach: Polite and effective driving coach. In Proceedings of the CHI: Conference on Human Factors in Computing Systems, pp.357-362. 16
McGehee, D., Raby, M., Carney, C., Reyes, M., Lee, J. (2007). Extending parental mentoring using an event-triggered video intervention in rural teen drivers. Journal of Safety
Research, vol. 38, pp. 15-227.
17
Tomer, T., Lotan, T. (2006). In-vehicle data recorder for evaluation of driving behavior and safety. Transportation Research Record, vol. 1953, pp. 112-119.
18
van der Voort, M., Dougherty, M., van Maarseveen, M. (2001). A prototype fuel efficiency support tool. Transportation Research Part C, vol. 9, pp. 279-296.
19
Young, M., Birrell, S., Stanton, N., (2008). Safe and fuel efficient driving: Defining the benchmarks. In Bust, P (ed) Contemporary Ergonomics 2008, pp. 749-754. Taylor & Francis. 20
Young, M., Birrell, S., Stanton, N. (2009). Design for smart driving: A tale of two interfaces. 13th International Conference on Human Computer Interaction, San Diego, USA. 21
Burns, C., Hajdukiewicz, J. (2004). Ecological Interface Design. Boca Raton,CRC Press. 22
Birrell, S., Young, M., Stanton, N., Jenkins, D., (2008). Improving driver behaviour by design: A Cognitive Work Analysis methodology. In: Applied Human Factors and
Ergonomics 2nd International Conference (CD-ROM).
23
Jenkins, D., Stanton, N., Walker, G., Young, M. (2007). A new approach to designing lateral collision warning systems. International Journal Vehicle Design, vol. 45, pp.379-396. 24
Seppelt, B., Lee, J. (2007). Making adaptive cruise control (ACC) limits visible.
International Journal of Human-Computer Studies, vol. 65, pp. 192-205.
25
Harms, L., Pattern, C. (2003). Peripheral detection as a measure of driver distraction. A study of memory-based verses system-based navigation in a built up area. Transportation
Research Part F, vol. 6, pp. 23-36.
26
27
Recarte, M., Nunes, L. (2000). Effects of verbal and spatial-imagery tasks on eye fixation while driving. Journal of Experimental Psychology: Applied, vol. 9, pp. 31-43.
28
Hart, S., Staveland, L. (1988). Development of NASA-TLX (Task Load Index): Results of empirical and theoretical research. In P. Hancock and N. Meshkati (Eds.), Human Metal
Workload, pp. 139-183. Amsterdam: Elsevier.
29
Pauzie, A., Forzy, J-F. (1996). Ergonomic evaluation of guidance and traffic information in the CARMINAT program. III Annual World Congress on Intelligent Transport Systems, Orlando, FA. CD-Rom.
30
Hill, S., Iavecchia, H., Byers, J., Bittner, A., Zaklad, A., Christ, R. (1992). Comparison of four subjective workload rating scales. Human Factors, vol. 34, pp. 429-439.
31
Stanton, N., Young, M. (2005). Driver behaviour with adaptive cruise control. Ergonomics, vol. 48, pp. 1294-1313.
32
Haworth, N., Symmons, M. (2001). The relationship between fuel economy and safety outcomes. Victoria, Australia: Monash University, pp. 1-57.
33
Taylor, M., Baruya, A., Kennedy, J. (2002). The relationship between speed and accidents on rural single-carriageway roads. Wokingham: TRL Report 511, pp. 1-32.
34
Aarts, L., van Schagen, I. (2006). Driving speed and the risk of road crashes: A review.
Accident Analysis & Prevention, vol. 38, pp. 215-224. 35
Alm, H., Nilsson, H. (1990). Changes in driver behaviour as a function of handsfree mobile telephones: A simulator study. DRIVE Project Report No. 47 V1017 (BERTIE).
36
Haigney, D., Taylor, R., Westerman, S. (2000). Concurrent mobile (cellular) phone use and driving performance: task demand characteristics and compensatory processes.
Transportation Research Part F, vol. 3, pp. 113-121.
37
Brookhuis, K., Vries, G., De Waard, D. (1991). The effects of mobile telephoning on driving performance. Accident Analysis and Prevention, vol. 23, pp. 309-316.
38
Pauzie, A., Pachiaudi, G. (1997). Subjective evaluation of the mental workload in the
driving context. In Rothengatter, T., Carbonell Vaya, E, (eds) Traffic and Transport